| Param | Original file | Final file |
|---|---|---|
| Filename | modeM0/AS1A12_077T12_9000005692_41879cztM0_level2.fits | modeM0/AS1A12_077T12_9000005692_41879cztM0_level2_quad_clean.evt |
| Size (bytes) | 41,546,880 | 11,433,600 |
| Size | 39.6 MB | 10.9 MB |
| Events in quadrant A | 490,173 | 74,338 |
| Events in quadrant B | 287,947 | 80,240 |
| Events in quadrant C | 295,918 | 73,799 |
| Events in quadrant D | 411,932 | 66,733 |
| Mode M0 | |||
|---|---|---|---|
| Quadrant | BADHDUFLAG | Total packets | Discarded packets |
| A | 0 | 1851 | 6 |
| B | 0 | 1269 | 4 |
| C | 0 | 1261 | 6 |
| D | 0 | 1678 | 35 |
| Mode SS | |||
|---|---|---|---|
| Quadrant | BADHDUFLAG | Total packets | Discarded packets |
| A | 0 | 14 | 0 |
| B | 0 | 14 | 0 |
| C | 0 | 14 | 0 |
| D | 0 | 14 | 0 |
| Quadrant | Total seconds | Saturated seconds | Saturation percentage |
|---|---|---|---|
| A | 626 | 36 | 5.750799% |
| B | 626 | 0 | 0.000000% |
| C | 624 | 0 | 0.000000% |
| D | 613 | 8 | 1.305057% |
Noise dominated data is calculated using 1-second bins in cleaned event files. If a bin has >2000 counts, and if more than 50% of those come from <1% of pixels, then it is considered to be noise-dominated and hence unusable.
| Quadrant | # 1 sec bins | Bins with >0 counts | Bins with >2000 counts | High rate bins dominated by noise | Noise dominated (total time) | Noise dominated (detector-on time) | Marked lightcurve |
|---|---|---|---|---|---|---|---|
| A | 629 | 628 | 31 | 31 | 4.93% | 4.94% | 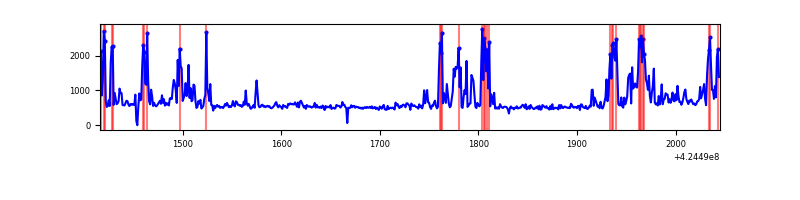 |
| B | 629 | 628 | 0 | 0 | 0.00% | 0.00% | 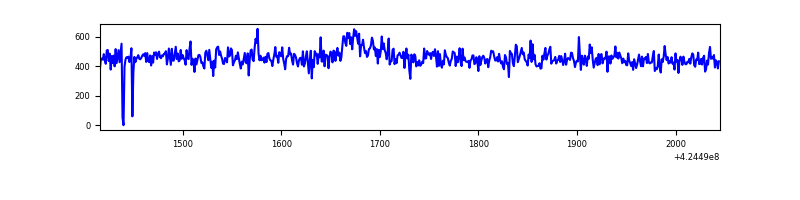 |
| C | 629 | 628 | 0 | 0 | 0.00% | 0.00% | 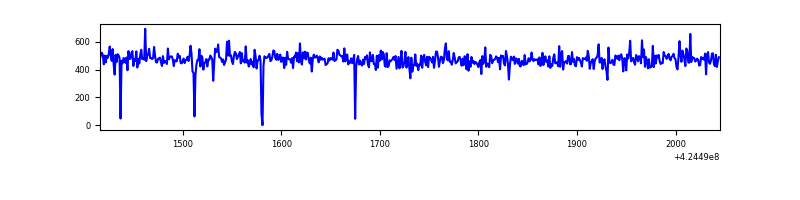 |
| D | 629 | 624 | 15 | 15 | 2.38% | 2.40% | 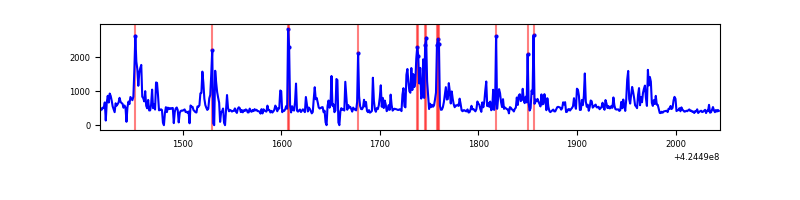 |
Top three noisy pixels from each quadrant. If the there are fewer than three noisy pixels in the level2.evt file, extra rows are filled as -1
| Pixel properties | Quadrant properties | ||||||
|---|---|---|---|---|---|---|---|
| Quadrant | DetID | PixID | Counts | Sigma | Mean | Median | Sigma |
| A | 14 | 24 | 161670 | 10031.66 | 69 | 68 | 16.1 |
| A | 10 | 83 | 46976 | 2911.88 | 69 | 68 | 16.1 |
| A | 7 | 3 | 12401 | 765.59 | 69 | 68 | 16.1 |
| B | 0 | 156 | 6683 | 410.74 | 70 | 69 | 16.1 |
| B | 0 | 190 | 1757 | 104.83 | 70 | 69 | 16.1 |
| B | 12 | 111 | 1678 | 99.92 | 70 | 69 | 16.1 |
| C | 15 | 214 | 24745 | 1403.65 | 67 | 67 | 17.6 |
| C | 0 | 10 | 7197 | 405.54 | 67 | 67 | 17.6 |
| C | 13 | 61 | 475 | 23.21 | 67 | 67 | 17.6 |
| D | 12 | 6 | 107322 | 6082.73 | 65 | 63 | 17.6 |
| D | 5 | 222 | 50458 | 2857.93 | 65 | 63 | 17.6 |
| D | 2 | 234 | 2116 | 116.43 | 65 | 63 | 17.6 |
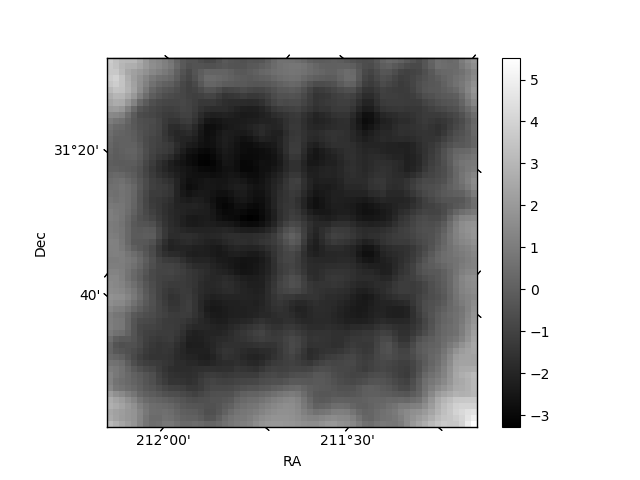
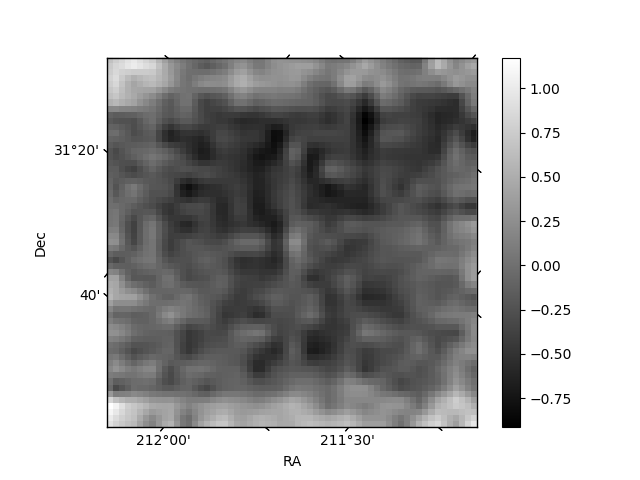
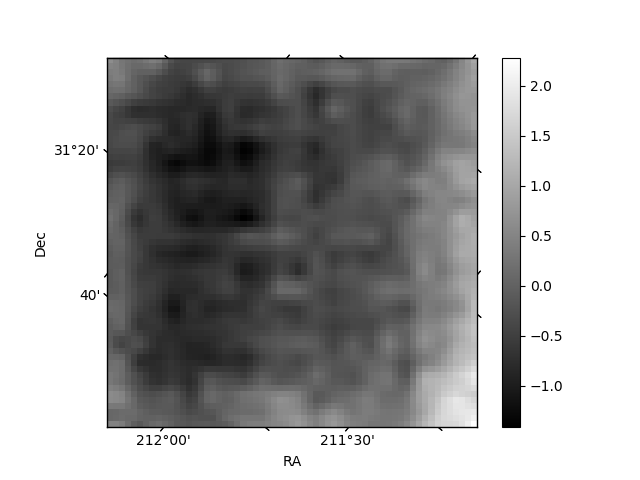
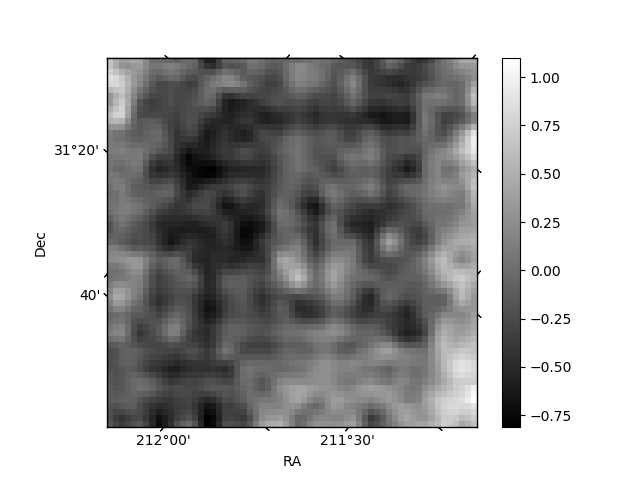
Histogram calculated using DETX and DETY for each event in the final _common_clean file
| Quadrant A | 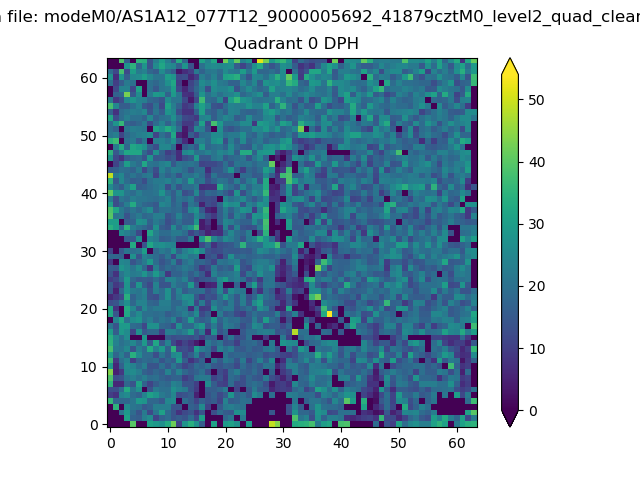 |
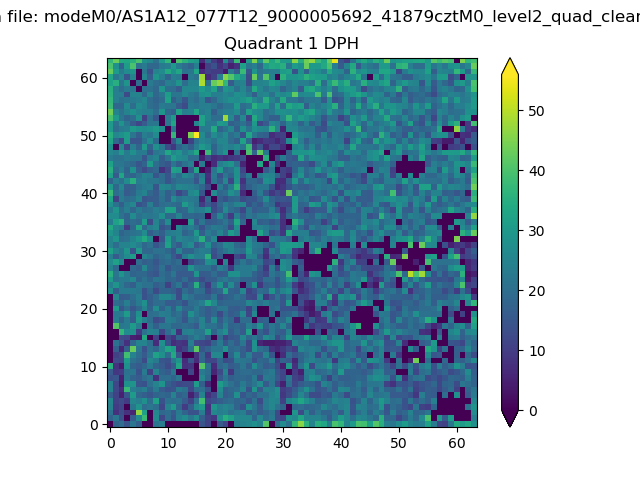 |
Quadrant B |
|---|---|---|---|
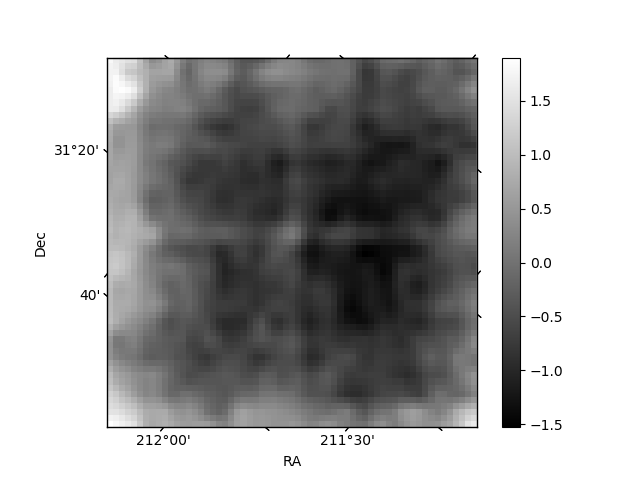
| Quadrant D | 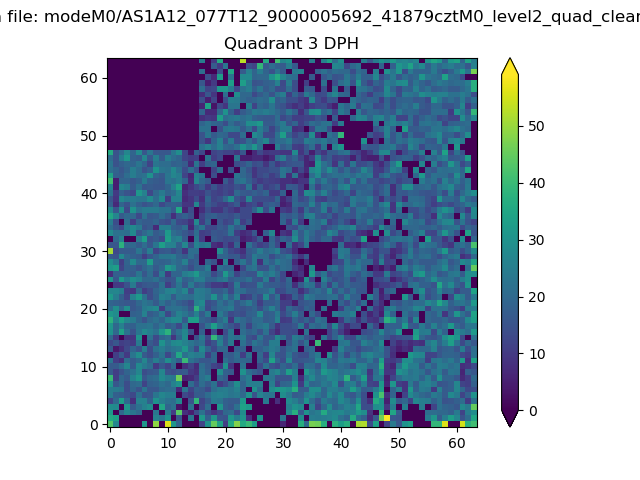 |
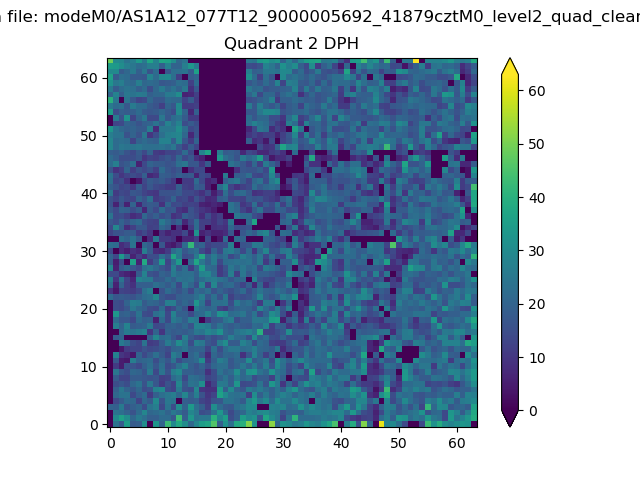 |
Quadrant C |
| Plot type | Count rate plots | Images |
|---|---|---|
| Comparison with Poisson distribution Blue bars denote a histogram of data divided into 1 sec bins. Red curve is a Poisson curve with rate = median count rate of data. |
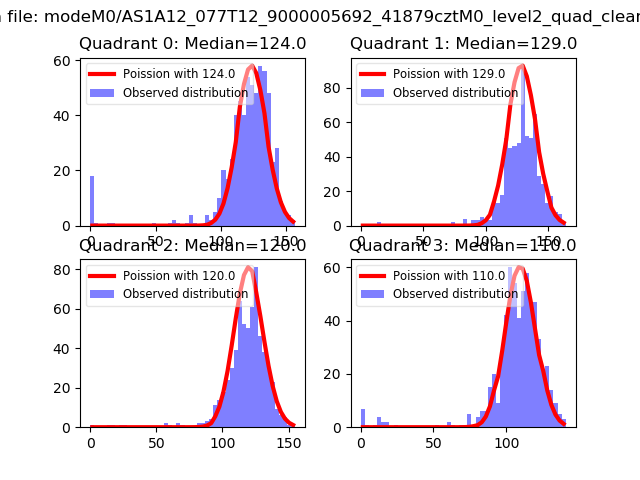 |
 |
| Quadrant-wise count rates Data is divided into 100 sec bins |
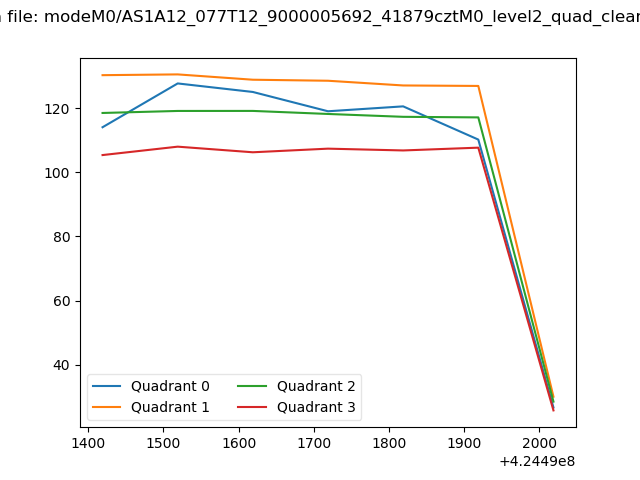 |
|
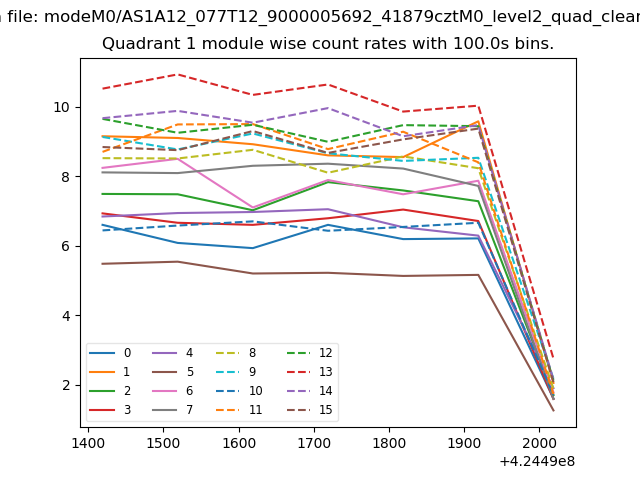
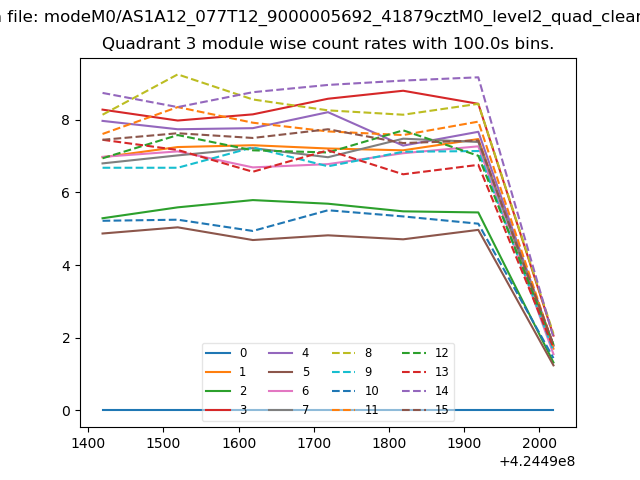
| Module-wise count rates for Quadrant A Data is divided into 100 sec bins |
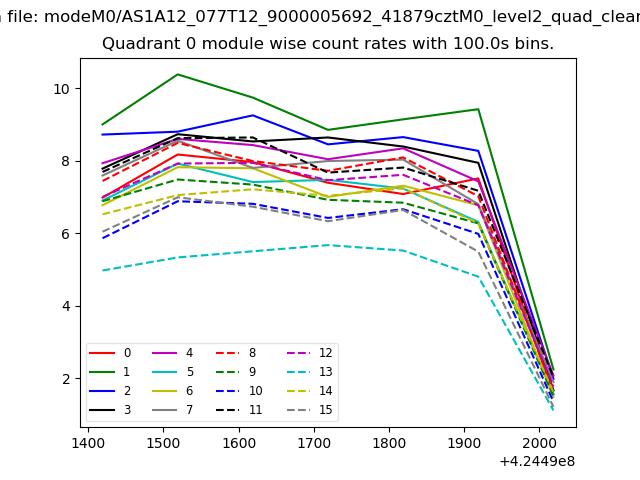 |
 |
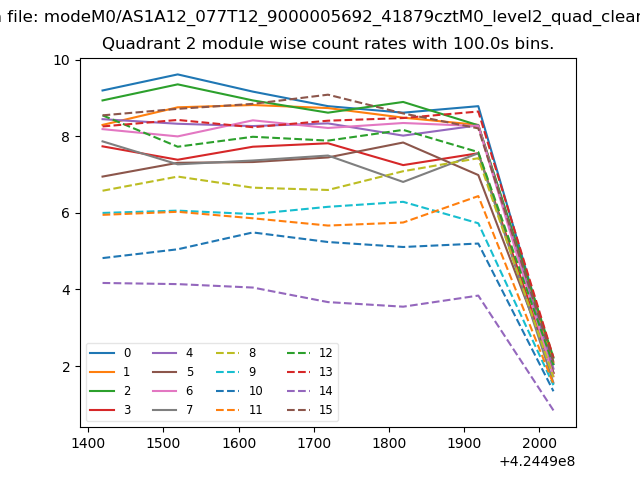
| Module-wise count rates for Quadrant B Data is divided into 100 sec bins |
 |
 |
| Module-wise count rates for Quadrant C Data is divided into 100 sec bins |
 |
 |
| Module-wise count rates for Quadrant D Data is divided into 100 sec bins |
 |
 |
| Parameter | Plot |
|---|---|
| CZT HV Monitor | 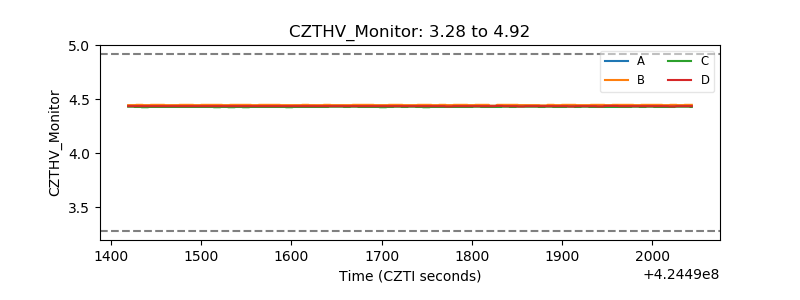 |
| D_VDD | 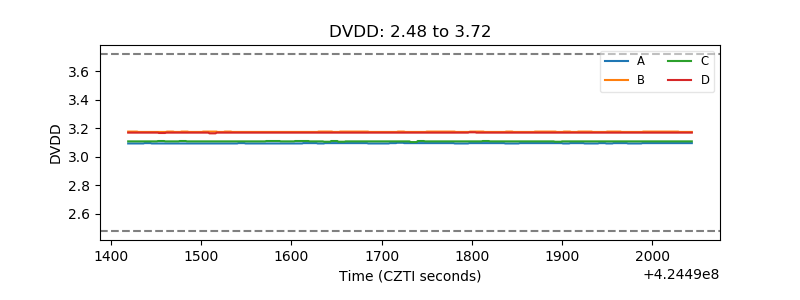 |
| Temperature 1 | 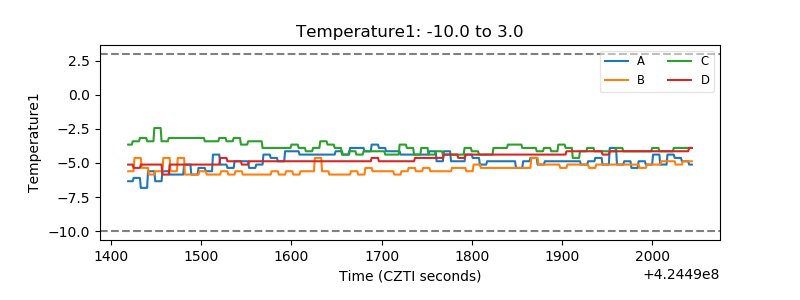 |
| Veto HV Monitor | 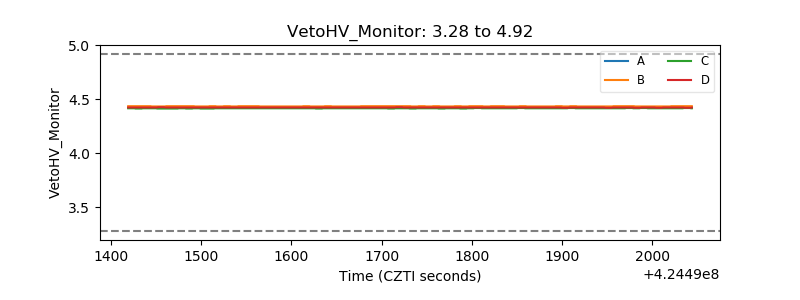 |
| Veto LLD | 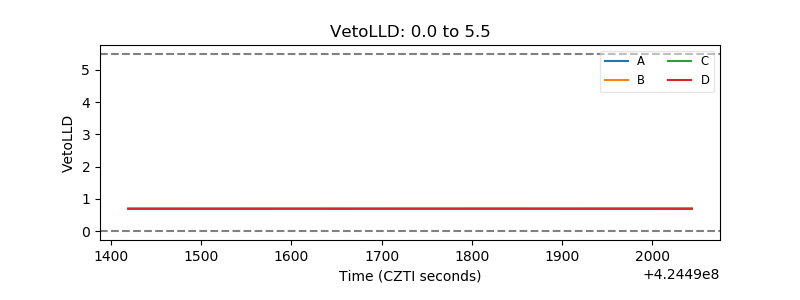 |
| Alpha Counter | 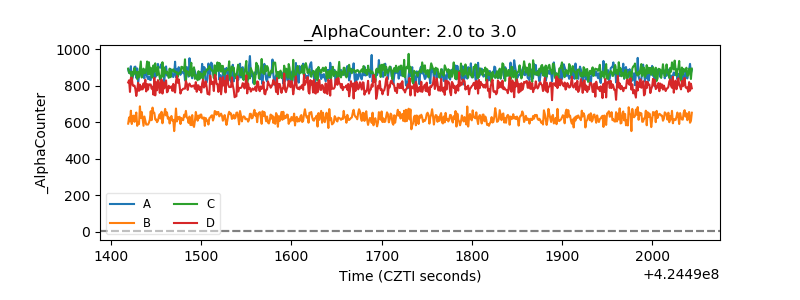 |
| _CPM_Rate | 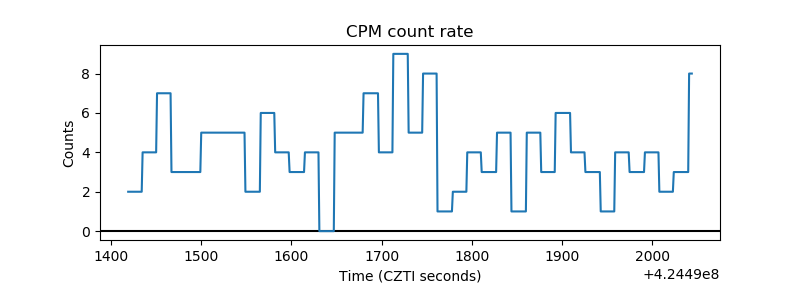 |
| CZT Counter | 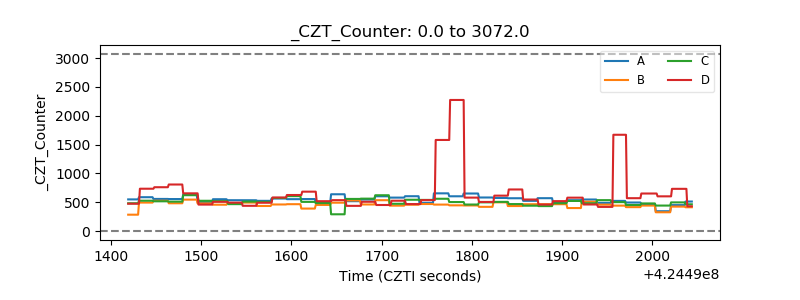 |
| +2.5 Volts monitor | 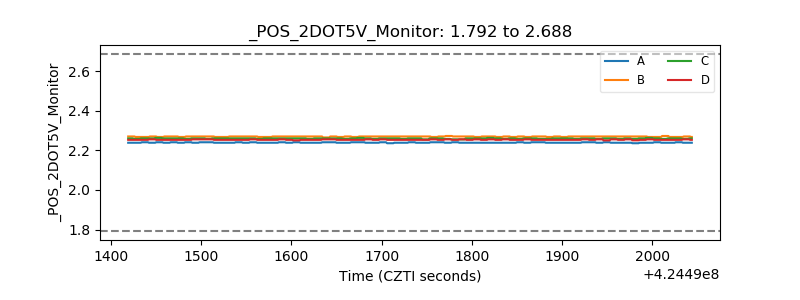 |
| +5 Volts monitor | 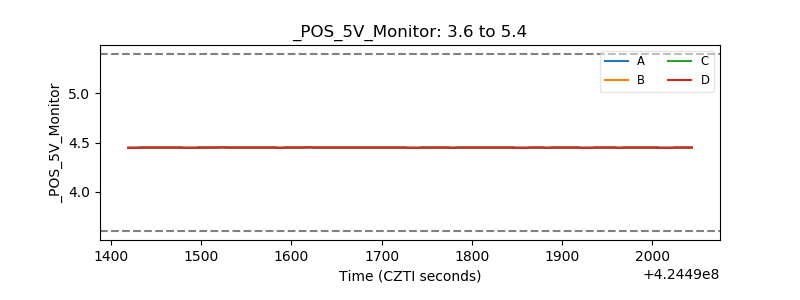 |
| _ROLL_ROT | 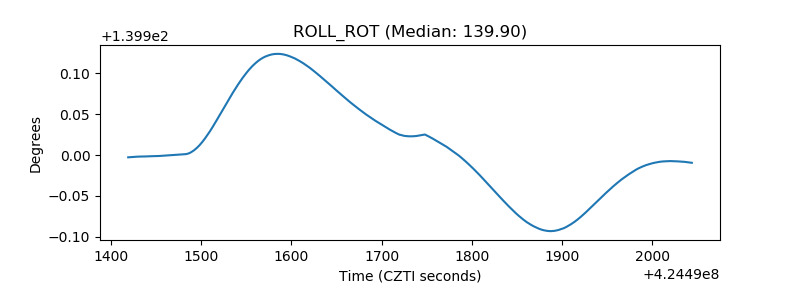 |
| _Roll_DEC |  |
| _Roll_RA | 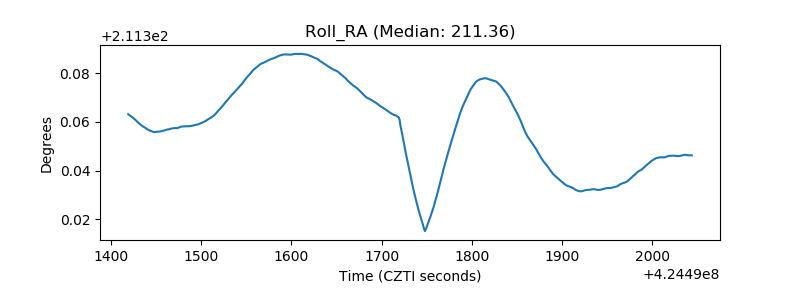 |
| Veto Counter | 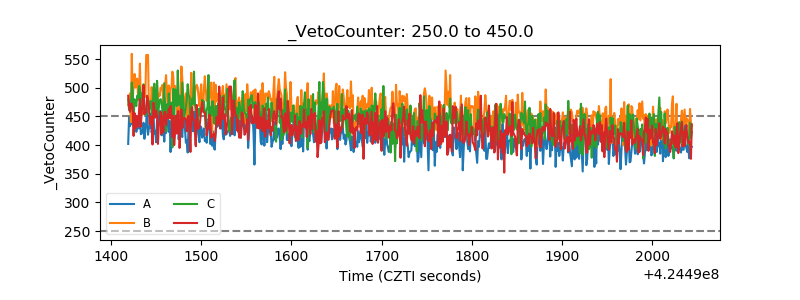 |