| Param | Original file | Final file |
|---|---|---|
| Filename | modeM0/AS1A12_070T01_9000005694_41725cztM0_level2.fits | modeM0/AS1A12_070T01_9000005694_41725cztM0_level2_quad_clean.evt |
| Size (bytes) | 210,568,320 | 58,858,560 |
| Size | 200.8 MB | 56.1 MB |
| Events in quadrant A | 2,061,954 | 394,416 |
| Events in quadrant B | 1,557,789 | 400,577 |
| Events in quadrant C | 1,830,979 | 380,326 |
| Events in quadrant D | 2,060,824 | 351,235 |
| Mode SS | |||
|---|---|---|---|
| Quadrant | BADHDUFLAG | Total packets | Discarded packets |
| A | 0 | 74 | 0 |
| B | 0 | 74 | 0 |
| C | 0 | 74 | 0 |
| D | 0 | 74 | 0 |
| Mode M9 | |||
|---|---|---|---|
| Quadrant | BADHDUFLAG | Total packets | Discarded packets |
| A | 0 | 15 | 0 |
| B | 0 | 15 | 0 |
| C | 0 | 15 | 0 |
| D | 0 | 15 | 0 |
| Mode M0 | |||
|---|---|---|---|
| Quadrant | BADHDUFLAG | Total packets | Discarded packets |
| A | 0 | 8394 | 1 |
| B | 0 | 7360 | 2 |
| C | 0 | 7888 | 1 |
| D | 0 | 8871 | 1 |
| Quadrant | Total seconds | Saturated seconds | Saturation percentage |
|---|---|---|---|
| A | 3614 | 29 | 0.802435% |
| B | 3613 | 3 | 0.083033% |
| C | 3613 | 90 | 2.491005% |
| D | 3613 | 122 | 3.376695% |
Noise dominated data is calculated using 1-second bins in cleaned event files. If a bin has >2000 counts, and if more than 50% of those come from <1% of pixels, then it is considered to be noise-dominated and hence unusable.
| Quadrant | # 1 sec bins | Bins with >0 counts | Bins with >2000 counts | High rate bins dominated by noise | Noise dominated (total time) | Noise dominated (detector-on time) | Marked lightcurve |
|---|---|---|---|---|---|---|---|
| A | 5076 | 3615 | 24 | 24 | 0.47% | 0.66% | 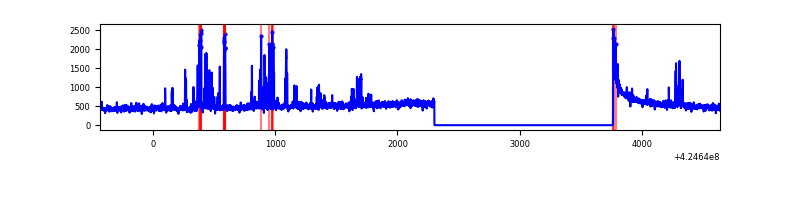 |
| B | 5075 | 3614 | 0 | 0 | 0.00% | 0.00% | 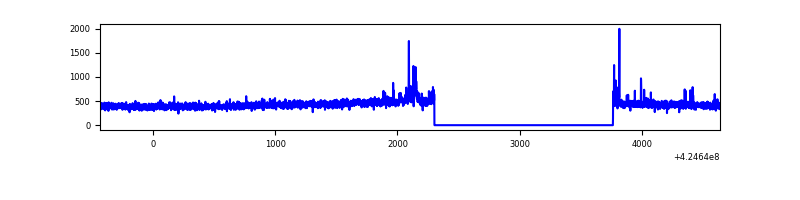 |
| C | 5075 | 3614 | 87 | 87 | 1.71% | 2.41% | 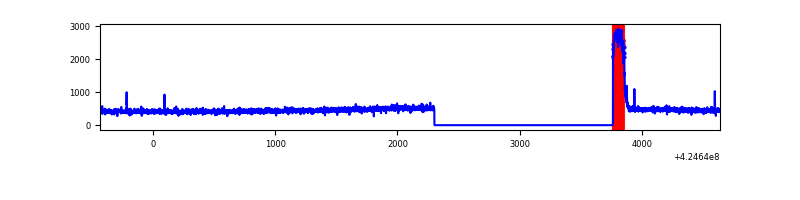 |
| D | 5075 | 3614 | 125 | 125 | 2.46% | 3.46% | 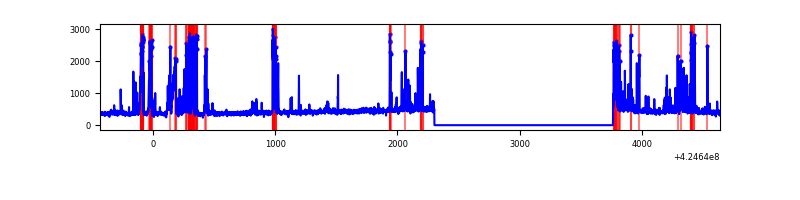 |
Top three noisy pixels from each quadrant. If the there are fewer than three noisy pixels in the level2.evt file, extra rows are filled as -1
| Pixel properties | Quadrant properties | ||||||
|---|---|---|---|---|---|---|---|
| Quadrant | DetID | PixID | Counts | Sigma | Mean | Median | Sigma |
| A | 10 | 83 | 325452 | 3965.13 | 390 | 381 | 82.0 |
| A | 2 | 79 | 184750 | 2248.88 | 390 | 381 | 82.0 |
| A | 13 | 248 | 29961 | 360.81 | 390 | 381 | 82.0 |
| B | 15 | 35 | 17621 | 227.53 | 383 | 373 | 75.8 |
| B | 5 | 255 | 14551 | 187.03 | 383 | 373 | 75.8 |
| B | 12 | 111 | 9739 | 123.55 | 383 | 373 | 75.8 |
| C | 0 | 10 | 240077 | 2762.91 | 369 | 372 | 86.8 |
| C | 15 | 214 | 142220 | 1634.98 | 369 | 372 | 86.8 |
| C | 14 | 254 | 4402 | 46.45 | 369 | 372 | 86.8 |
| D | 13 | 249 | 380558 | 4043.04 | 372 | 360 | 94.0 |
| D | 12 | 218 | 59132 | 624.98 | 372 | 360 | 94.0 |
| D | 12 | 6 | 53775 | 568.01 | 372 | 360 | 94.0 |
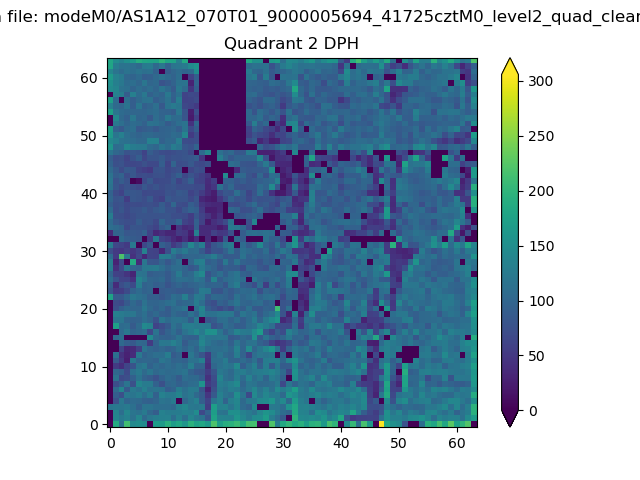
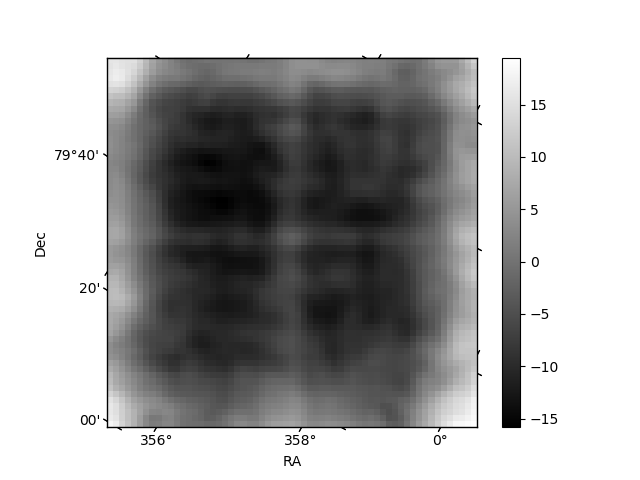
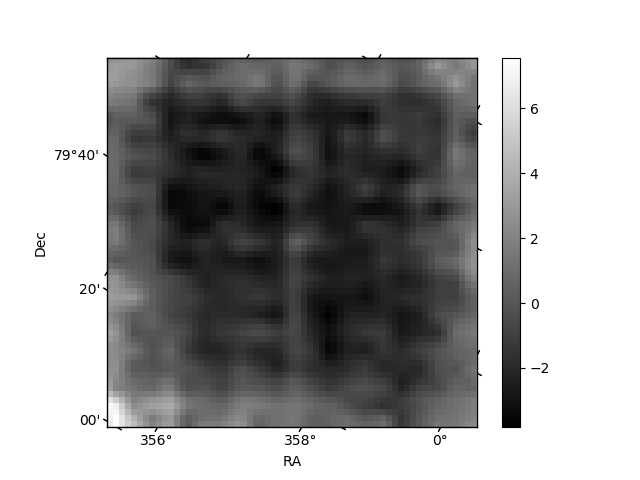
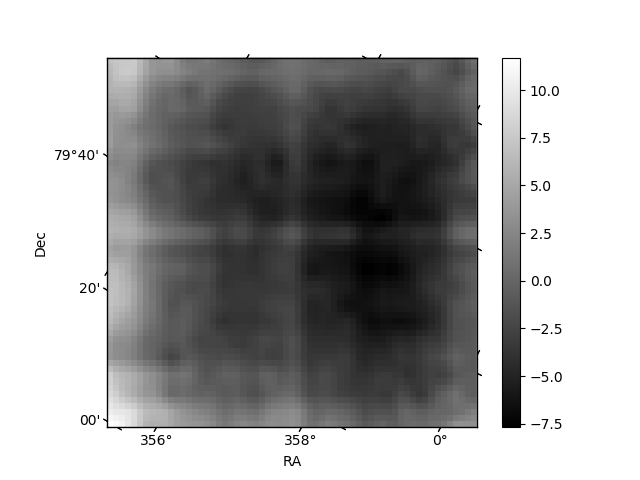
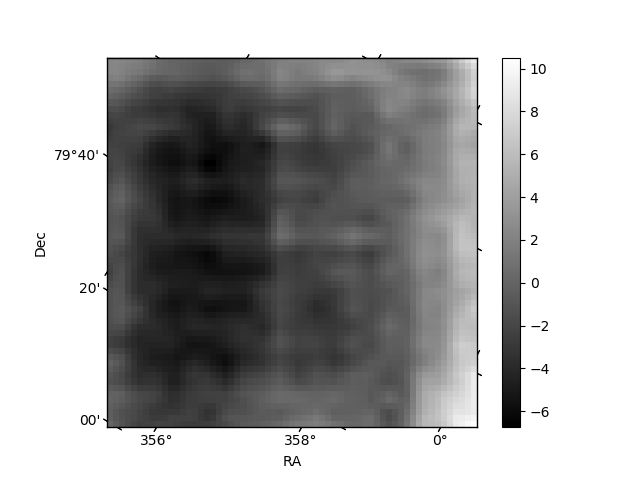
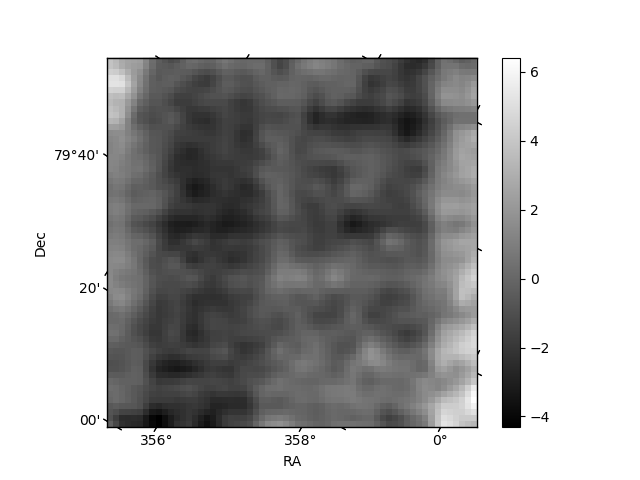
Histogram calculated using DETX and DETY for each event in the final _common_clean file
| Quadrant A | 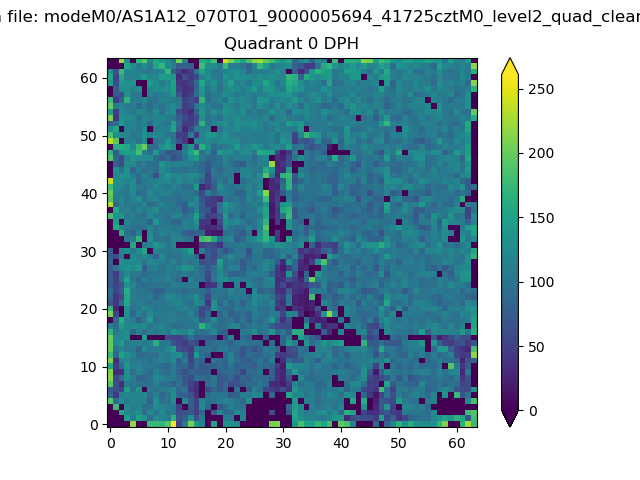 |
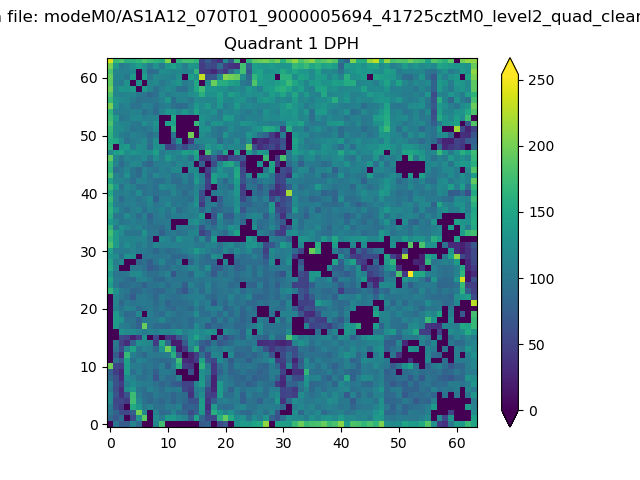 |
Quadrant B |
|---|---|---|---|
| Quadrant D | 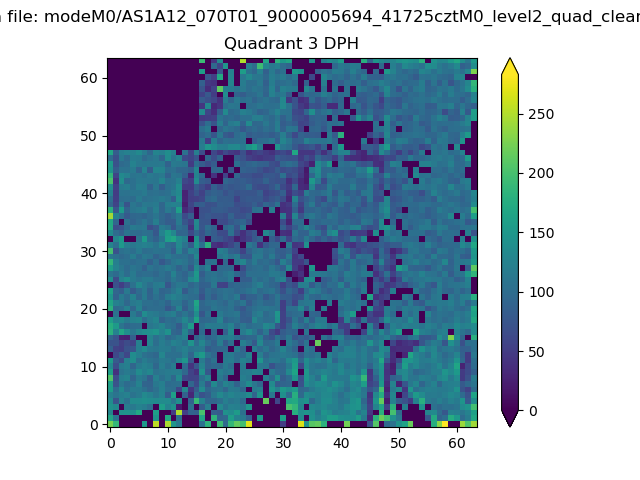 |
 |
Quadrant C |
| Plot type | Count rate plots | Images |
|---|---|---|
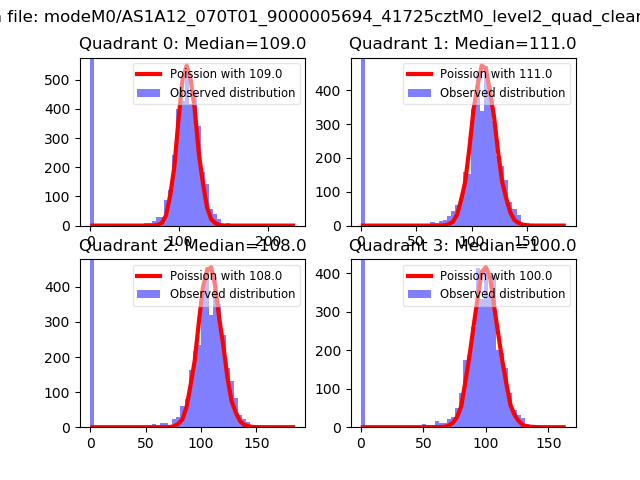
| Comparison with Poisson distribution Blue bars denote a histogram of data divided into 1 sec bins. Red curve is a Poisson curve with rate = median count rate of data. |
 |
 |
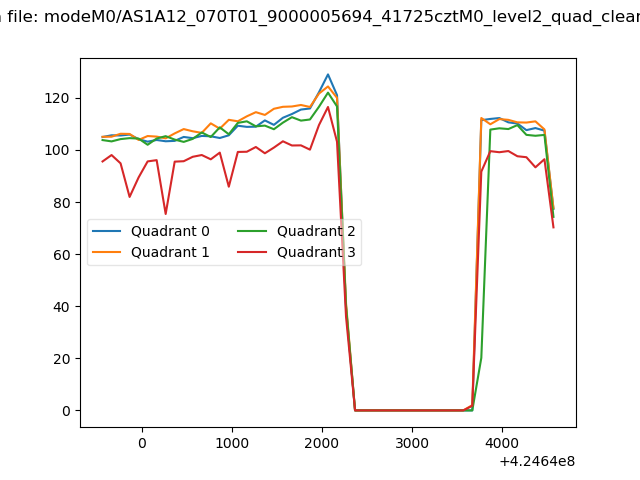
| Quadrant-wise count rates Data is divided into 100 sec bins |
 |
|
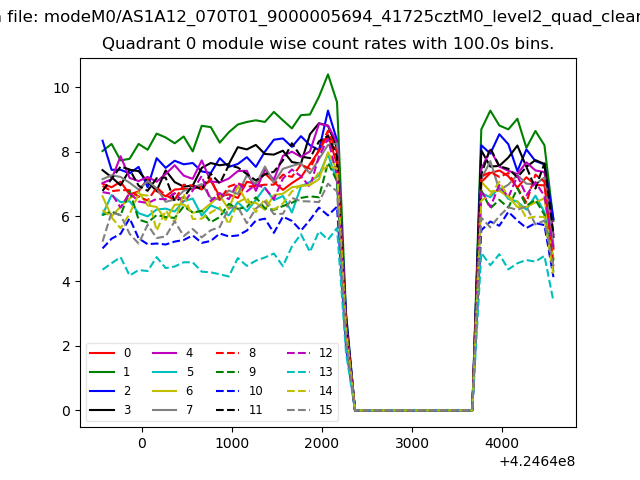
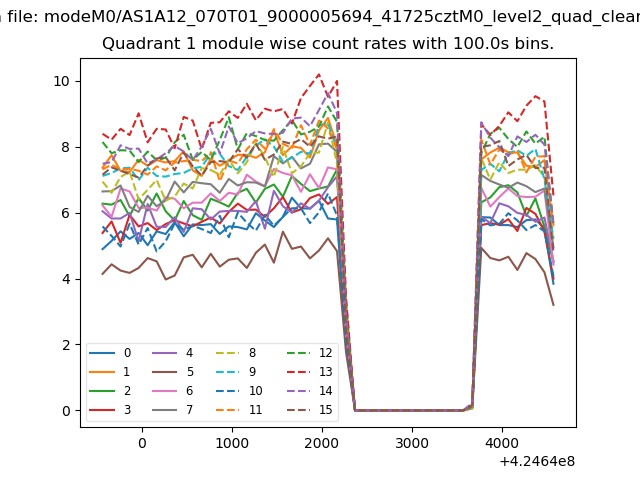
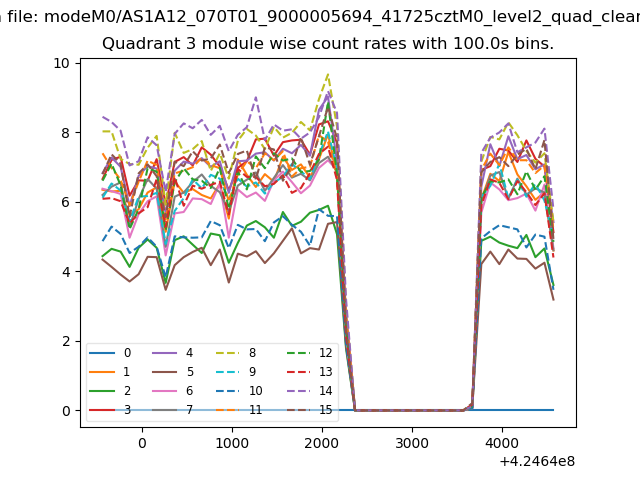
| Module-wise count rates for Quadrant A Data is divided into 100 sec bins |
 |
 |
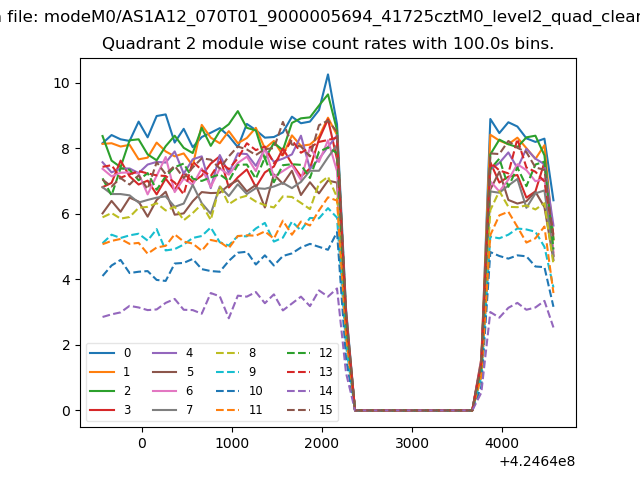
| Module-wise count rates for Quadrant B Data is divided into 100 sec bins |
 |
 |
| Module-wise count rates for Quadrant C Data is divided into 100 sec bins |
 |
 |
| Module-wise count rates for Quadrant D Data is divided into 100 sec bins |
 |
 |
| Parameter | Plot |
|---|---|
| CZT HV Monitor | 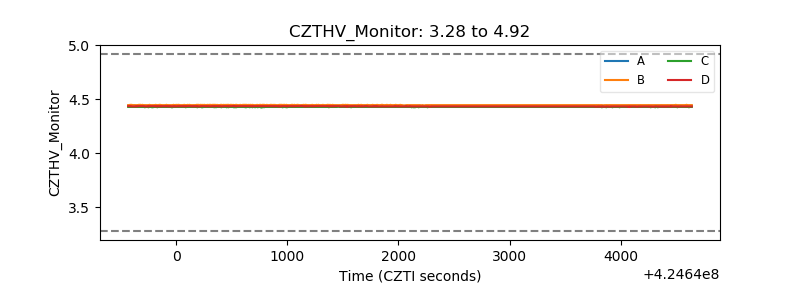 |
| D_VDD | 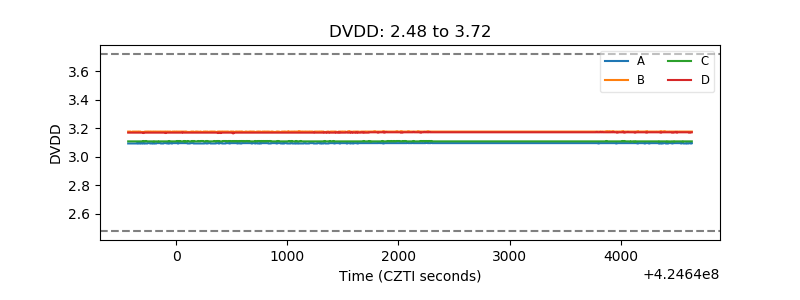 |
| Temperature 1 | 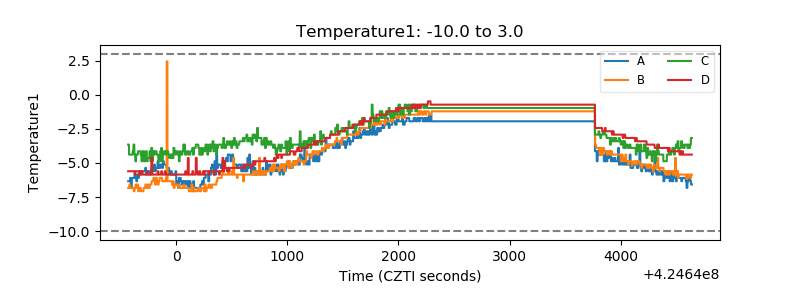 |
| Veto HV Monitor | 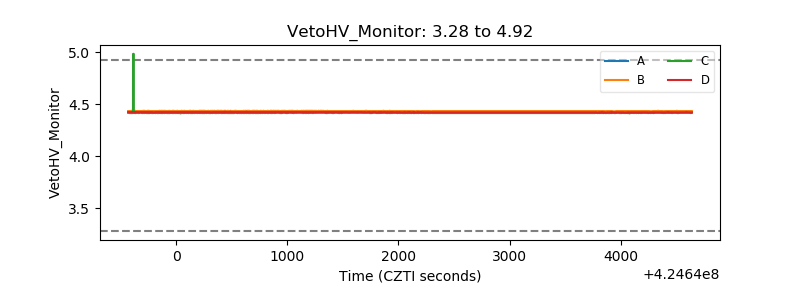 |
| Veto LLD | 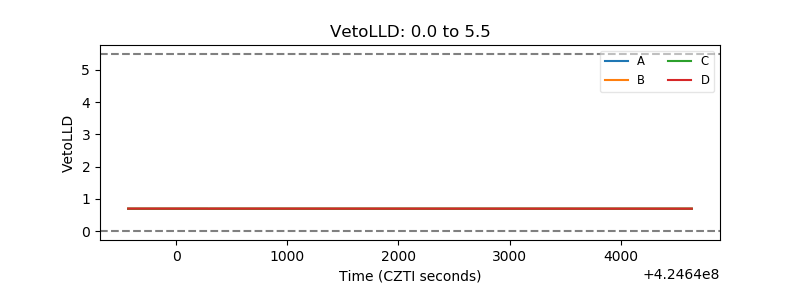 |
| Alpha Counter | 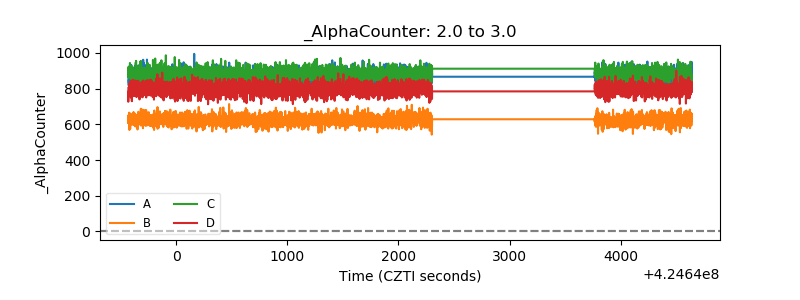 |
| _CPM_Rate | 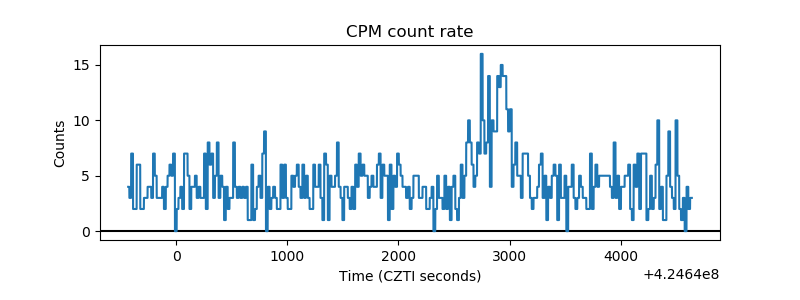 |
| CZT Counter | 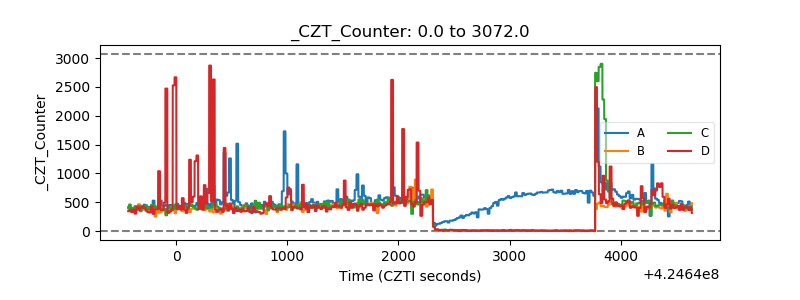 |
| +2.5 Volts monitor |  |
| +5 Volts monitor | 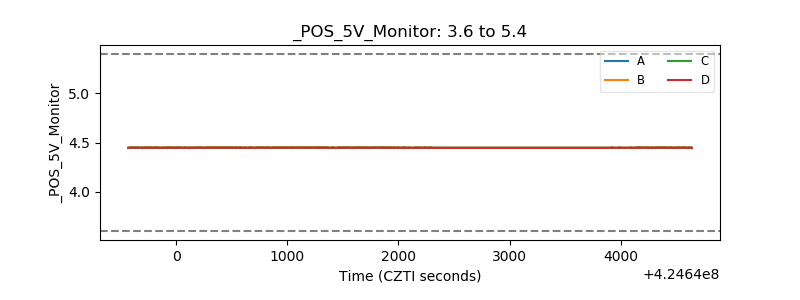 |
| _ROLL_ROT | 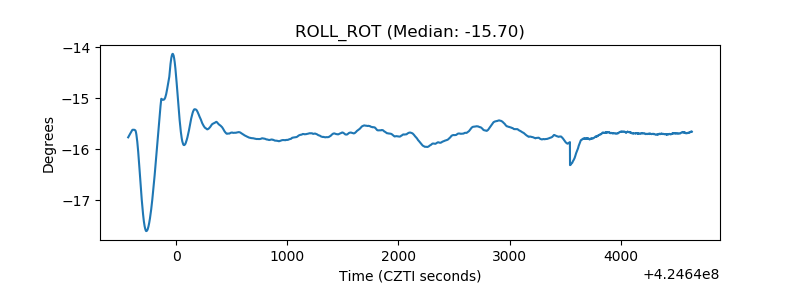 |
| _Roll_DEC | 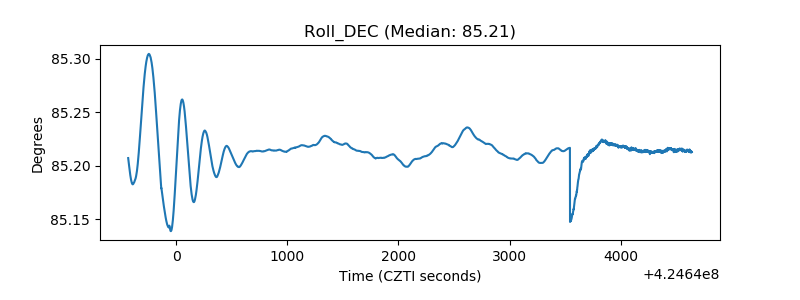 |
| _Roll_RA | 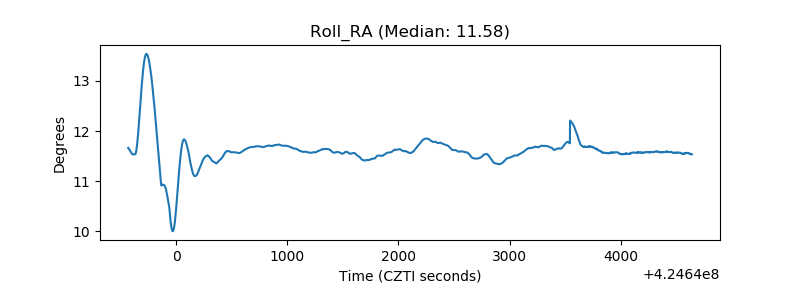 |
| Veto Counter | 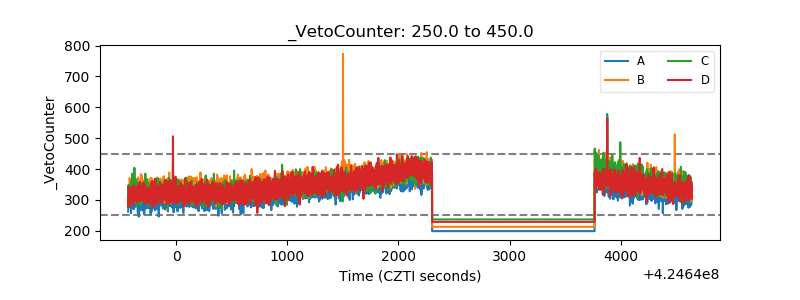 |