| Param | Original file | Final file |
|---|---|---|
| Filename | modeM0/AS1A12_070T01_9000005694_41726cztM0_level2.fits | modeM0/AS1A12_070T01_9000005694_41726cztM0_level2_quad_clean.evt |
| Size (bytes) | 339,517,440 | 94,605,120 |
| Size | 323.8 MB | 90.2 MB |
| Events in quadrant A | 3,127,685 | 634,497 |
| Events in quadrant B | 2,741,948 | 639,288 |
| Events in quadrant C | 3,157,181 | 605,547 |
| Events in quadrant D | 3,079,722 | 571,644 |
| Mode SS | |||
|---|---|---|---|
| Quadrant | BADHDUFLAG | Total packets | Discarded packets |
| A | 0 | 120 | 0 |
| B | 0 | 120 | 0 |
| C | 0 | 120 | 0 |
| D | 0 | 120 | 0 |
| Mode M9 | |||
|---|---|---|---|
| Quadrant | BADHDUFLAG | Total packets | Discarded packets |
| A | 0 | 22 | 0 |
| B | 0 | 23 | 0 |
| C | 0 | 23 | 0 |
| D | 0 | 23 | 0 |
| Mode M0 | |||
|---|---|---|---|
| Quadrant | BADHDUFLAG | Total packets | Discarded packets |
| A | 0 | 13123 | 2 |
| B | 0 | 12680 | 2 |
| C | 0 | 13358 | 2 |
| D | 0 | 13740 | 2 |
| Quadrant | Total seconds | Saturated seconds | Saturation percentage |
|---|---|---|---|
| A | 5918 | 22 | 0.371747% |
| B | 5918 | 56 | 0.946266% |
| C | 5918 | 198 | 3.345725% |
| D | 5918 | 106 | 1.791146% |
Noise dominated data is calculated using 1-second bins in cleaned event files. If a bin has >2000 counts, and if more than 50% of those come from <1% of pixels, then it is considered to be noise-dominated and hence unusable.
| Quadrant | # 1 sec bins | Bins with >0 counts | Bins with >2000 counts | High rate bins dominated by noise | Noise dominated (total time) | Noise dominated (detector-on time) | Marked lightcurve |
|---|---|---|---|---|---|---|---|
| A | 7231 | 5919 | 7 | 7 | 0.10% | 0.12% | 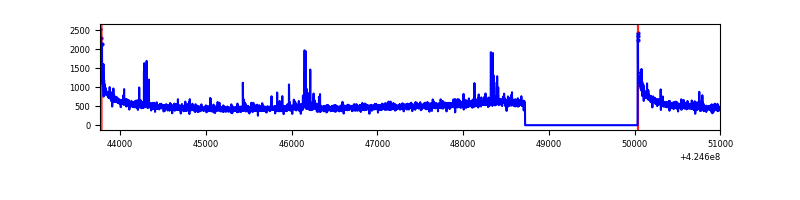 |
| B | 7231 | 5919 | 23 | 23 | 0.32% | 0.39% | 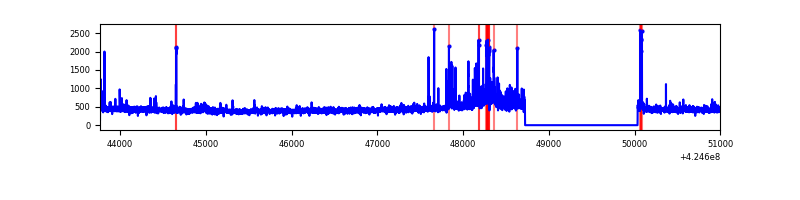 |
| C | 7231 | 5919 | 195 | 195 | 2.70% | 3.29% | 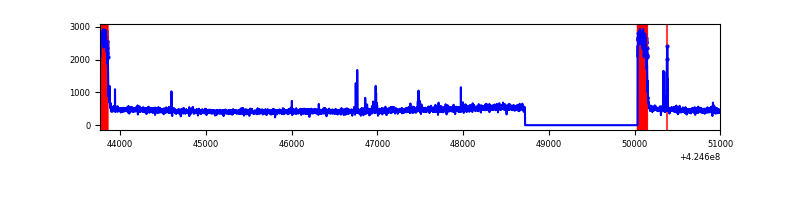 |
| D | 7231 | 5919 | 94 | 94 | 1.30% | 1.59% | 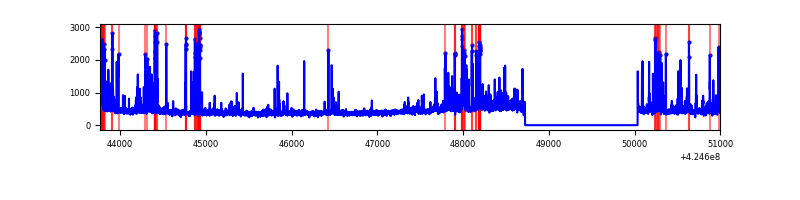 |
Top three noisy pixels from each quadrant. If the there are fewer than three noisy pixels in the level2.evt file, extra rows are filled as -1
| Pixel properties | Quadrant properties | ||||||
|---|---|---|---|---|---|---|---|
| Quadrant | DetID | PixID | Counts | Sigma | Mean | Median | Sigma |
| A | 10 | 83 | 591255 | 4565.25 | 626 | 614 | 129.4 |
| A | 13 | 248 | 54118 | 413.55 | 626 | 614 | 129.4 |
| A | 7 | 3 | 34824 | 264.42 | 626 | 614 | 129.4 |
| B | 0 | 186 | 113050 | 926.52 | 621 | 604 | 121.4 |
| B | 0 | 190 | 76568 | 625.92 | 621 | 604 | 121.4 |
| B | 5 | 255 | 54967 | 447.94 | 621 | 604 | 121.4 |
| C | 0 | 10 | 527706 | 3767.6 | 599 | 602 | 139.9 |
| C | 15 | 214 | 236057 | 1682.97 | 599 | 602 | 139.9 |
| C | 15 | 159 | 27196 | 190.09 | 599 | 602 | 139.9 |
| D | 13 | 249 | 234872 | 1565.02 | 608 | 592 | 149.7 |
| D | 2 | 249 | 195532 | 1302.23 | 608 | 592 | 149.7 |
| D | 10 | 199 | 109591 | 728.13 | 608 | 592 | 149.7 |
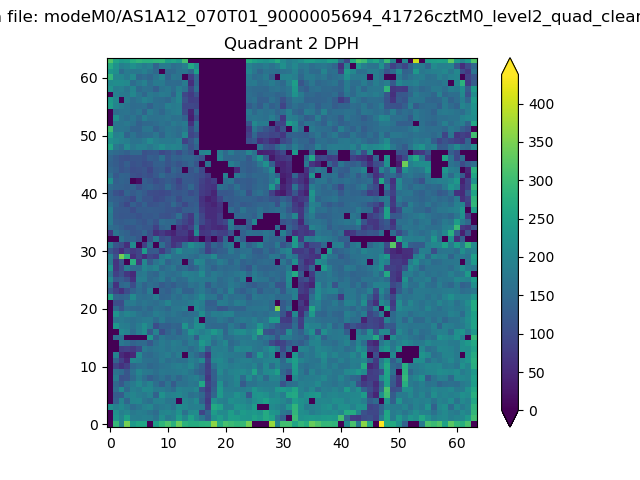
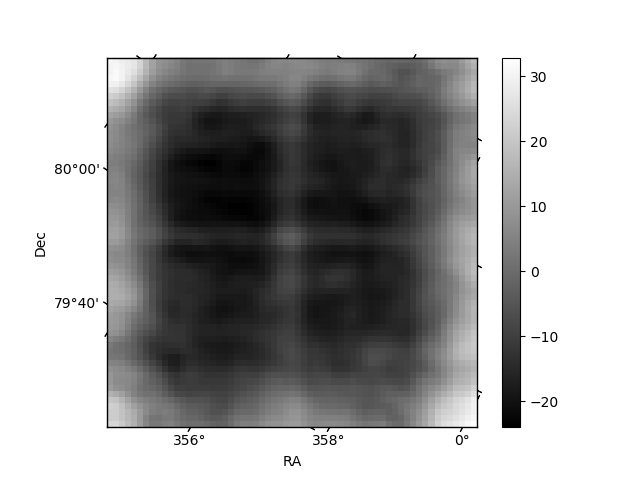
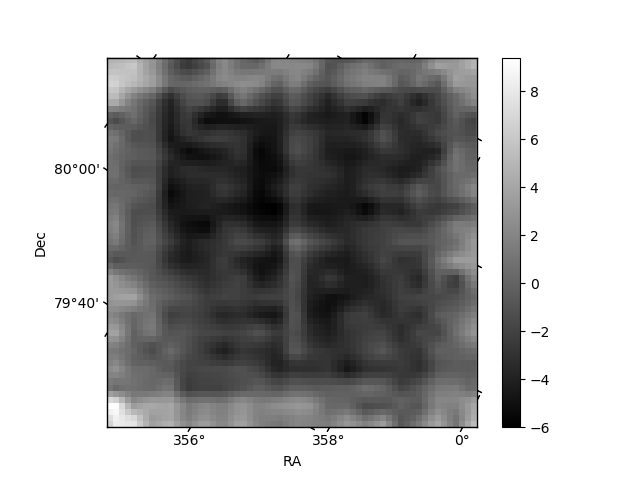
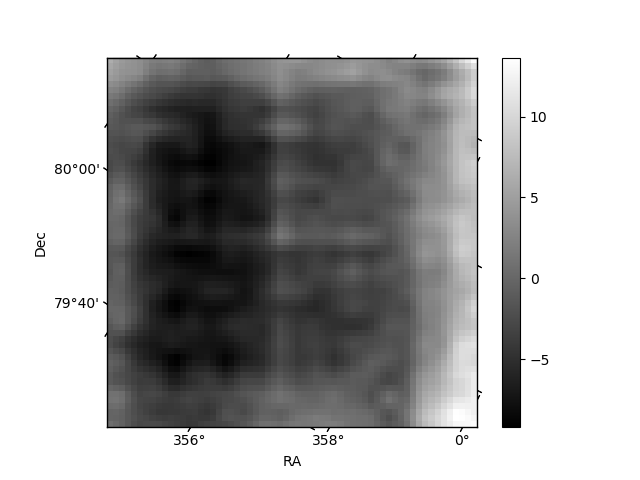
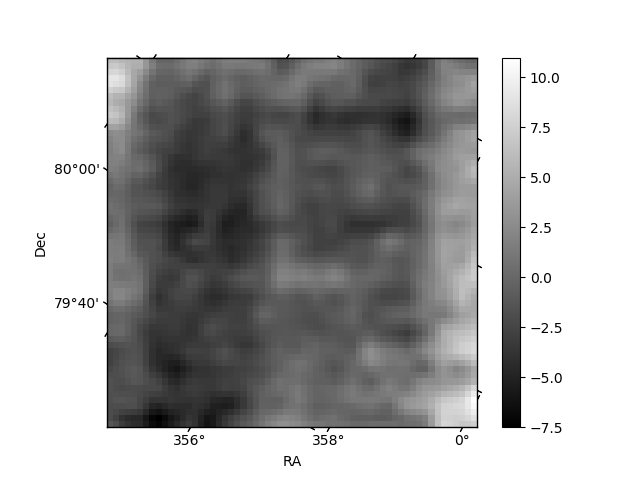
Histogram calculated using DETX and DETY for each event in the final _common_clean file
| Quadrant A | 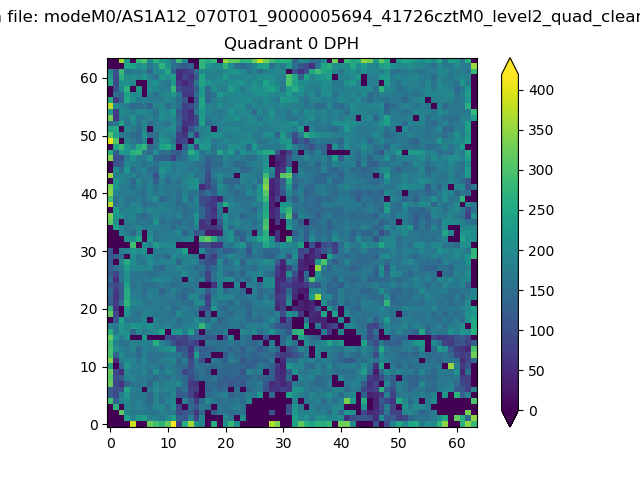 |
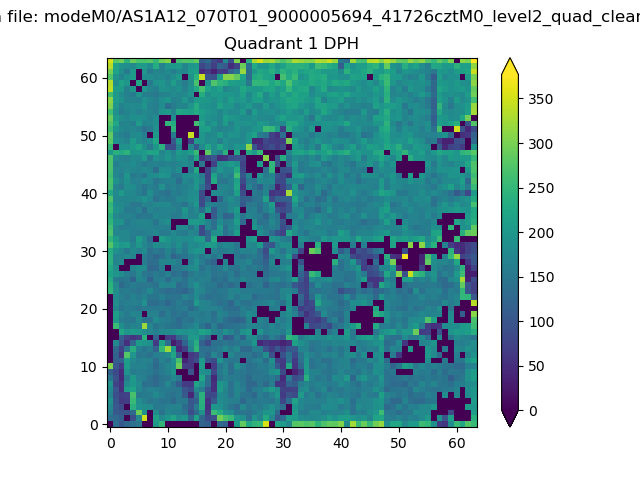 |
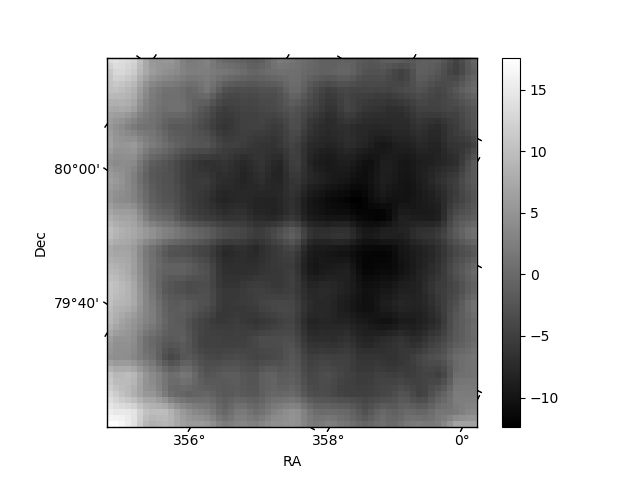
Quadrant B |
|---|---|---|---|
| Quadrant D | 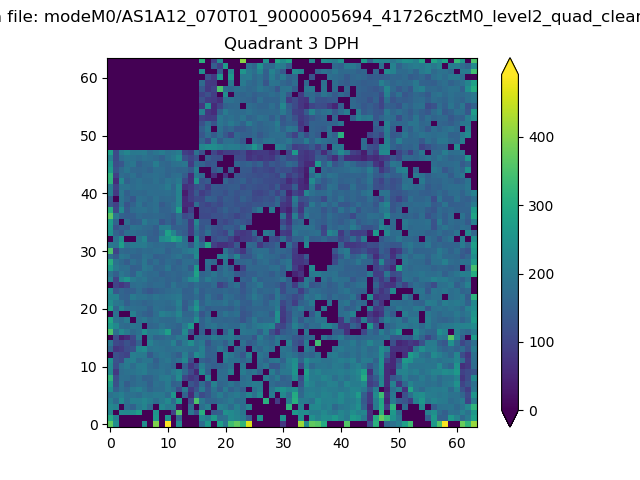 |
 |
Quadrant C |
| Plot type | Count rate plots | Images |
|---|---|---|
| Comparison with Poisson distribution Blue bars denote a histogram of data divided into 1 sec bins. Red curve is a Poisson curve with rate = median count rate of data. |
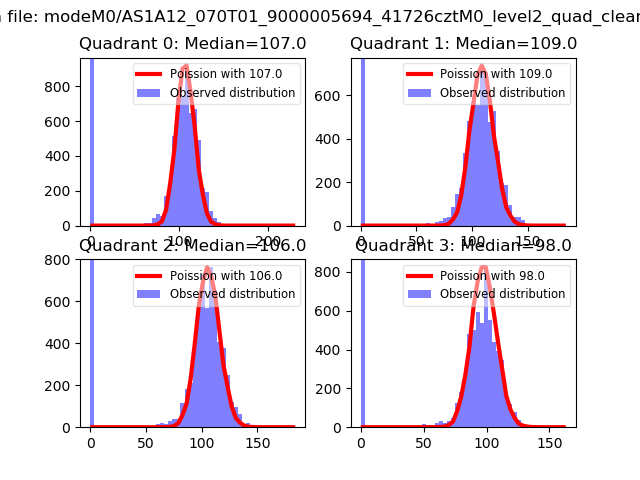 |
 |
| Quadrant-wise count rates Data is divided into 100 sec bins |
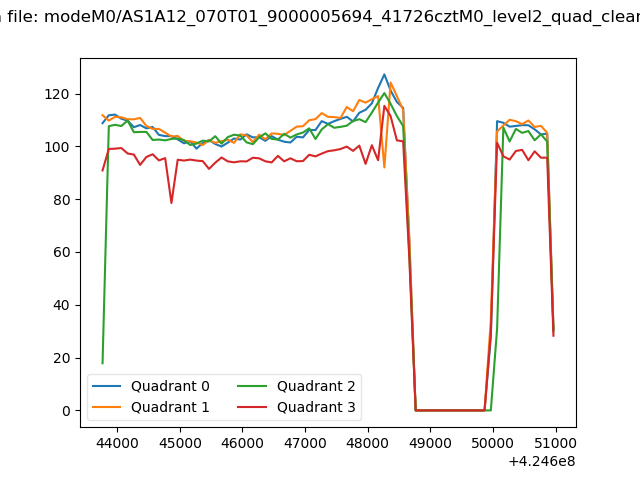 |
|
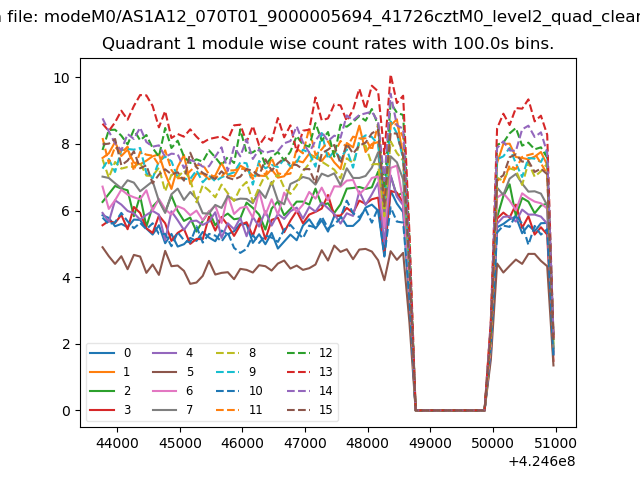
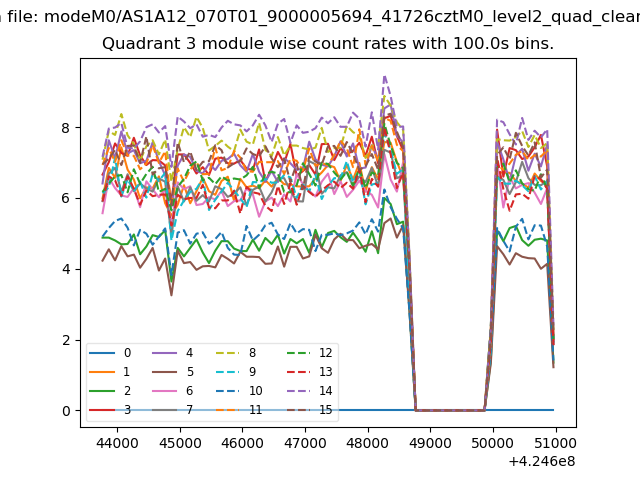
| Module-wise count rates for Quadrant A Data is divided into 100 sec bins |
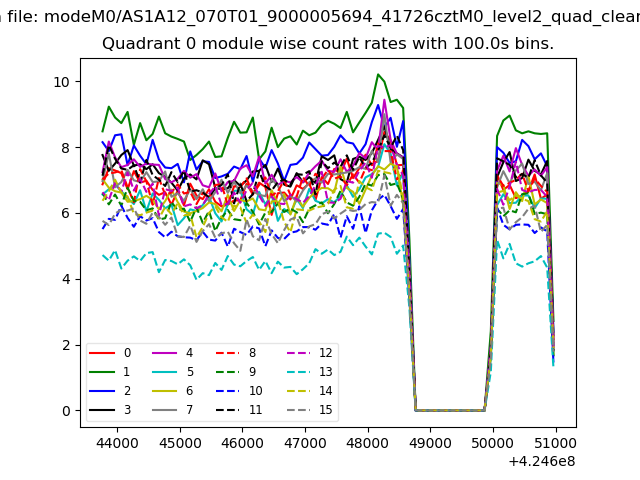 |
 |
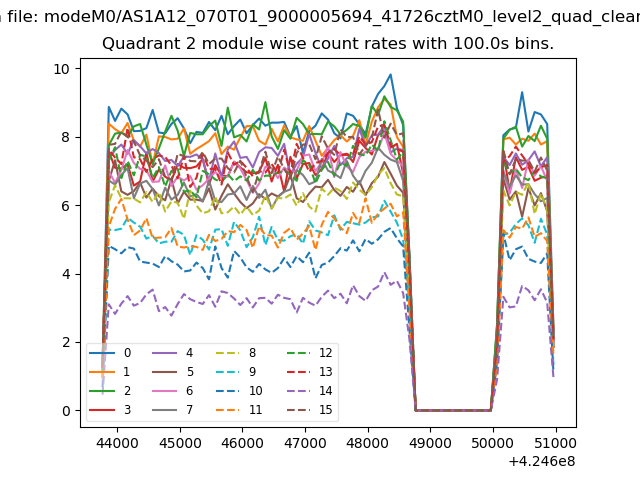
| Module-wise count rates for Quadrant B Data is divided into 100 sec bins |
 |
 |
| Module-wise count rates for Quadrant C Data is divided into 100 sec bins |
 |
 |
| Module-wise count rates for Quadrant D Data is divided into 100 sec bins |
 |
 |
| Parameter | Plot |
|---|---|
| CZT HV Monitor | 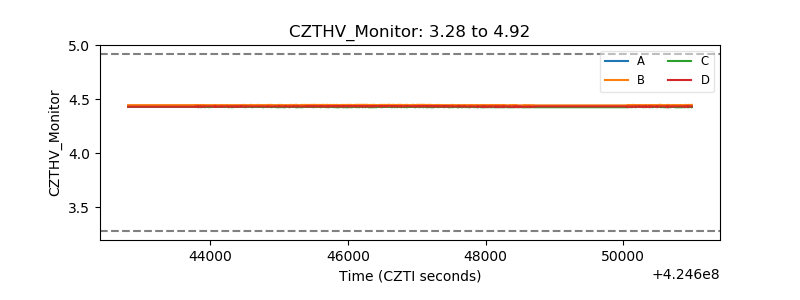 |
| D_VDD | 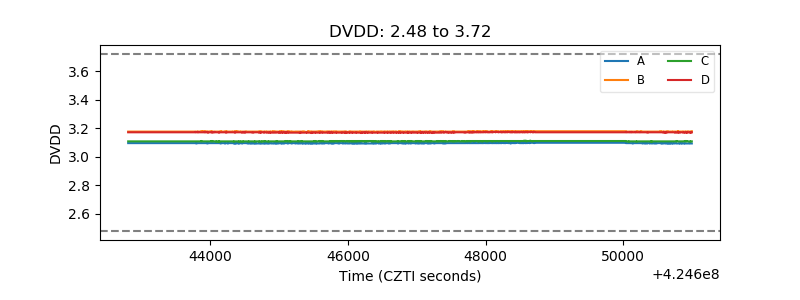 |
| Temperature 1 | 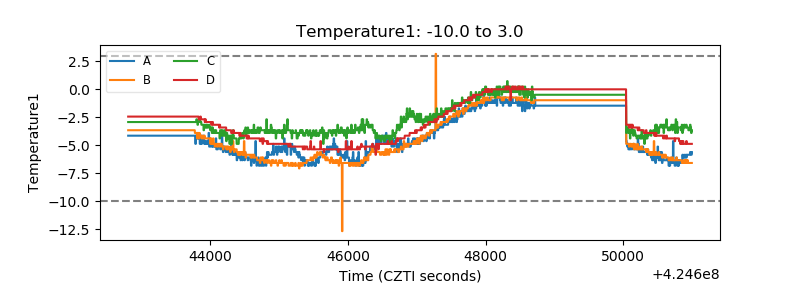 |
| Veto HV Monitor | 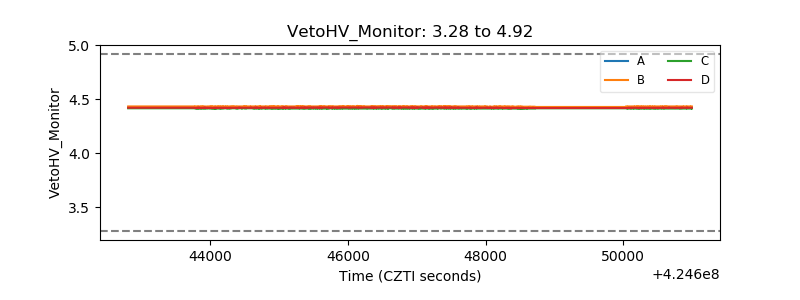 |
| Veto LLD | 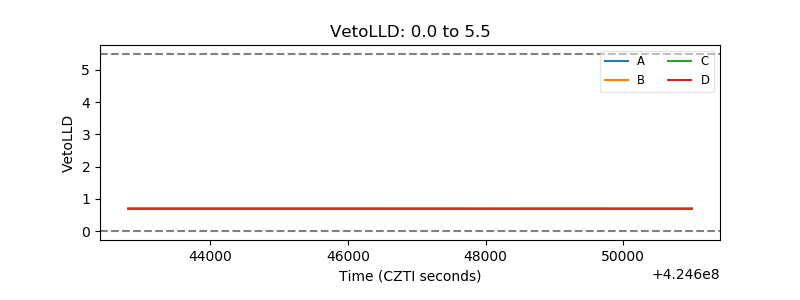 |
| Alpha Counter | 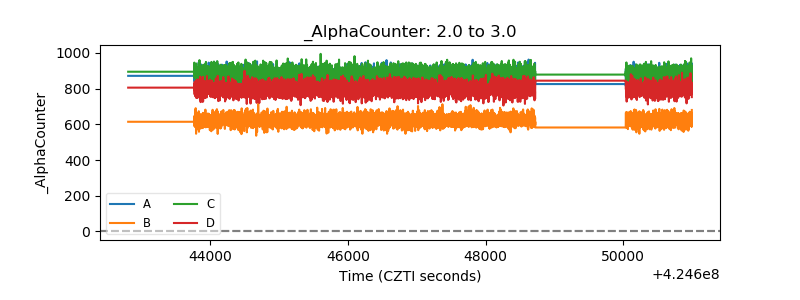 |
| _CPM_Rate | 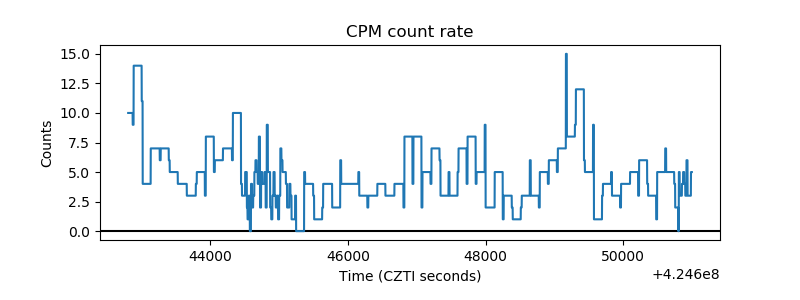 |
| CZT Counter | 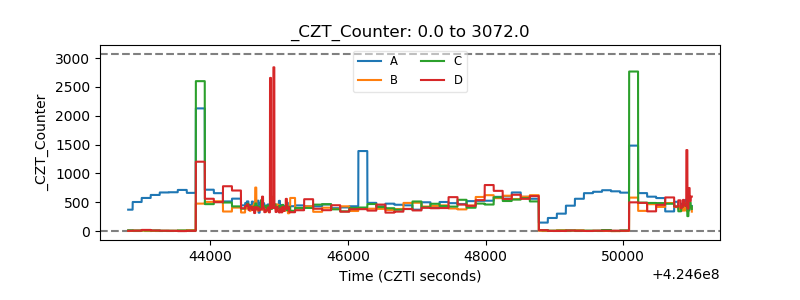 |
| +2.5 Volts monitor | 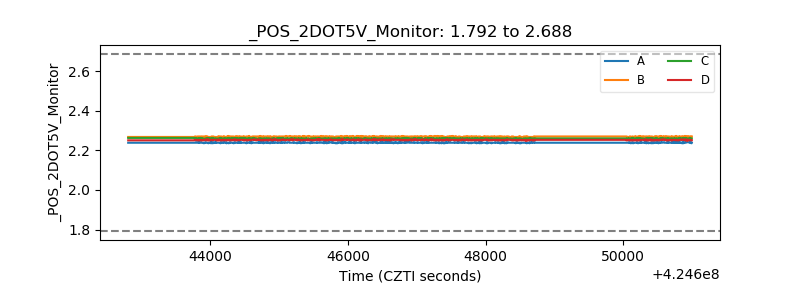 |
| +5 Volts monitor | 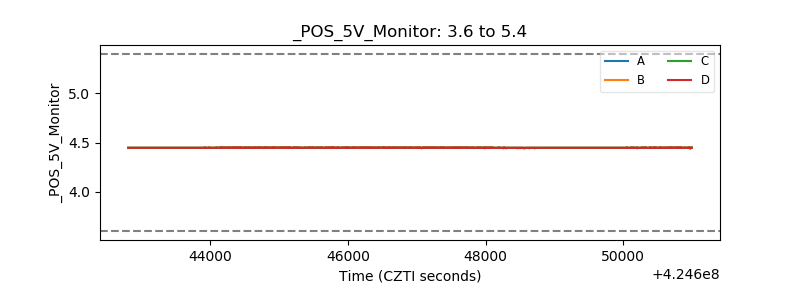 |
| _ROLL_ROT | 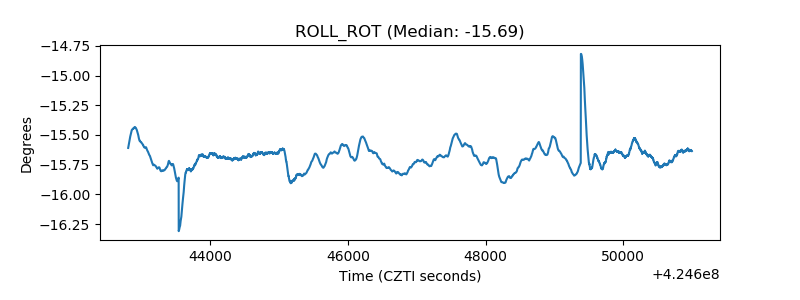 |
| _Roll_DEC | 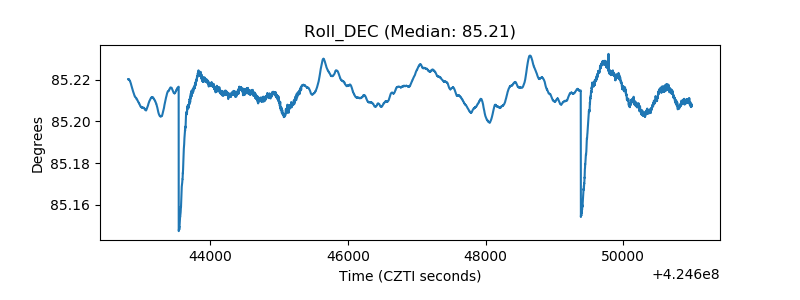 |
| _Roll_RA | 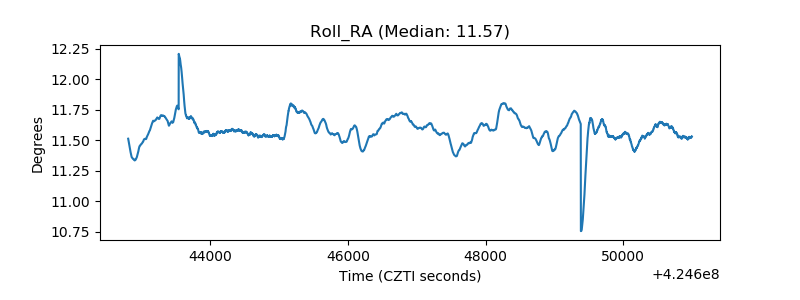 |
| Veto Counter | 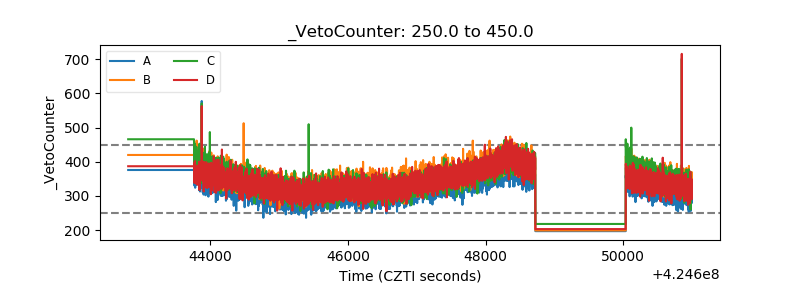 |