| Param | Original file | Final file |
|---|---|---|
| Filename | modeM0/AS1A12_070T01_9000005694_41729cztM0_level2.fits | modeM0/AS1A12_070T01_9000005694_41729cztM0_level2_quad_clean.evt |
| Size (bytes) | 976,135,680 | 244,042,560 |
| Size | 930.9 MB | 232.7 MB |
| Events in quadrant A | 8,103,374 | 1,643,020 |
| Events in quadrant B | 7,395,505 | 1,648,473 |
| Events in quadrant C | 8,515,372 | 1,589,038 |
| Events in quadrant D | 10,897,052 | 1,420,189 |
| Mode SS | |||
|---|---|---|---|
| Quadrant | BADHDUFLAG | Total packets | Discarded packets |
| A | 0 | 324 | 0 |
| B | 0 | 324 | 0 |
| C | 0 | 324 | 0 |
| D | 0 | 324 | 0 |
| Mode M9 | |||
|---|---|---|---|
| Quadrant | BADHDUFLAG | Total packets | Discarded packets |
| A | 0 | 55 | 0 |
| B | 0 | 55 | 0 |
| C | 0 | 55 | 0 |
| D | 0 | 55 | 0 |
| Mode M0 | |||
|---|---|---|---|
| Quadrant | BADHDUFLAG | Total packets | Discarded packets |
| A | 0 | 34205 | 4 |
| B | 0 | 33825 | 4 |
| C | 0 | 36012 | 4 |
| D | 0 | 43879 | 4 |
| Quadrant | Total seconds | Saturated seconds | Saturation percentage |
|---|---|---|---|
| A | 15766 | 33 | 0.209311% |
| B | 15767 | 207 | 1.312869% |
| C | 15767 | 454 | 2.879432% |
| D | 15767 | 1030 | 6.532631% |
Noise dominated data is calculated using 1-second bins in cleaned event files. If a bin has >2000 counts, and if more than 50% of those come from <1% of pixels, then it is considered to be noise-dominated and hence unusable.
| Quadrant | # 1 sec bins | Bins with >0 counts | Bins with >2000 counts | High rate bins dominated by noise | Noise dominated (total time) | Noise dominated (detector-on time) | Marked lightcurve |
|---|---|---|---|---|---|---|---|
| A | 21226 | 15770 | 8 | 8 | 0.04% | 0.05% | 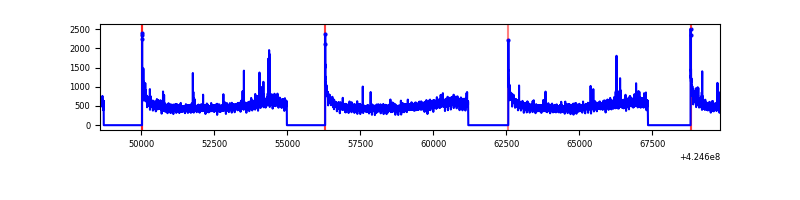 |
| B | 21227 | 15771 | 143 | 143 | 0.67% | 0.91% | 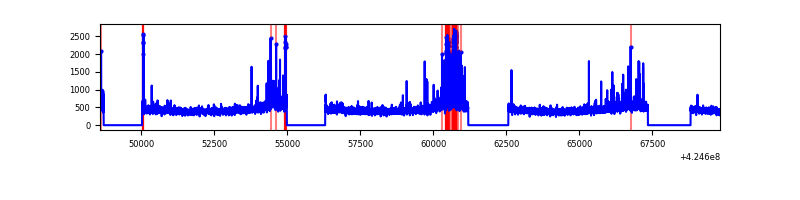 |
| C | 21227 | 15771 | 443 | 443 | 2.09% | 2.81% | 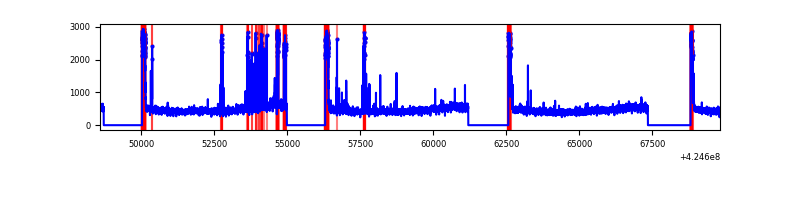 |
| D | 21227 | 15771 | 977 | 977 | 4.60% | 6.19% | 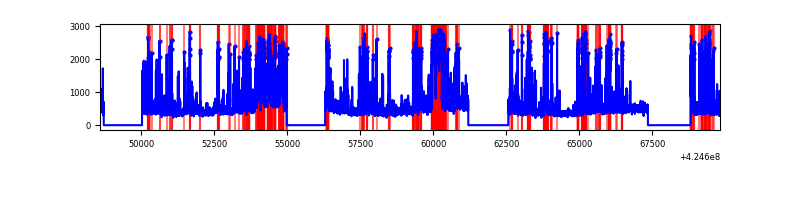 |
Top three noisy pixels from each quadrant. If the there are fewer than three noisy pixels in the level2.evt file, extra rows are filled as -1
| Pixel properties | Quadrant properties | ||||||
|---|---|---|---|---|---|---|---|
| Quadrant | DetID | PixID | Counts | Sigma | Mean | Median | Sigma |
| A | 10 | 83 | 1455635 | 4212.21 | 1688 | 1650 | 345.2 |
| A | 13 | 248 | 54081 | 151.89 | 1688 | 1650 | 345.2 |
| A | 2 | 79 | 35667 | 98.55 | 1688 | 1650 | 345.2 |
| B | 0 | 186 | 501257 | 1567.83 | 1665 | 1621 | 318.7 |
| B | 5 | 32 | 82339 | 253.29 | 1665 | 1621 | 318.7 |
| B | 0 | 190 | 69855 | 214.11 | 1665 | 1621 | 318.7 |
| C | 0 | 10 | 1040565 | 2793.8 | 1611 | 1616 | 371.9 |
| C | 15 | 214 | 627601 | 1683.32 | 1611 | 1616 | 371.9 |
| C | 14 | 254 | 489508 | 1311.97 | 1611 | 1616 | 371.9 |
| D | 13 | 249 | 1149072 | 2924.17 | 1606 | 1558 | 392.4 |
| D | 12 | 79 | 1054129 | 2682.23 | 1606 | 1558 | 392.4 |
| D | 2 | 120 | 882711 | 2245.41 | 1606 | 1558 | 392.4 |
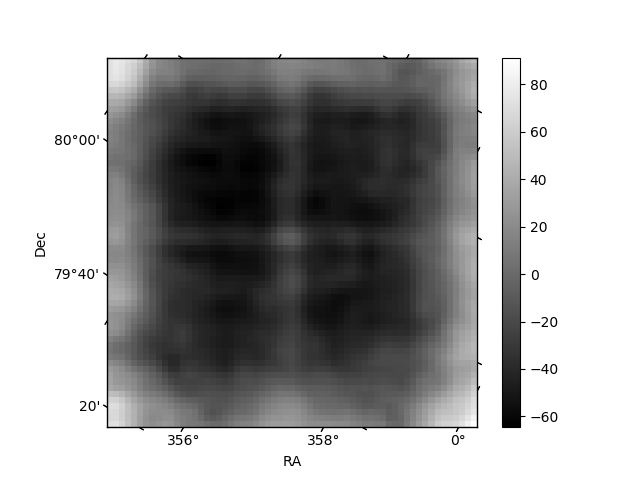
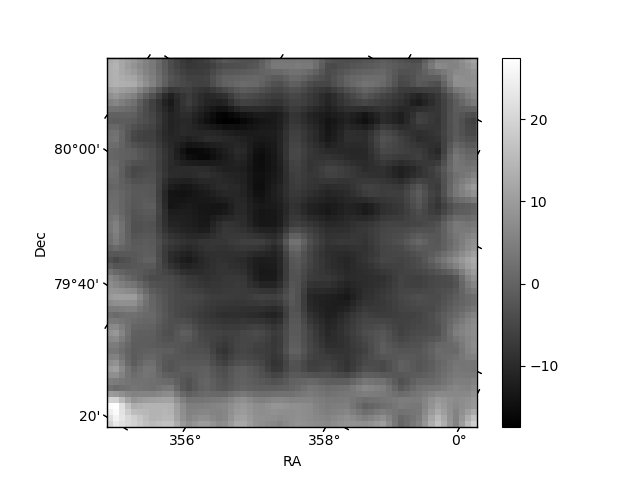
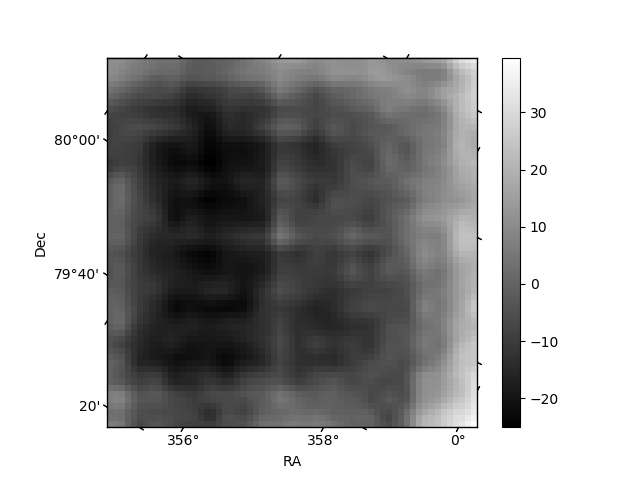
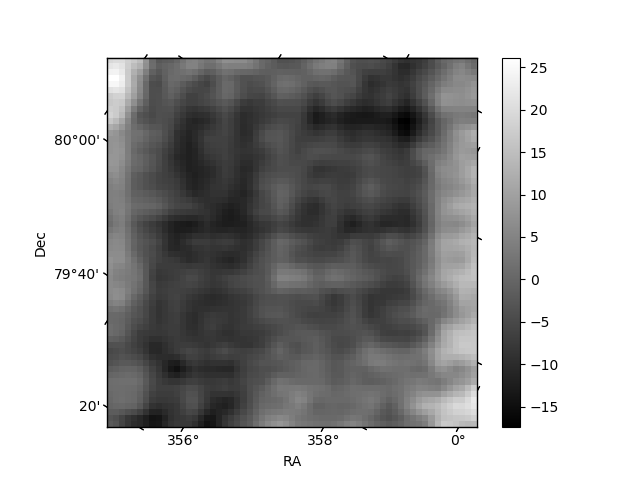
Histogram calculated using DETX and DETY for each event in the final _common_clean file
| Quadrant A | 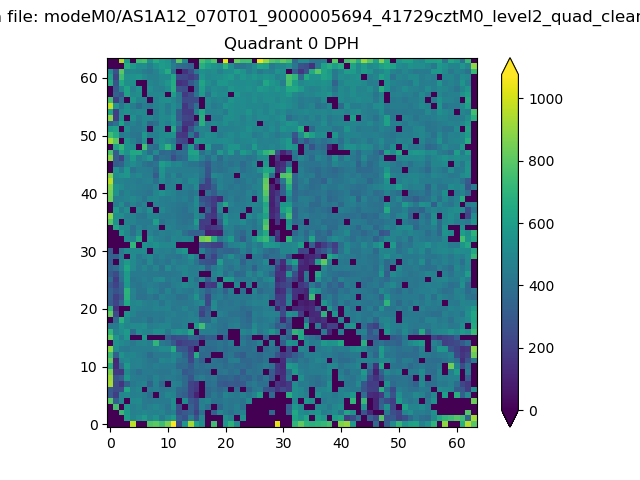 |
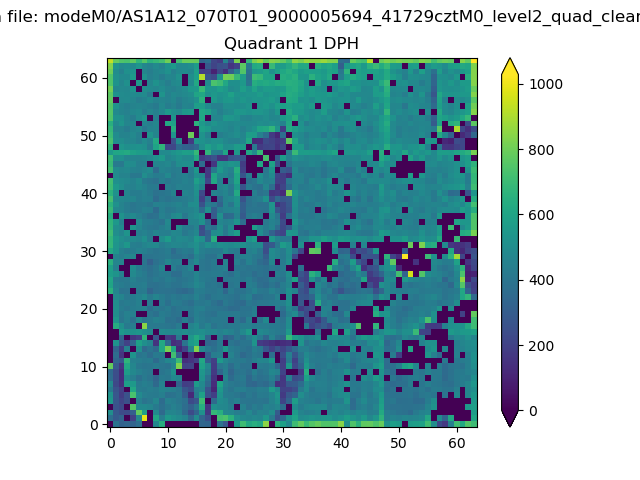 |
Quadrant B |
|---|---|---|---|
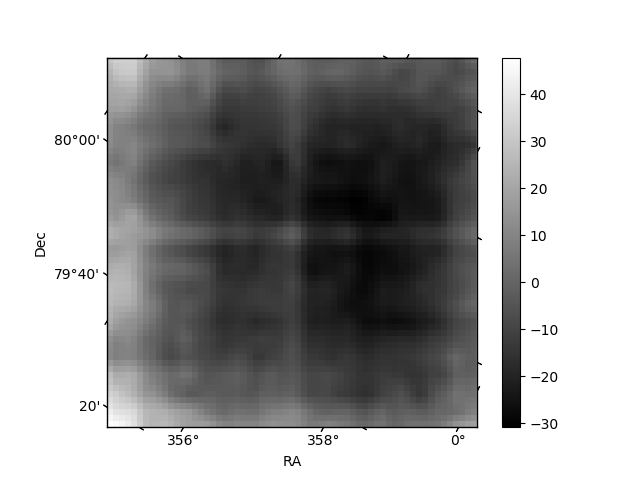
| Quadrant D | 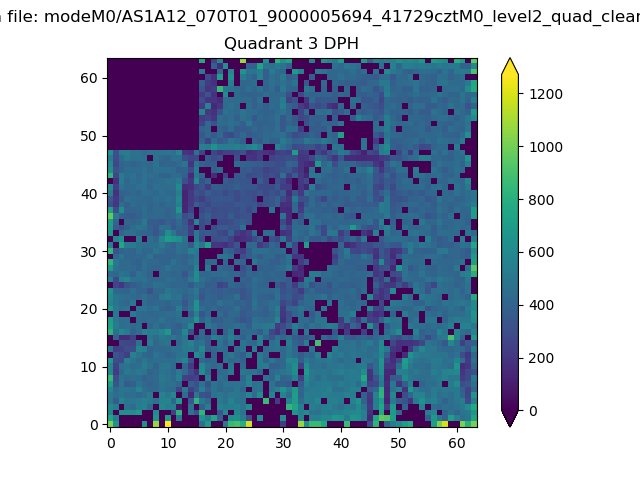 |
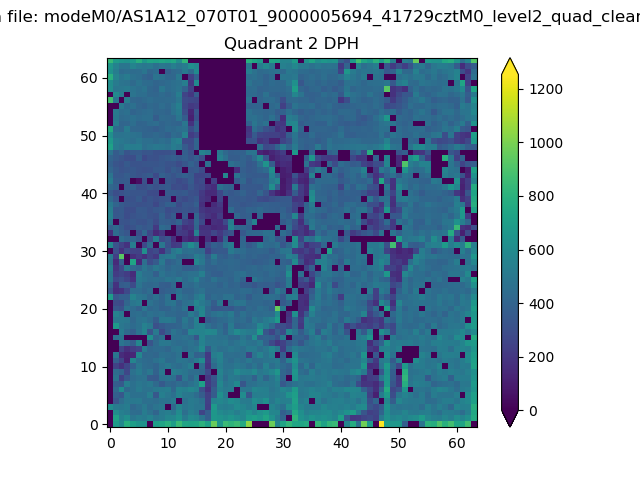 |
Quadrant C |
| Plot type | Count rate plots | Images |
|---|---|---|
| Comparison with Poisson distribution Blue bars denote a histogram of data divided into 1 sec bins. Red curve is a Poisson curve with rate = median count rate of data. |
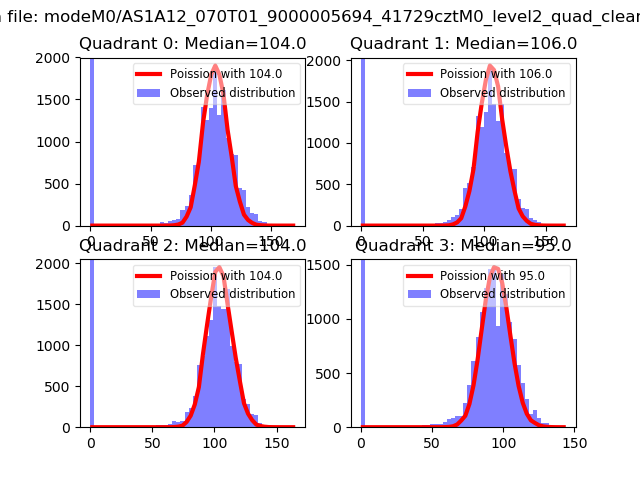 |
 |
| Quadrant-wise count rates Data is divided into 100 sec bins |
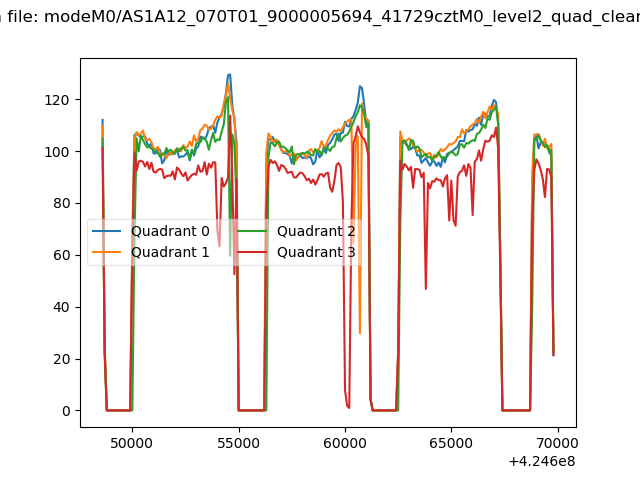 |
|
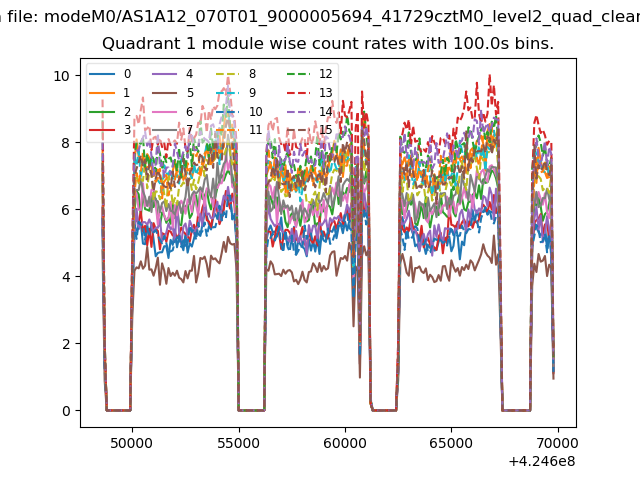
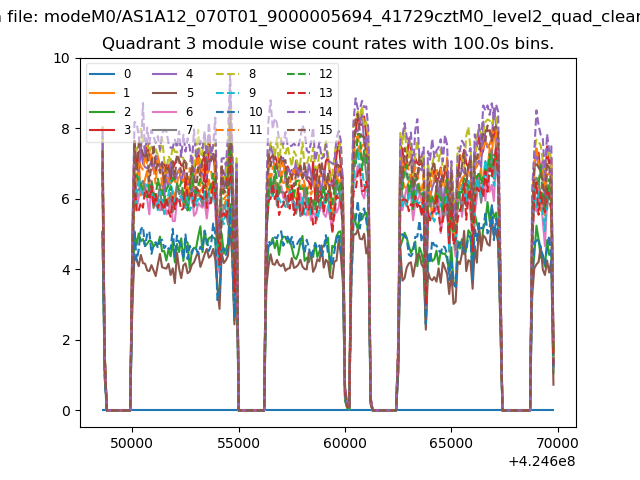
| Module-wise count rates for Quadrant A Data is divided into 100 sec bins |
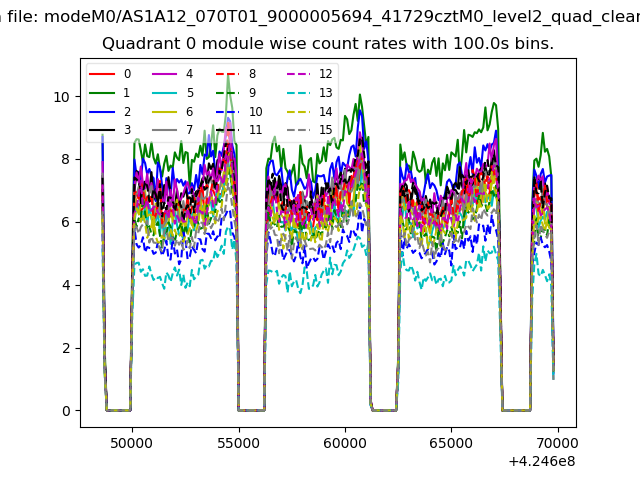 |
 |
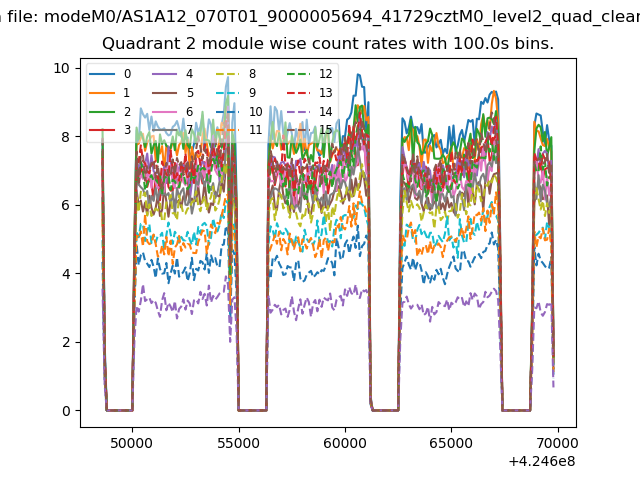
| Module-wise count rates for Quadrant B Data is divided into 100 sec bins |
 |
 |
| Module-wise count rates for Quadrant C Data is divided into 100 sec bins |
 |
 |
| Module-wise count rates for Quadrant D Data is divided into 100 sec bins |
 |
 |
| Parameter | Plot |
|---|---|
| CZT HV Monitor | 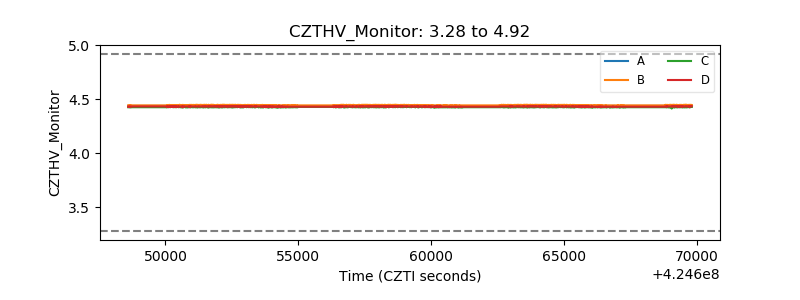 |
| D_VDD | 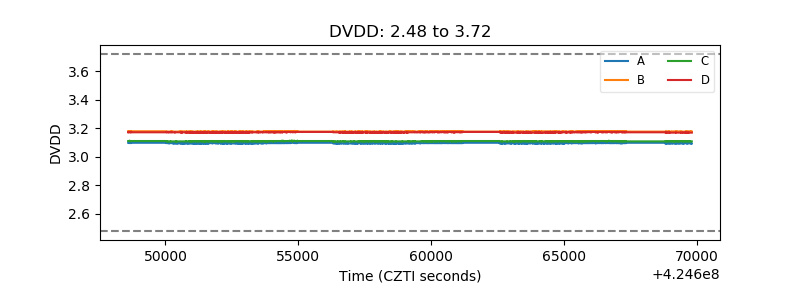 |
| Temperature 1 | 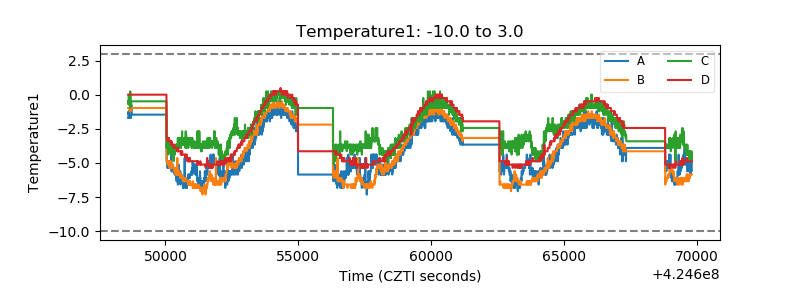 |
| Veto HV Monitor | 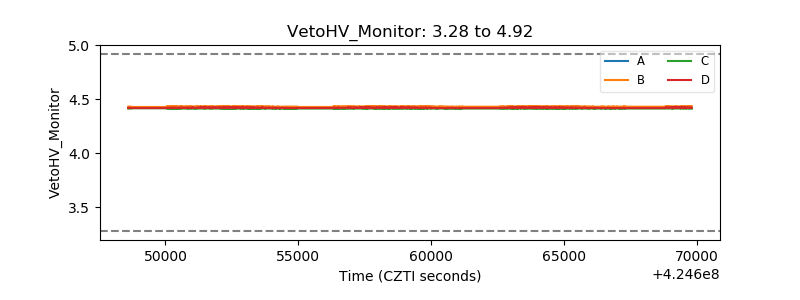 |
| Veto LLD | 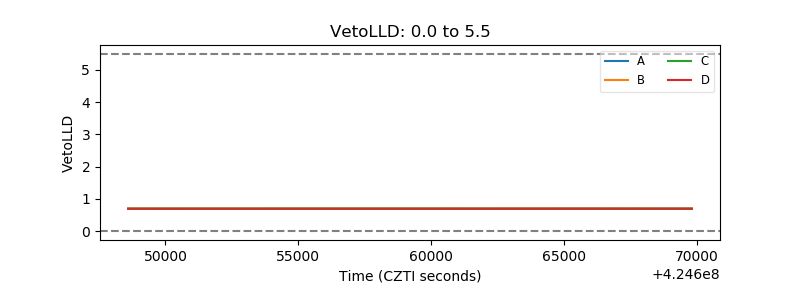 |
| Alpha Counter | 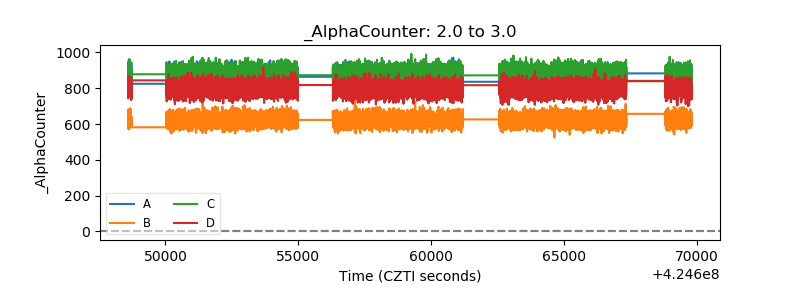 |
| _CPM_Rate | 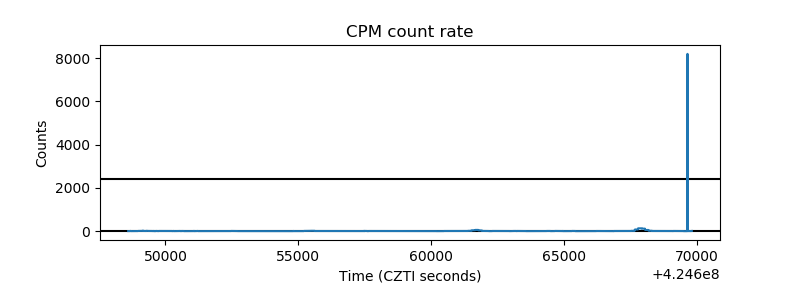 |
| CZT Counter | 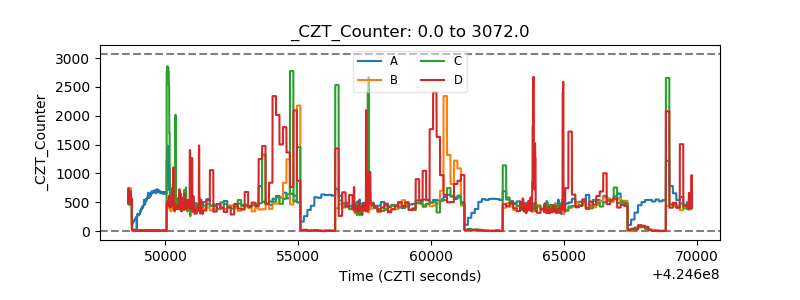 |
| +2.5 Volts monitor | 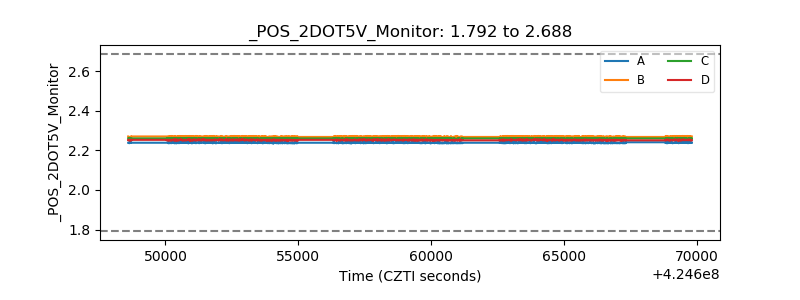 |
| +5 Volts monitor | 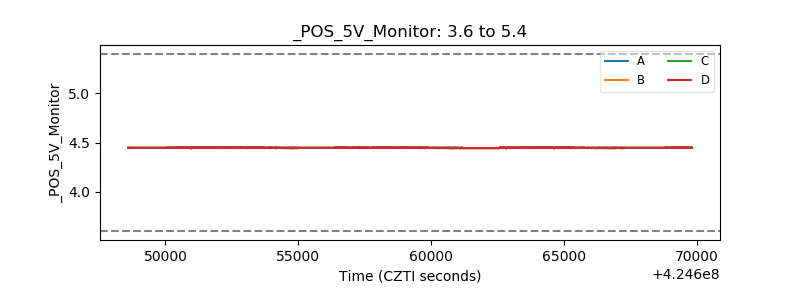 |
| _ROLL_ROT | 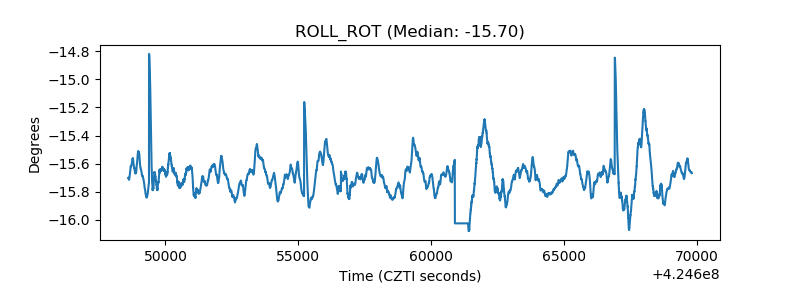 |
| _Roll_DEC | 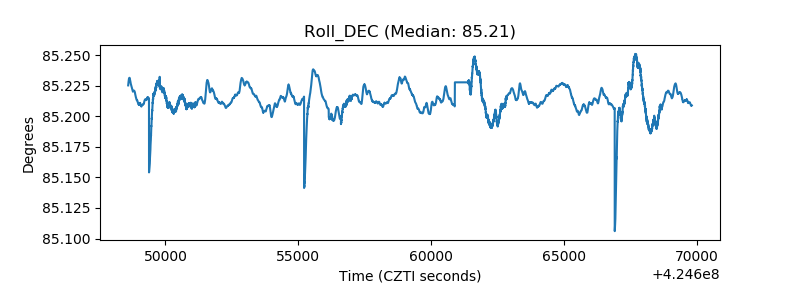 |
| _Roll_RA | 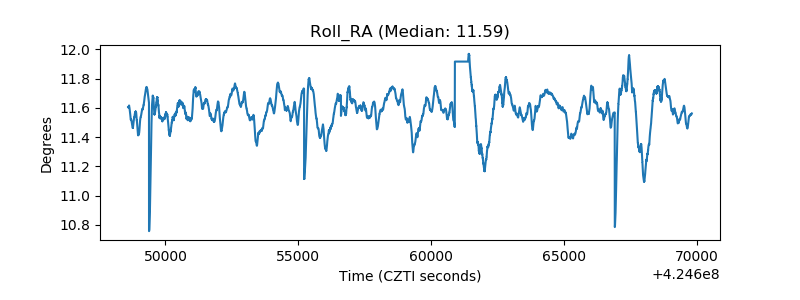 |
| Veto Counter | 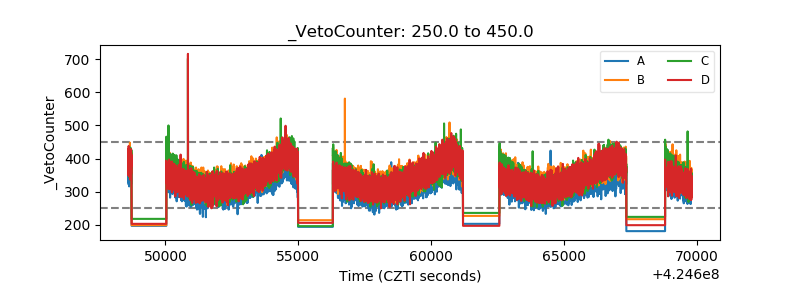 |