| Param | Original file | Final file |
|---|---|---|
| Filename | modeM0/AS1A12_070T01_9000005694_41730cztM0_level2.fits | modeM0/AS1A12_070T01_9000005694_41730cztM0_level2_quad_clean.evt |
| Size (bytes) | 357,546,240 | 84,504,960 |
| Size | 341.0 MB | 80.6 MB |
| Events in quadrant A | 2,967,727 | 588,256 |
| Events in quadrant B | 3,621,985 | 512,724 |
| Events in quadrant C | 2,788,420 | 565,286 |
| Events in quadrant D | 3,426,518 | 506,269 |
| Mode SS | |||
|---|---|---|---|
| Quadrant | BADHDUFLAG | Total packets | Discarded packets |
| A | 0 | 112 | 0 |
| B | 0 | 112 | 0 |
| C | 0 | 112 | 0 |
| D | 0 | 112 | 0 |
| Mode M9 | |||
|---|---|---|---|
| Quadrant | BADHDUFLAG | Total packets | Discarded packets |
| A | 0 | 16 | 0 |
| B | 0 | 16 | 0 |
| C | 0 | 16 | 0 |
| D | 0 | 16 | 0 |
| Mode M0 | |||
|---|---|---|---|
| Quadrant | BADHDUFLAG | Total packets | Discarded packets |
| A | 0 | 12134 | 1 |
| B | 0 | 14895 | 1 |
| C | 0 | 12015 | 1 |
| D | 0 | 14385 | 1 |
| Quadrant | Total seconds | Saturated seconds | Saturation percentage |
|---|---|---|---|
| A | 5517 | 18 | 0.326264% |
| B | 5518 | 836 | 15.150417% |
| C | 5518 | 112 | 2.029721% |
| D | 5518 | 319 | 5.781080% |
Noise dominated data is calculated using 1-second bins in cleaned event files. If a bin has >2000 counts, and if more than 50% of those come from <1% of pixels, then it is considered to be noise-dominated and hence unusable.
| Quadrant | # 1 sec bins | Bins with >0 counts | Bins with >2000 counts | High rate bins dominated by noise | Noise dominated (total time) | Noise dominated (detector-on time) | Marked lightcurve |
|---|---|---|---|---|---|---|---|
| A | 7100 | 5517 | 13 | 13 | 0.18% | 0.24% | 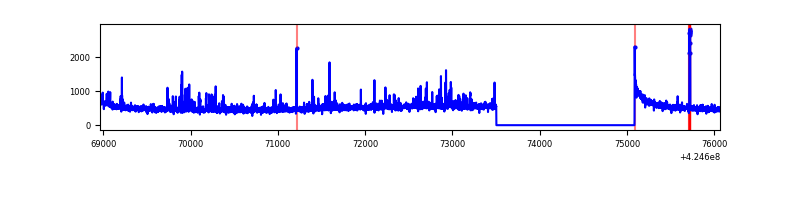 |
| B | 7101 | 5519 | 318 | 318 | 4.48% | 5.76% | 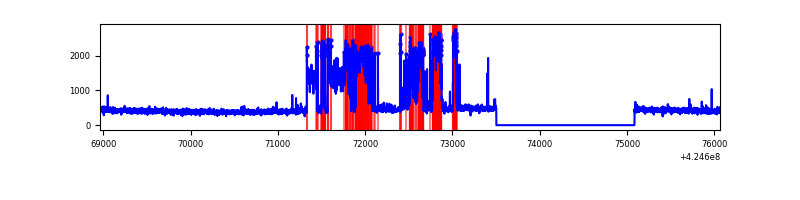 |
| C | 7101 | 5518 | 109 | 109 | 1.53% | 1.98% | 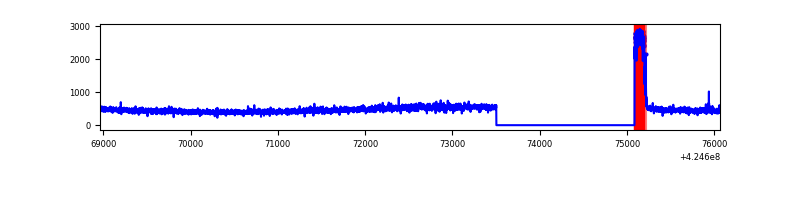 |
| D | 7100 | 5518 | 285 | 285 | 4.01% | 5.16% | 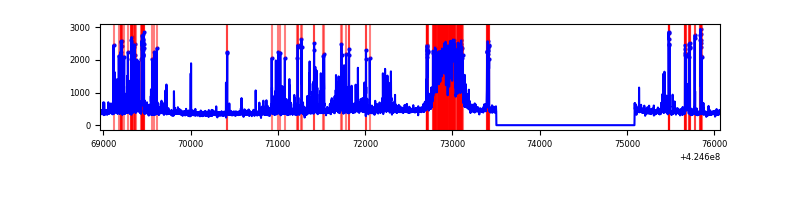 |
Top three noisy pixels from each quadrant. If the there are fewer than three noisy pixels in the level2.evt file, extra rows are filled as -1
| Pixel properties | Quadrant properties | ||||||
|---|---|---|---|---|---|---|---|
| Quadrant | DetID | PixID | Counts | Sigma | Mean | Median | Sigma |
| A | 10 | 83 | 520510 | 4288.43 | 587 | 575 | 121.2 |
| A | 2 | 79 | 124656 | 1023.42 | 587 | 575 | 121.2 |
| A | 6 | 10 | 28301 | 228.68 | 587 | 575 | 121.2 |
| B | 0 | 186 | 1548741 | 15530.65 | 517 | 503 | 99.7 |
| B | 15 | 85 | 18107 | 176.59 | 517 | 503 | 99.7 |
| B | 12 | 111 | 12770 | 123.05 | 517 | 503 | 99.7 |
| C | 0 | 10 | 357041 | 2714.28 | 563 | 563 | 131.3 |
| C | 15 | 214 | 222465 | 1689.6 | 563 | 563 | 131.3 |
| C | 14 | 67 | 8113 | 57.49 | 563 | 563 | 131.3 |
| D | 13 | 249 | 855528 | 6290.44 | 558 | 542 | 135.9 |
| D | 2 | 249 | 114491 | 838.36 | 558 | 542 | 135.9 |
| D | 1 | 47 | 110113 | 806.15 | 558 | 542 | 135.9 |
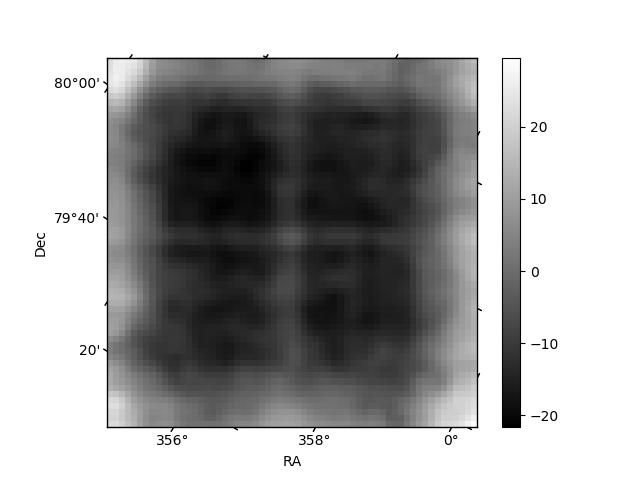
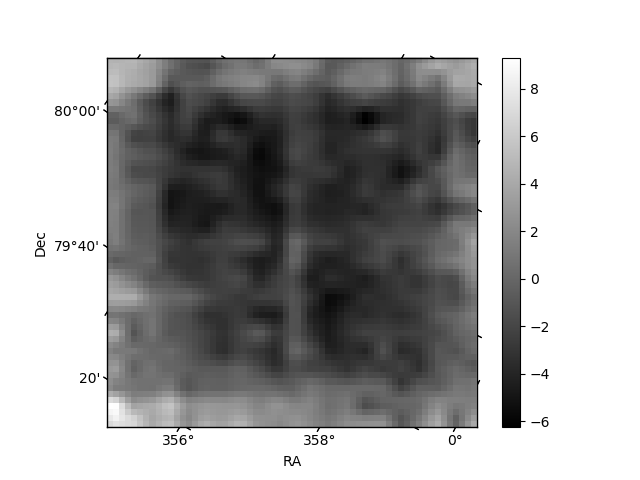
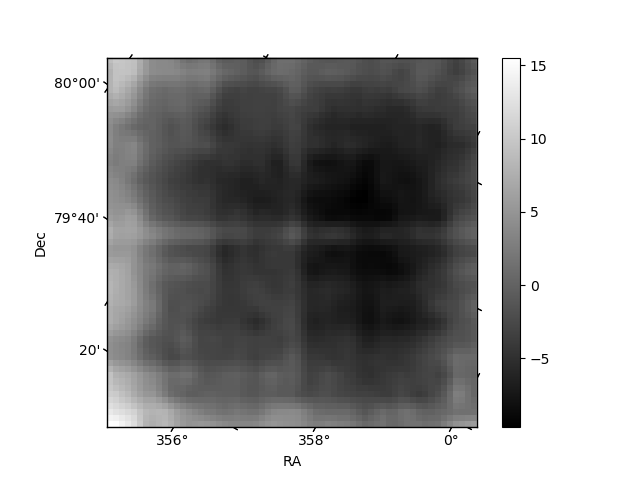
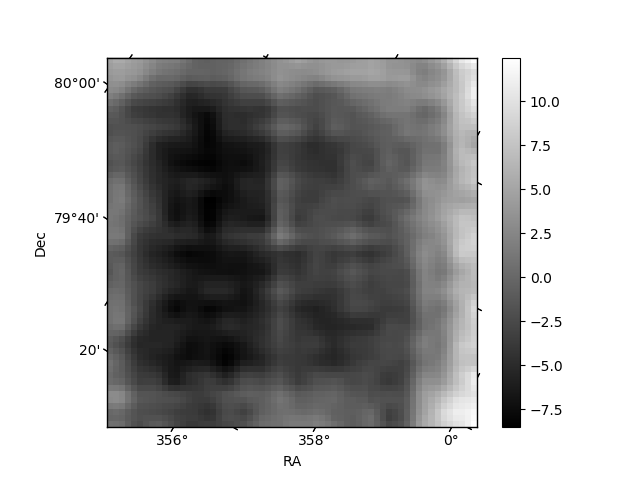
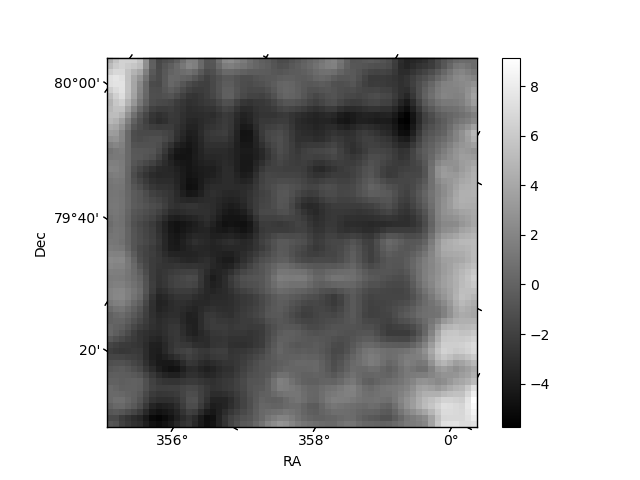
Histogram calculated using DETX and DETY for each event in the final _common_clean file
| Quadrant A | 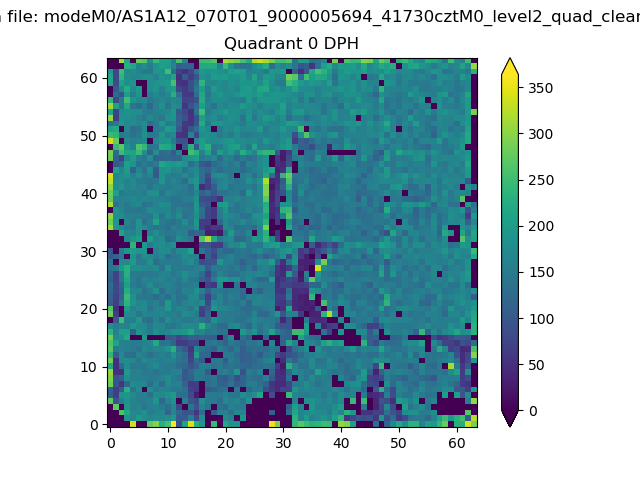 |
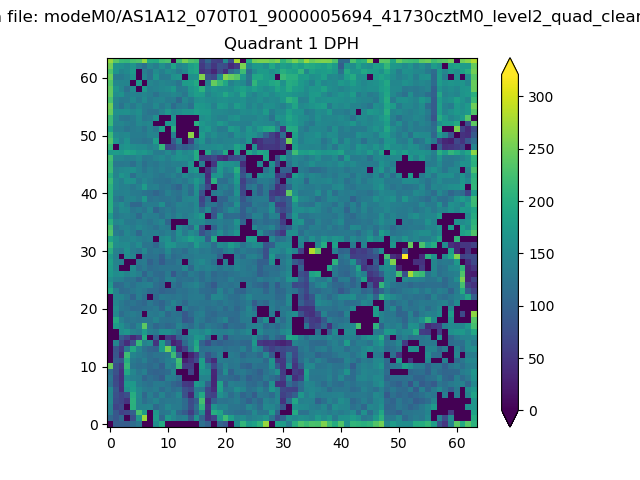 |
Quadrant B |
|---|---|---|---|
| Quadrant D | 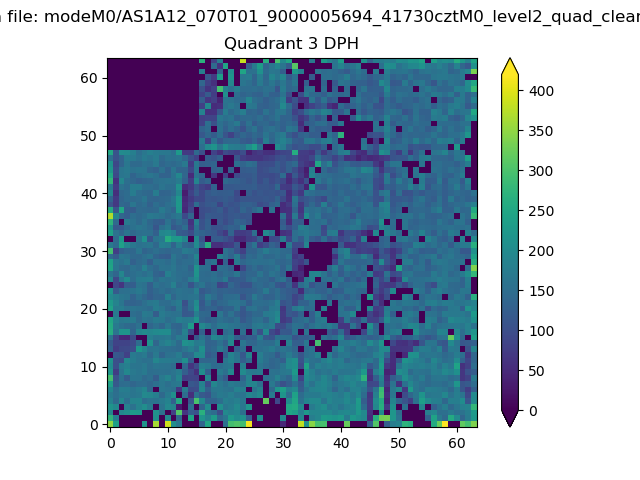 |
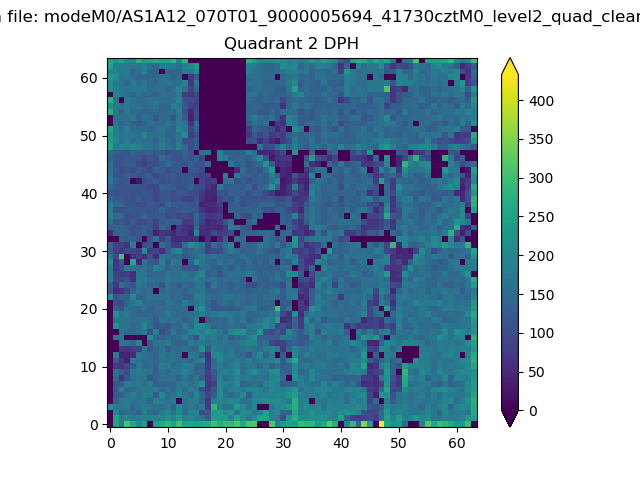 |
Quadrant C |
| Plot type | Count rate plots | Images |
|---|---|---|
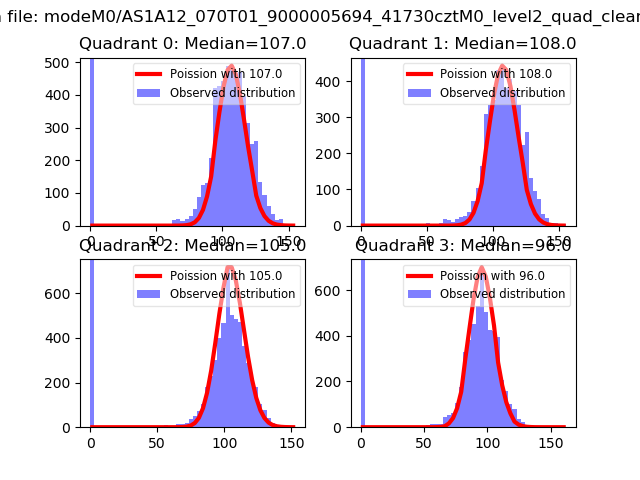
| Comparison with Poisson distribution Blue bars denote a histogram of data divided into 1 sec bins. Red curve is a Poisson curve with rate = median count rate of data. |
 |
 |
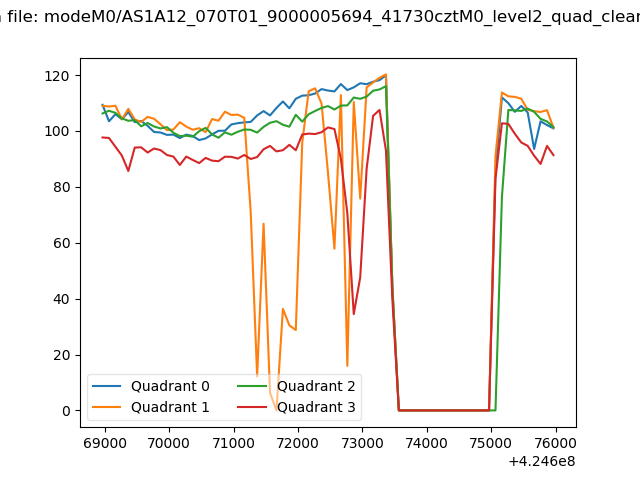
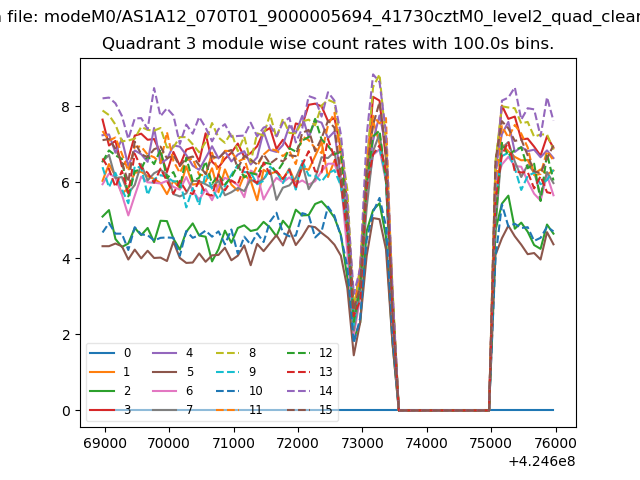
| Quadrant-wise count rates Data is divided into 100 sec bins |
 |
|
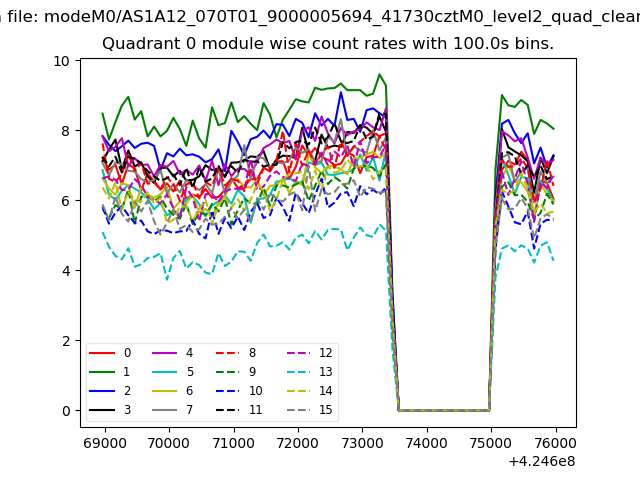
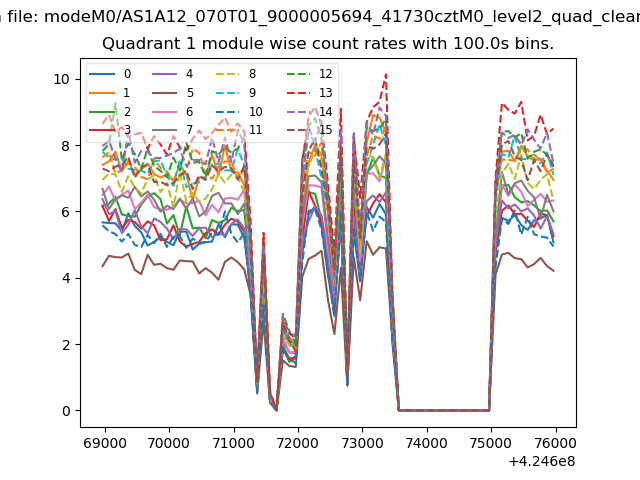
| Module-wise count rates for Quadrant A Data is divided into 100 sec bins |
 |
 |
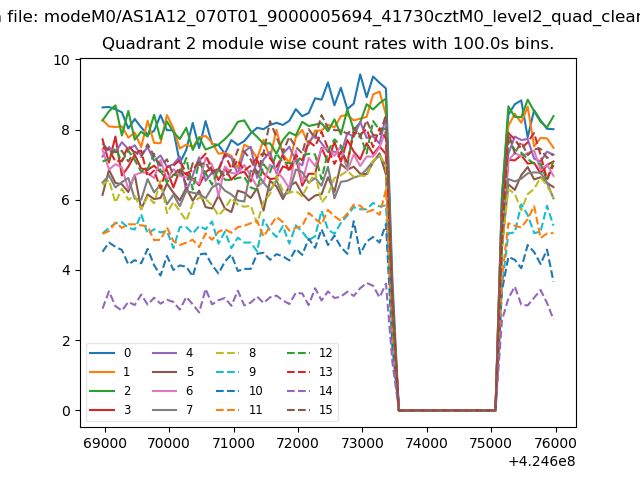
| Module-wise count rates for Quadrant B Data is divided into 100 sec bins |
 |
 |
| Module-wise count rates for Quadrant C Data is divided into 100 sec bins |
 |
 |
| Module-wise count rates for Quadrant D Data is divided into 100 sec bins |
 |
 |
| Parameter | Plot |
|---|---|
| CZT HV Monitor | 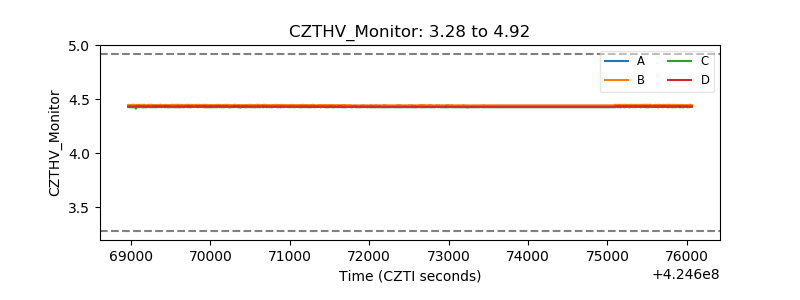 |
| D_VDD | 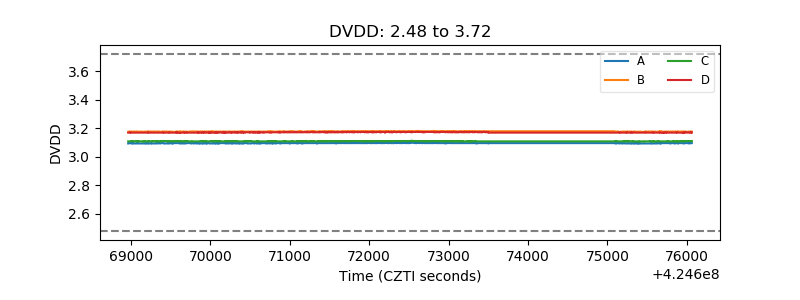 |
| Temperature 1 | 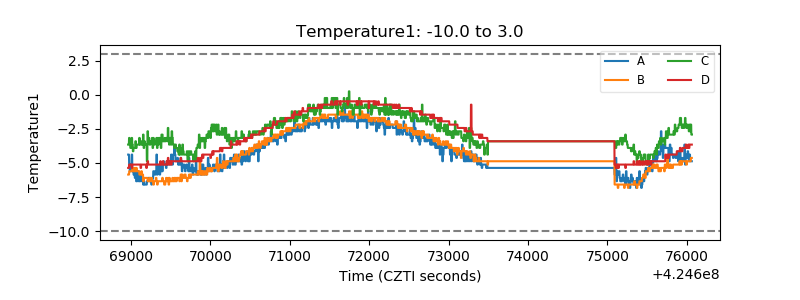 |
| Veto HV Monitor | 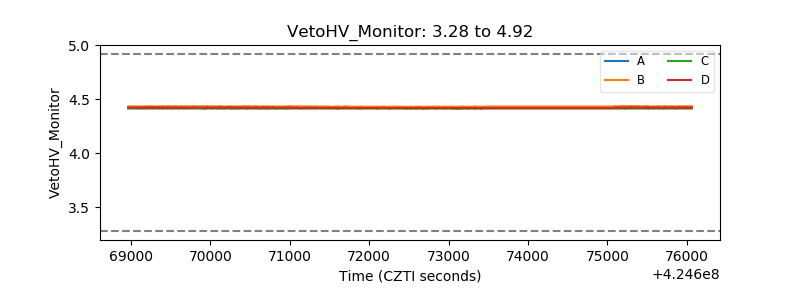 |
| Veto LLD | 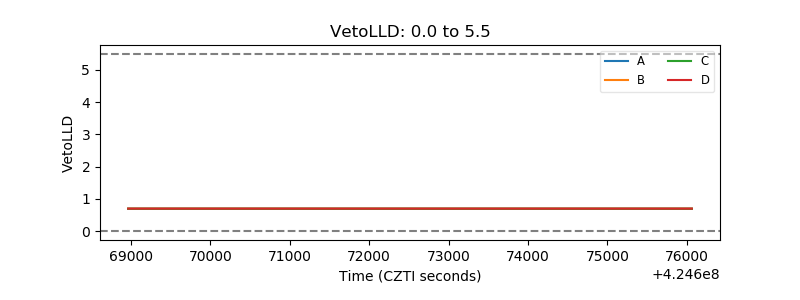 |
| Alpha Counter | 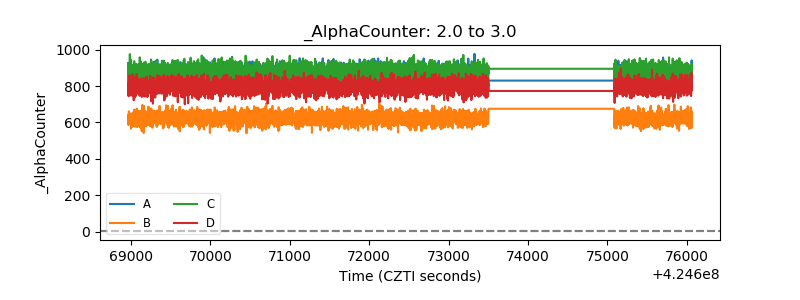 |
| _CPM_Rate | 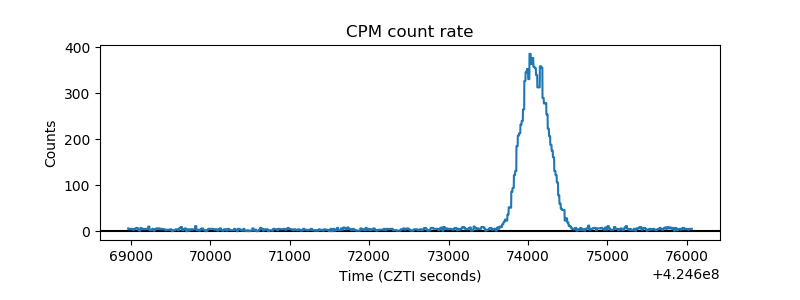 |
| CZT Counter | 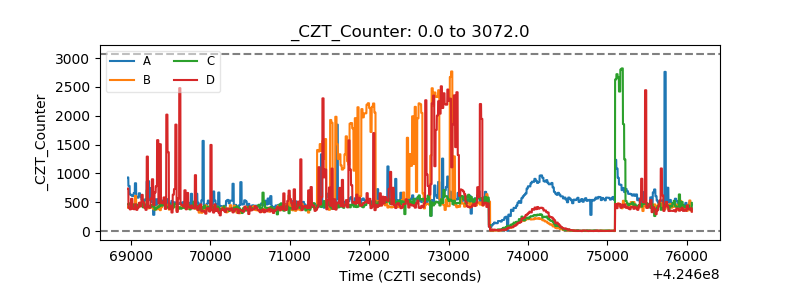 |
| +2.5 Volts monitor | 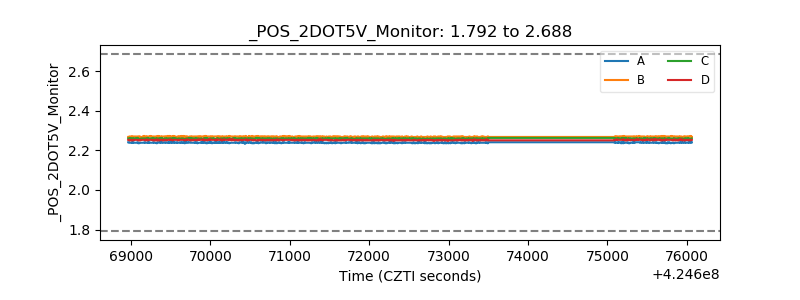 |
| +5 Volts monitor | 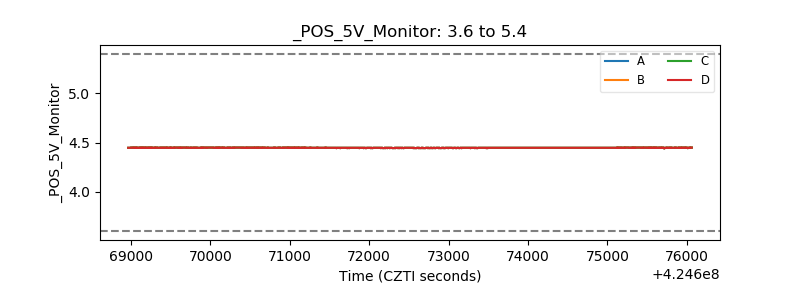 |
| _ROLL_ROT | 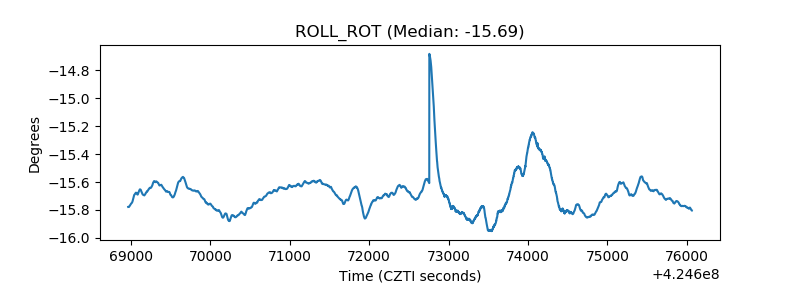 |
| _Roll_DEC | 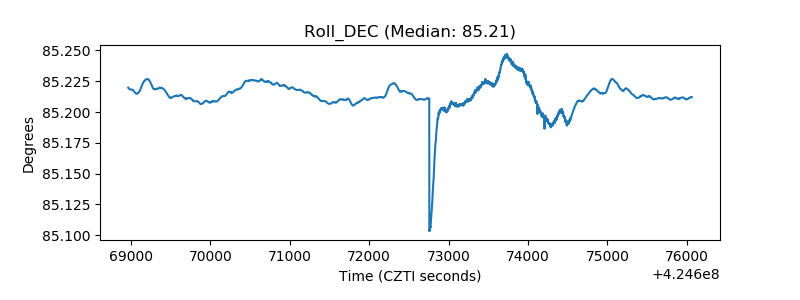 |
| _Roll_RA | 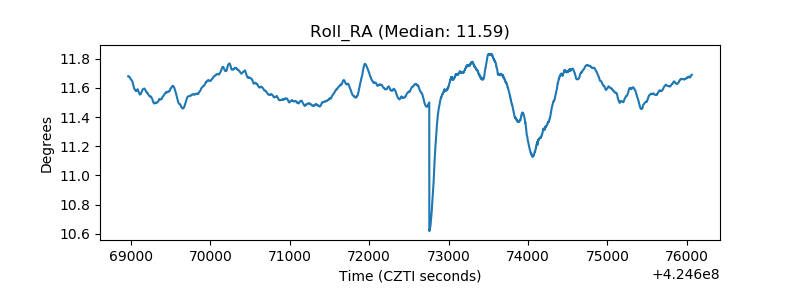 |
| Veto Counter | 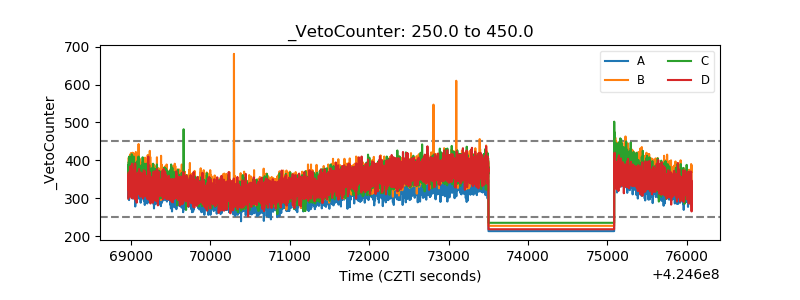 |