| Param | Original file | Final file |
|---|---|---|
| Filename | modeM0/AS1A12_070T01_9000005694_41731cztM0_level2.fits | modeM0/AS1A12_070T01_9000005694_41731cztM0_level2_quad_clean.evt |
| Size (bytes) | 209,226,240 | 58,763,520 |
| Size | 199.5 MB | 56.0 MB |
| Events in quadrant A | 1,933,587 | 393,057 |
| Events in quadrant B | 1,693,225 | 403,589 |
| Events in quadrant C | 1,977,344 | 371,409 |
| Events in quadrant D | 1,850,291 | 349,102 |
| Mode SS | |||
|---|---|---|---|
| Quadrant | BADHDUFLAG | Total packets | Discarded packets |
| A | 0 | 74 | 0 |
| B | 0 | 74 | 0 |
| C | 0 | 74 | 0 |
| D | 0 | 74 | 0 |
| Mode M9 | |||
|---|---|---|---|
| Quadrant | BADHDUFLAG | Total packets | Discarded packets |
| A | 0 | 4 | 0 |
| B | 0 | 5 | 0 |
| C | 0 | 5 | 0 |
| D | 0 | 5 | 0 |
| Mode M0 | |||
|---|---|---|---|
| Quadrant | BADHDUFLAG | Total packets | Discarded packets |
| A | 0 | 7938 | 1 |
| B | 0 | 7734 | 1 |
| C | 0 | 8345 | 1 |
| D | 0 | 8324 | 1 |
| Quadrant | Total seconds | Saturated seconds | Saturation percentage |
|---|---|---|---|
| A | 3708 | 17 | 0.458468% |
| B | 3708 | 16 | 0.431499% |
| C | 3708 | 112 | 3.020496% |
| D | 3708 | 65 | 1.752967% |
Noise dominated data is calculated using 1-second bins in cleaned event files. If a bin has >2000 counts, and if more than 50% of those come from <1% of pixels, then it is considered to be noise-dominated and hence unusable.
| Quadrant | # 1 sec bins | Bins with >0 counts | Bins with >2000 counts | High rate bins dominated by noise | Noise dominated (total time) | Noise dominated (detector-on time) | Marked lightcurve |
|---|---|---|---|---|---|---|---|
| A | 3708 | 3708 | 12 | 12 | 0.32% | 0.32% |  |
| B | 3708 | 3708 | 9 | 9 | 0.24% | 0.24% |  |
| C | 3708 | 3708 | 109 | 109 | 2.94% | 2.94% |  |
| D | 3708 | 3708 | 59 | 59 | 1.59% | 1.59% |  |
Top three noisy pixels from each quadrant. If the there are fewer than three noisy pixels in the level2.evt file, extra rows are filled as -1
| Pixel properties | Quadrant properties | ||||||
|---|---|---|---|---|---|---|---|
| Quadrant | DetID | PixID | Counts | Sigma | Mean | Median | Sigma |
| A | 10 | 83 | 369005 | 4554.59 | 390 | 382 | 80.9 |
| A | 6 | 10 | 29120 | 355.08 | 390 | 382 | 80.9 |
| A | 15 | 223 | 9344 | 110.73 | 390 | 382 | 80.9 |
| B | 0 | 186 | 100577 | 1340.02 | 384 | 374 | 74.8 |
| B | 15 | 85 | 41415 | 548.84 | 384 | 374 | 74.8 |
| B | 0 | 245 | 16584 | 216.78 | 384 | 374 | 74.8 |
| C | 0 | 10 | 383579 | 4491.49 | 366 | 367 | 85.3 |
| C | 15 | 214 | 149867 | 1752.24 | 366 | 367 | 85.3 |
| C | 12 | 249 | 7483 | 83.4 | 366 | 367 | 85.3 |
| D | 2 | 249 | 109496 | 1195.45 | 373 | 361 | 91.3 |
| D | 13 | 249 | 107279 | 1171.17 | 373 | 361 | 91.3 |
| D | 12 | 6 | 74648 | 813.73 | 373 | 361 | 91.3 |
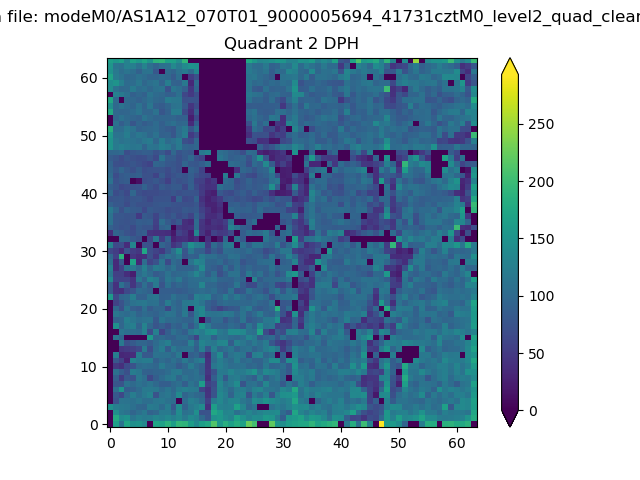
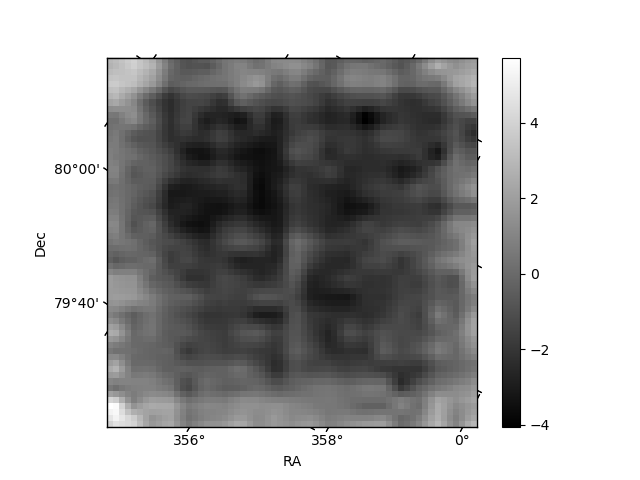
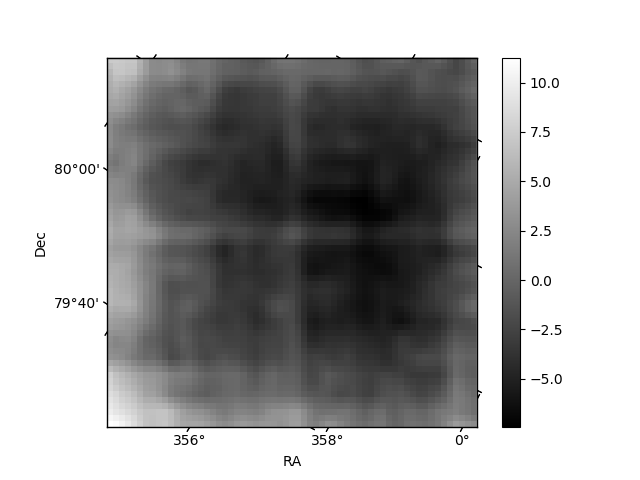
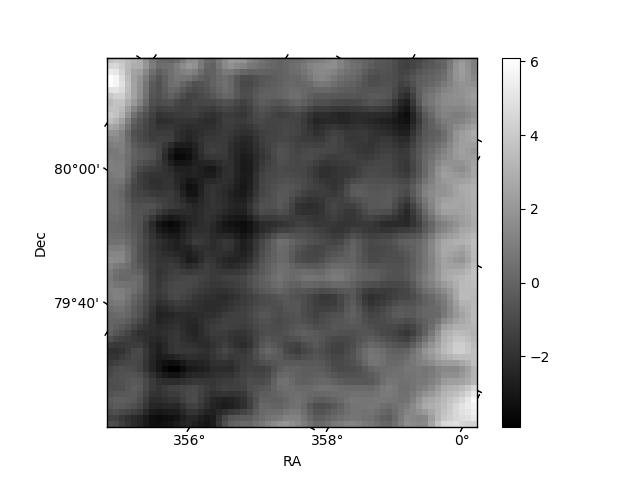
Histogram calculated using DETX and DETY for each event in the final _common_clean file
| Quadrant A | 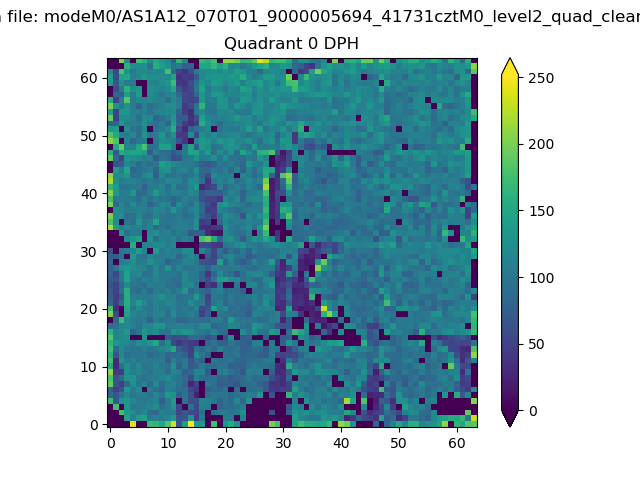 |
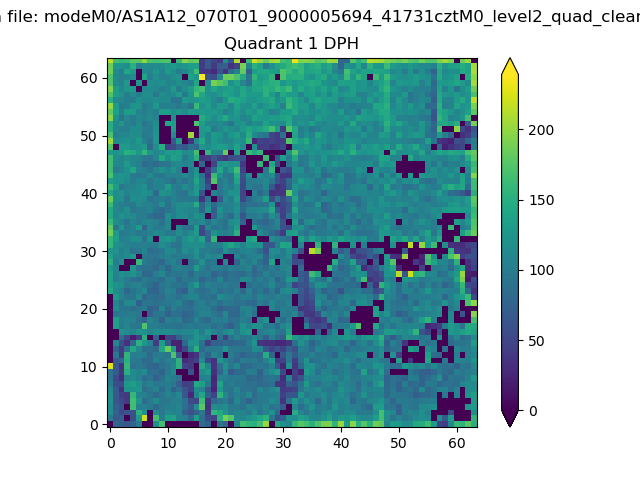 |
Quadrant B |
|---|---|---|---|
| Quadrant D | 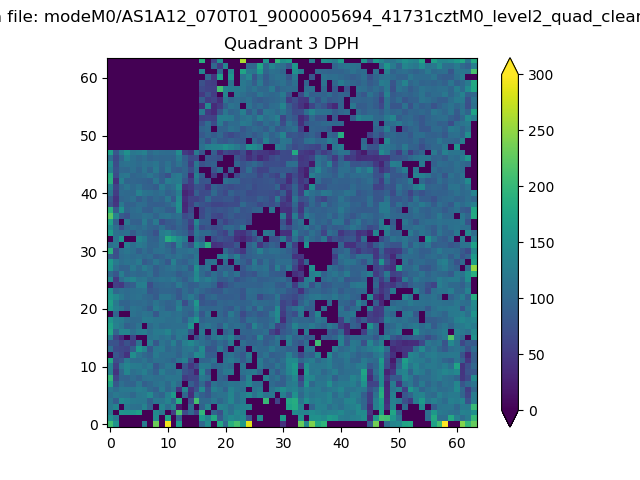 |
 |
Quadrant C |
| Plot type | Count rate plots | Images |
|---|---|---|
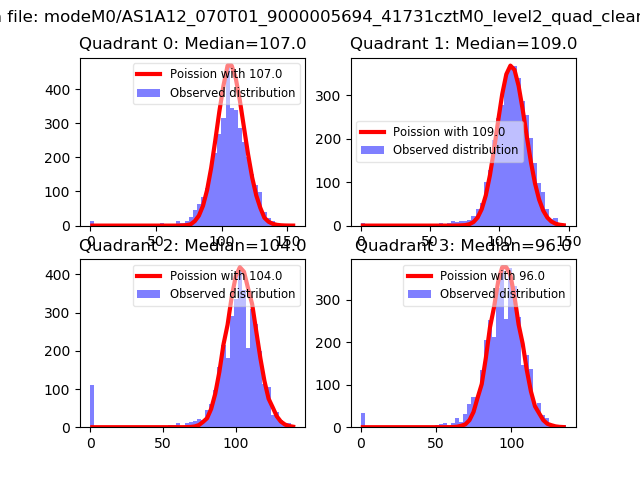
| Comparison with Poisson distribution Blue bars denote a histogram of data divided into 1 sec bins. Red curve is a Poisson curve with rate = median count rate of data. |
 |
 |
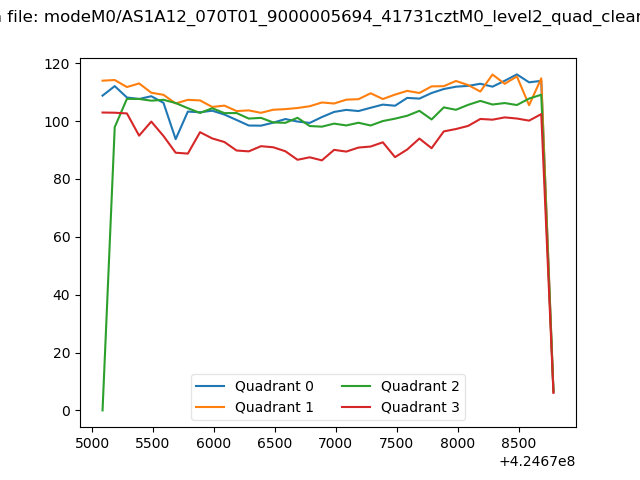
| Quadrant-wise count rates Data is divided into 100 sec bins |
 |
|
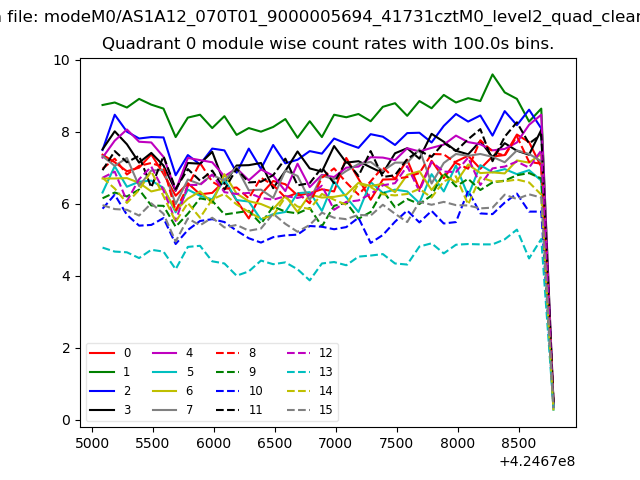
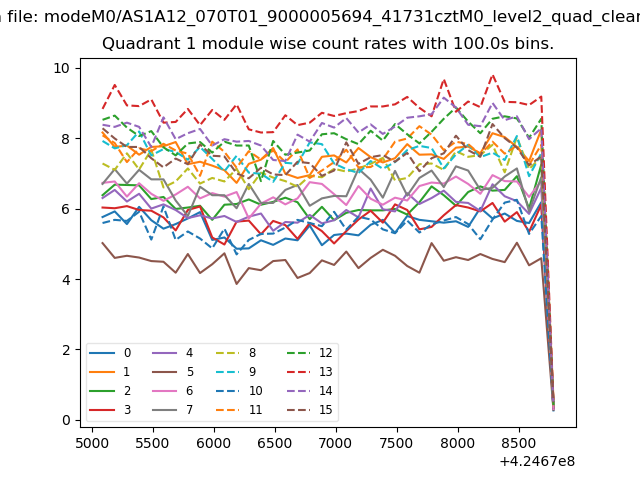
| Module-wise count rates for Quadrant A Data is divided into 100 sec bins |
 |
 |
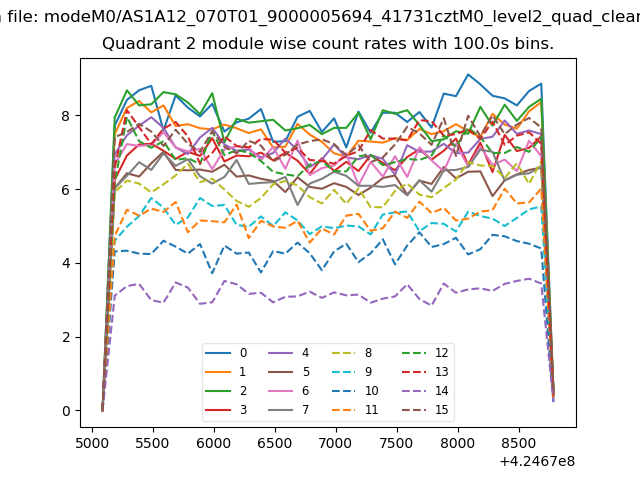
| Module-wise count rates for Quadrant B Data is divided into 100 sec bins |
 |
 |
| Module-wise count rates for Quadrant C Data is divided into 100 sec bins |
 |
 |
| Module-wise count rates for Quadrant D Data is divided into 100 sec bins |
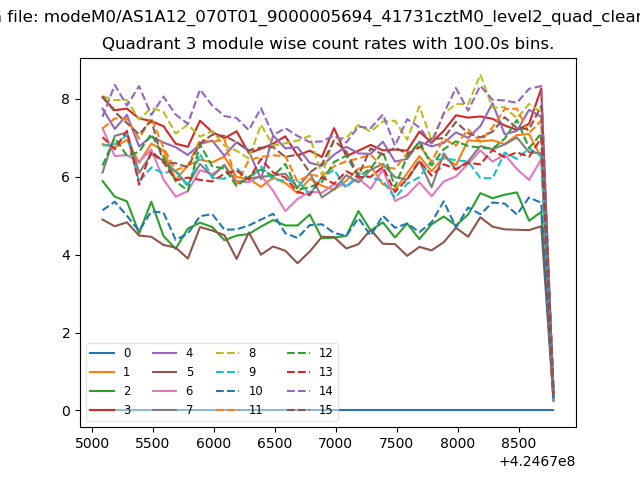 |
 |
| Parameter | Plot |
|---|---|
| CZT HV Monitor | 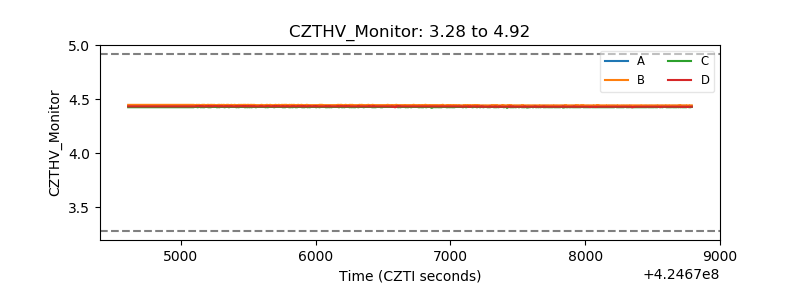 |
| D_VDD | 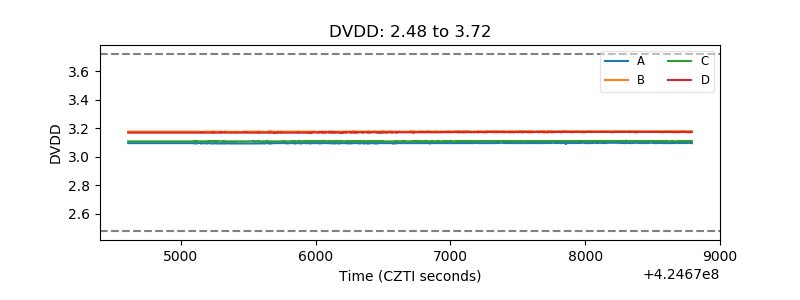 |
| Temperature 1 | 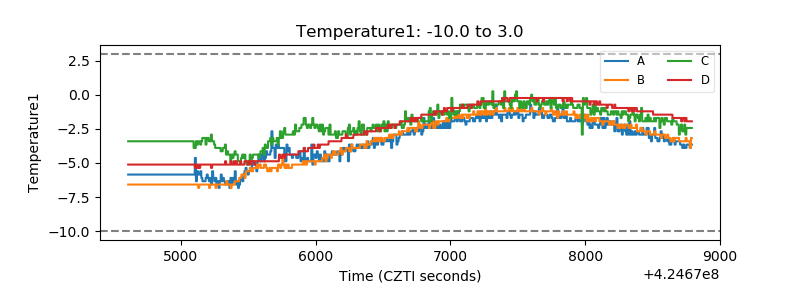 |
| Veto HV Monitor | 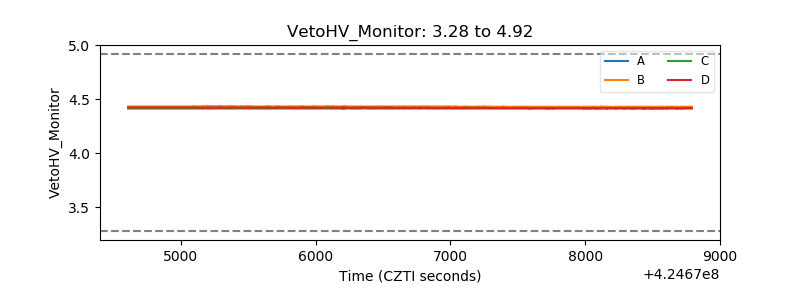 |
| Veto LLD | 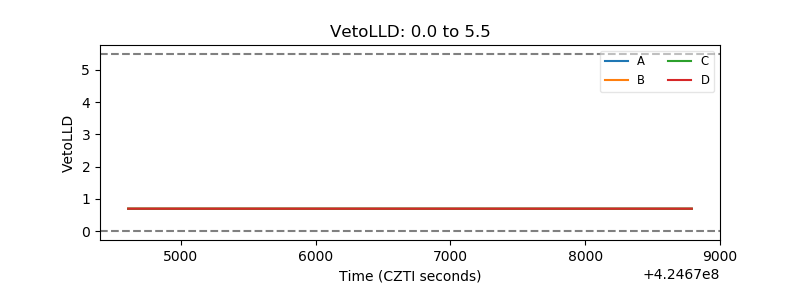 |
| Alpha Counter | 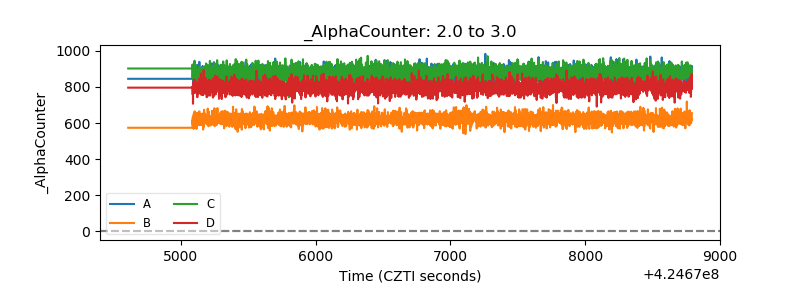 |
| _CPM_Rate | 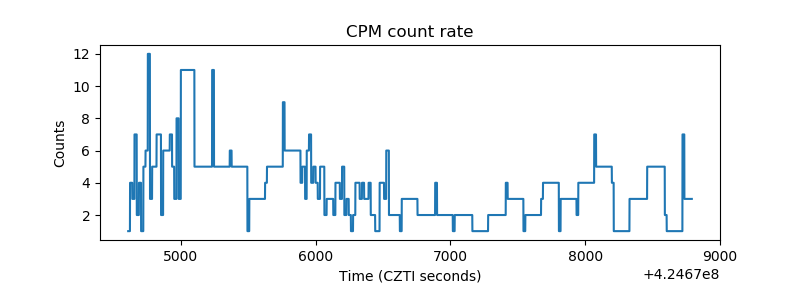 |
| CZT Counter | 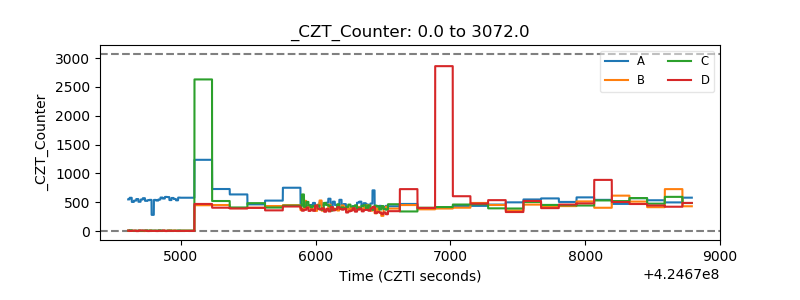 |
| +2.5 Volts monitor | 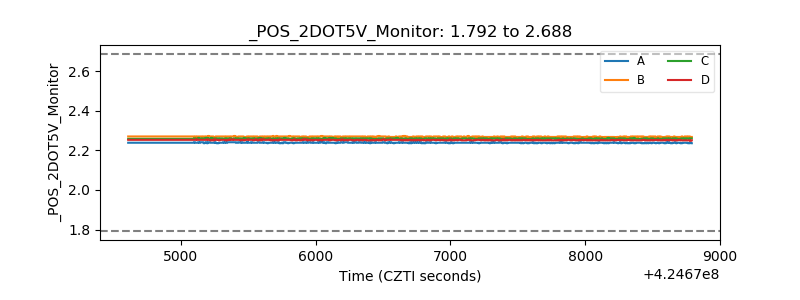 |
| +5 Volts monitor | 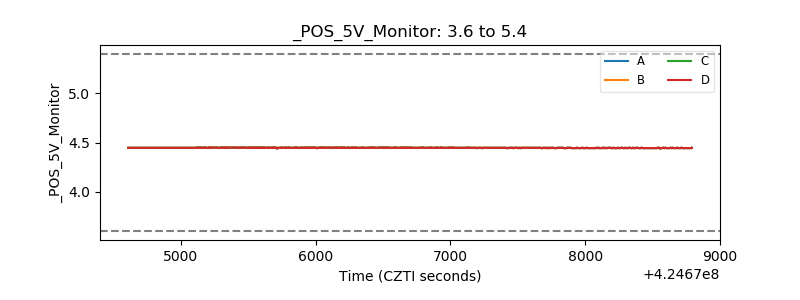 |
| _ROLL_ROT | 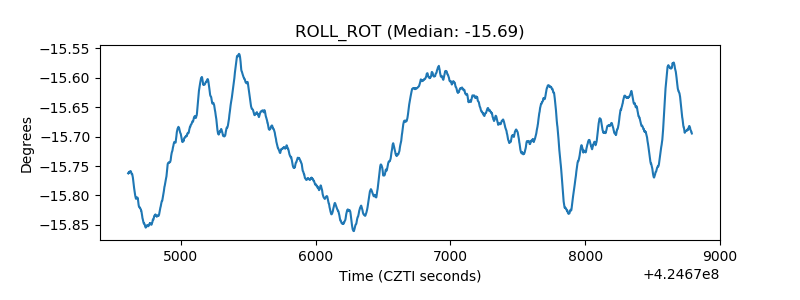 |
| _Roll_DEC | 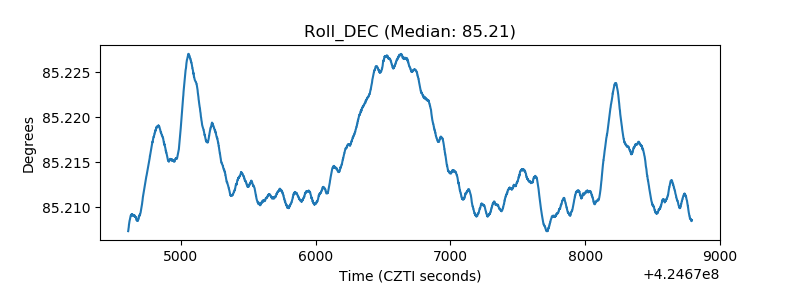 |
| _Roll_RA | 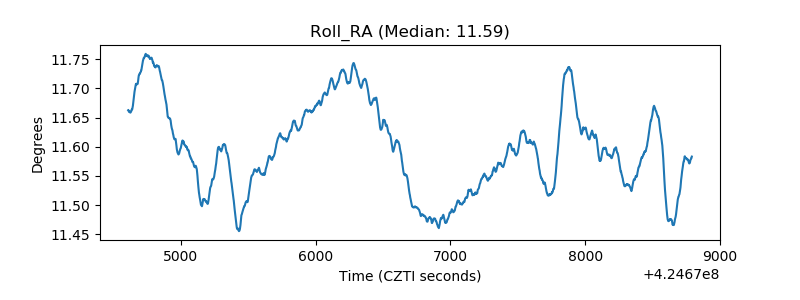 |
| Veto Counter | 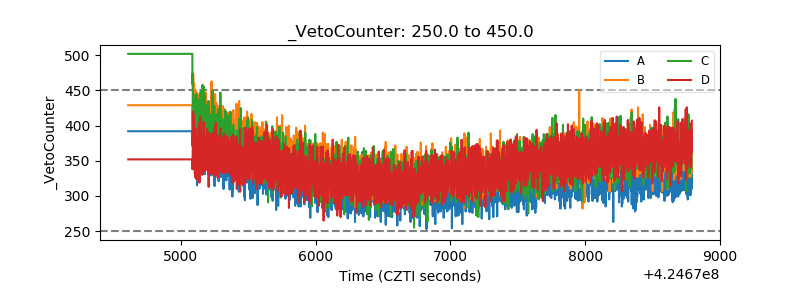 |