| Param | Original file | Final file |
|---|---|---|
| Filename | modeM0/AS1A12_070T01_9000005694_41738cztM0_level2.fits | modeM0/AS1A12_070T01_9000005694_41738cztM0_level2_quad_clean.evt |
| Size (bytes) | 178,649,280 | 52,614,720 |
| Size | 170.4 MB | 50.2 MB |
| Events in quadrant A | 1,652,124 | 349,832 |
| Events in quadrant B | 1,518,353 | 358,578 |
| Events in quadrant C | 1,525,819 | 340,384 |
| Events in quadrant D | 1,656,893 | 309,425 |
| Mode SS | |||
|---|---|---|---|
| Quadrant | BADHDUFLAG | Total packets | Discarded packets |
| A | 0 | 66 | 0 |
| B | 0 | 66 | 0 |
| C | 0 | 66 | 0 |
| D | 0 | 66 | 0 |
| Mode M0 | |||
|---|---|---|---|
| Quadrant | BADHDUFLAG | Total packets | Discarded packets |
| A | 0 | 6810 | 0 |
| B | 0 | 6939 | 0 |
| C | 0 | 6746 | 0 |
| D | 0 | 7460 | 0 |
| Quadrant | Total seconds | Saturated seconds | Saturation percentage |
|---|---|---|---|
| A | 3311 | 14 | 0.422833% |
| B | 3311 | 15 | 0.453035% |
| C | 3311 | 0 | 0.000000% |
| D | 3312 | 60 | 1.811594% |
Noise dominated data is calculated using 1-second bins in cleaned event files. If a bin has >2000 counts, and if more than 50% of those come from <1% of pixels, then it is considered to be noise-dominated and hence unusable.
| Quadrant | # 1 sec bins | Bins with >0 counts | Bins with >2000 counts | High rate bins dominated by noise | Noise dominated (total time) | Noise dominated (detector-on time) | Marked lightcurve |
|---|---|---|---|---|---|---|---|
| A | 3311 | 3311 | 11 | 11 | 0.33% | 0.33% | 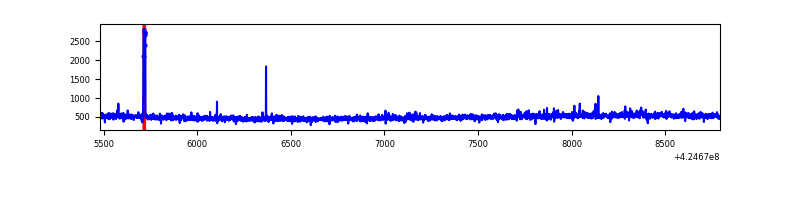 |
| B | 3311 | 3311 | 9 | 9 | 0.27% | 0.27% | 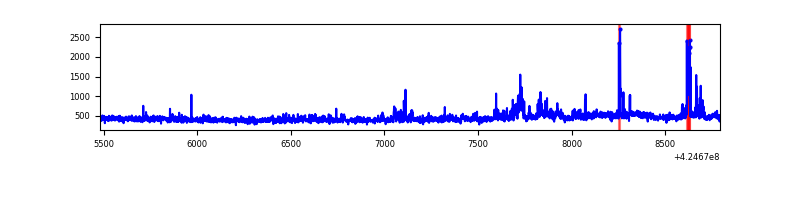 |
| C | 3311 | 3311 | 0 | 0 | 0.00% | 0.00% | 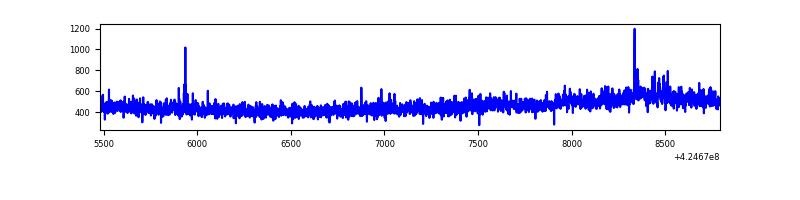 |
| D | 3312 | 3312 | 55 | 55 | 1.66% | 1.66% | 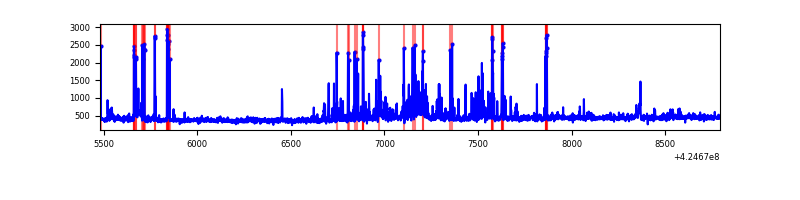 |
Top three noisy pixels from each quadrant. If the there are fewer than three noisy pixels in the level2.evt file, extra rows are filled as -1
| Pixel properties | Quadrant properties | ||||||
|---|---|---|---|---|---|---|---|
| Quadrant | DetID | PixID | Counts | Sigma | Mean | Median | Sigma |
| A | 10 | 83 | 260230 | 3595.51 | 346 | 339 | 72.3 |
| A | 6 | 10 | 29094 | 397.82 | 346 | 339 | 72.3 |
| A | 13 | 248 | 8600 | 114.29 | 346 | 339 | 72.3 |
| B | 0 | 186 | 100536 | 1511.84 | 340 | 331 | 66.3 |
| B | 15 | 85 | 41363 | 619.07 | 340 | 331 | 66.3 |
| B | 0 | 245 | 15962 | 235.83 | 340 | 331 | 66.3 |
| C | 15 | 214 | 132566 | 1706.25 | 331 | 333 | 77.5 |
| C | 0 | 10 | 83364 | 1071.38 | 331 | 333 | 77.5 |
| C | 12 | 249 | 7424 | 91.5 | 331 | 333 | 77.5 |
| D | 2 | 249 | 107754 | 1318.49 | 331 | 321 | 81.5 |
| D | 13 | 249 | 78060 | 954.06 | 331 | 321 | 81.5 |
| D | 12 | 6 | 72815 | 889.69 | 331 | 321 | 81.5 |
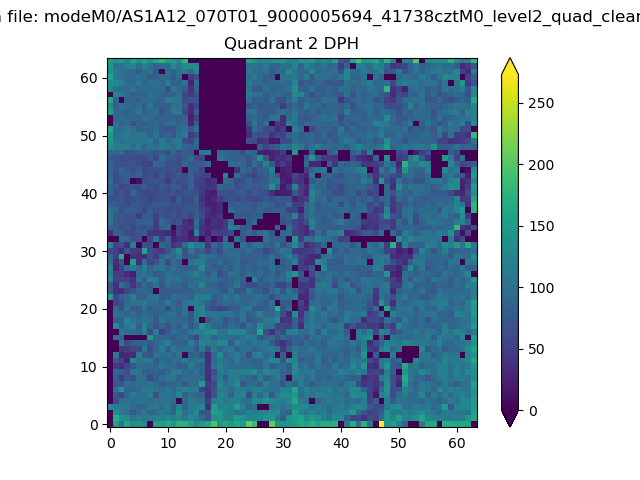
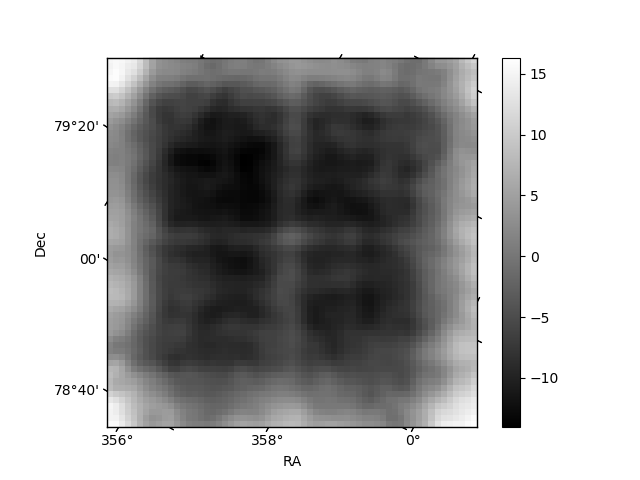
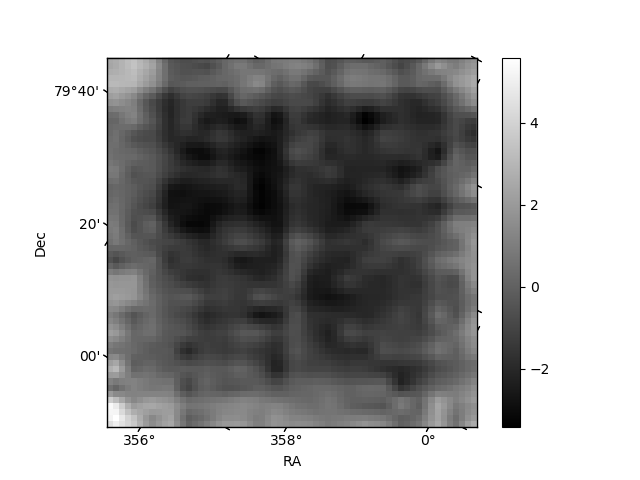
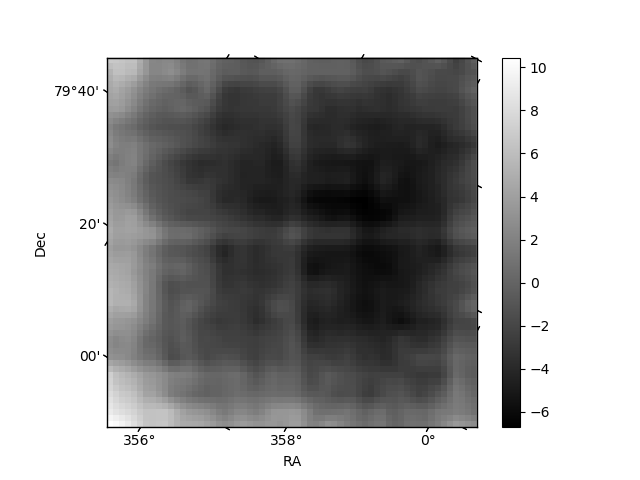
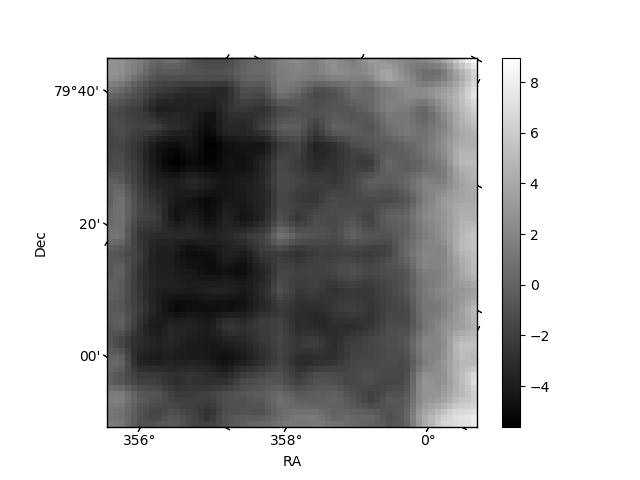
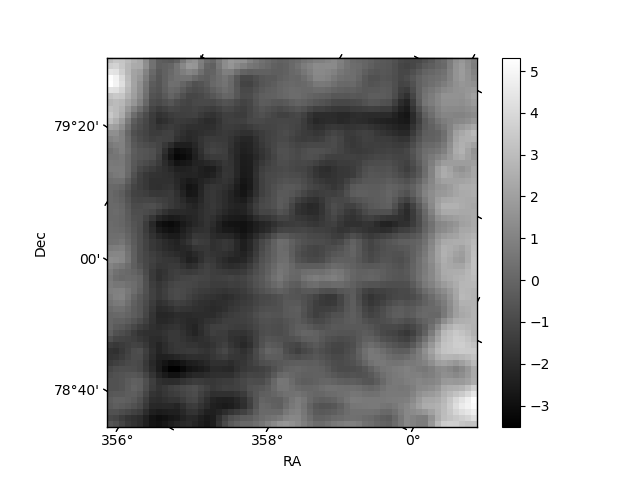
Histogram calculated using DETX and DETY for each event in the final _common_clean file
| Quadrant A | 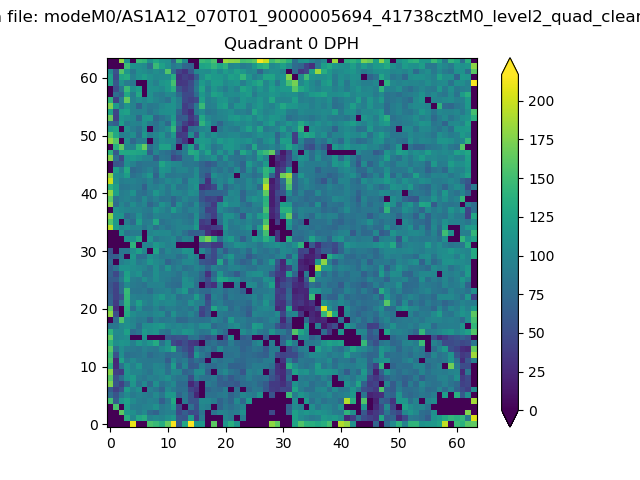 |
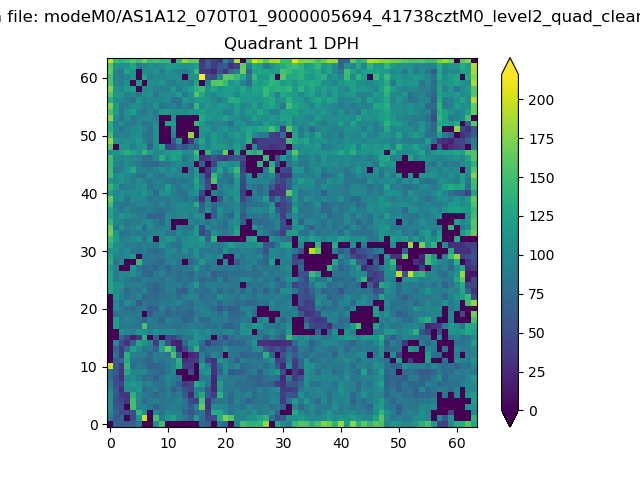 |
Quadrant B |
|---|---|---|---|
| Quadrant D | 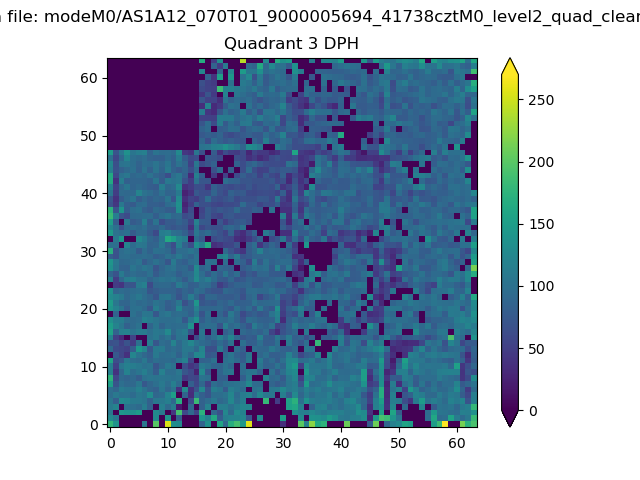 |
 |
Quadrant C |
| Plot type | Count rate plots | Images |
|---|---|---|
| Comparison with Poisson distribution Blue bars denote a histogram of data divided into 1 sec bins. Red curve is a Poisson curve with rate = median count rate of data. |
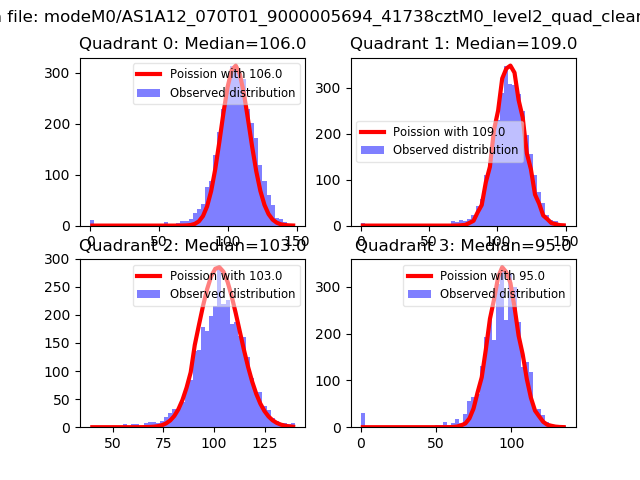 |
 |
| Quadrant-wise count rates Data is divided into 100 sec bins |
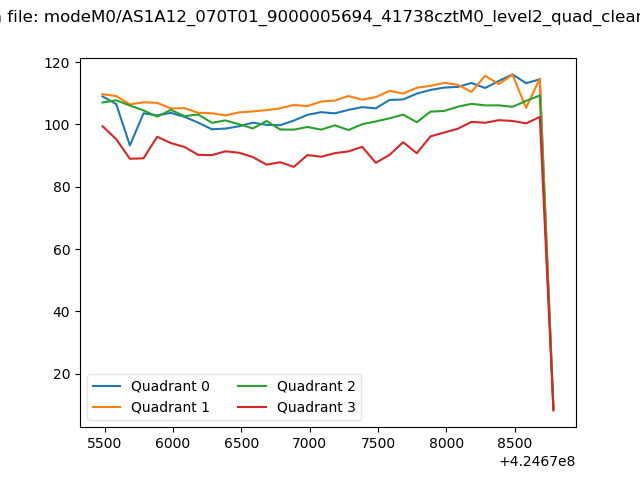 |
|
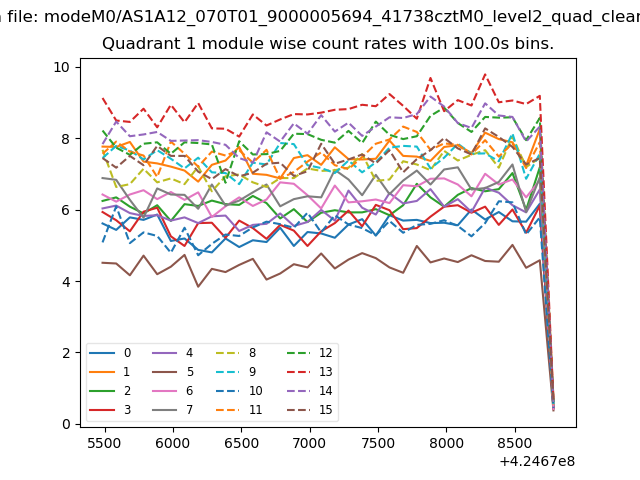
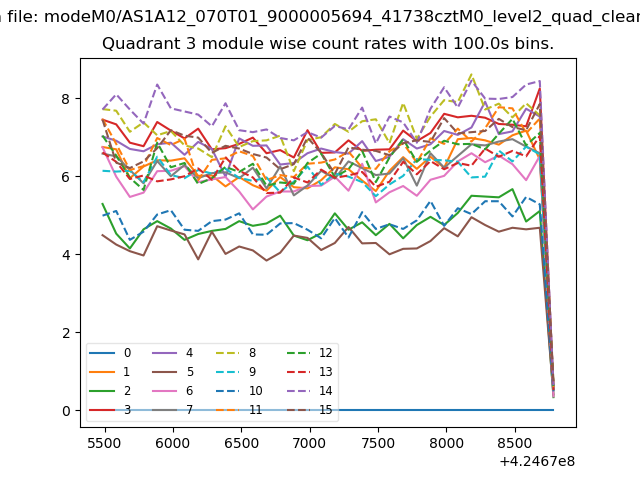
| Module-wise count rates for Quadrant A Data is divided into 100 sec bins |
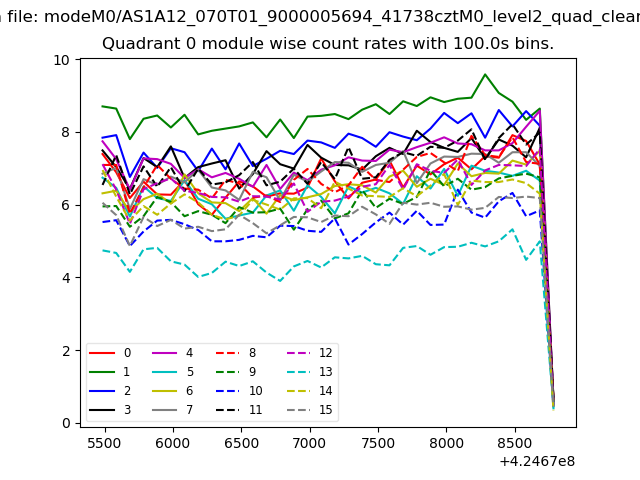 |
 |
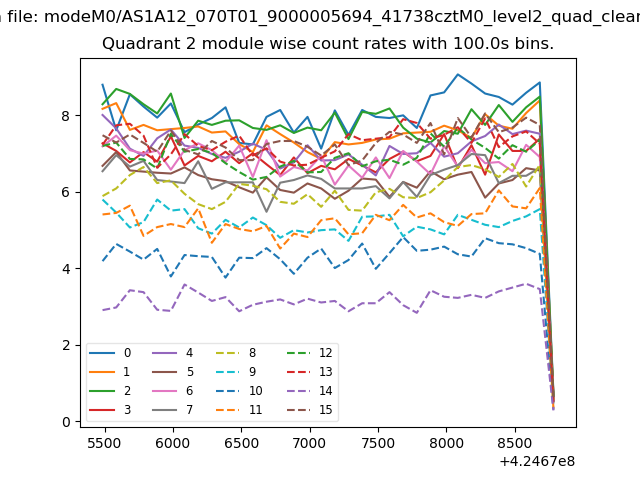
| Module-wise count rates for Quadrant B Data is divided into 100 sec bins |
 |
 |
| Module-wise count rates for Quadrant C Data is divided into 100 sec bins |
 |
 |
| Module-wise count rates for Quadrant D Data is divided into 100 sec bins |
 |
 |
| Parameter | Plot |
|---|---|
| CZT HV Monitor | 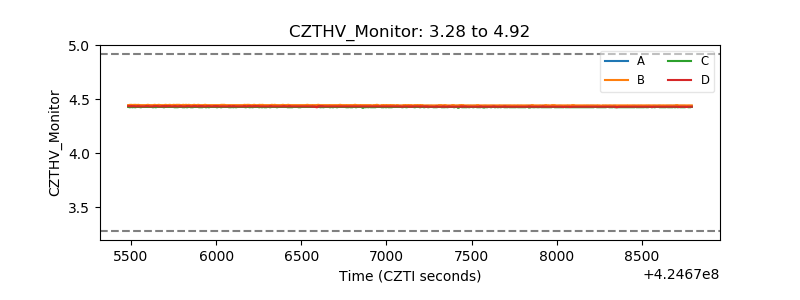 |
| D_VDD | 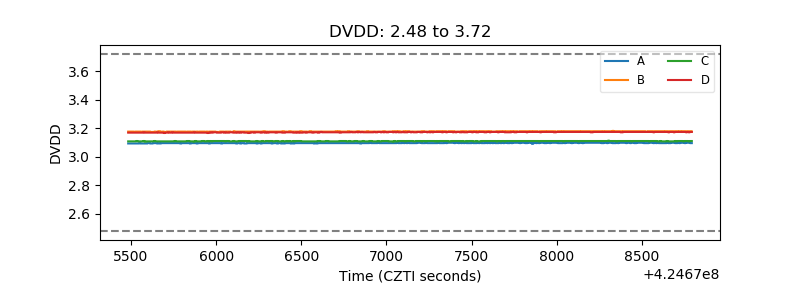 |
| Temperature 1 |  |
| Veto HV Monitor | 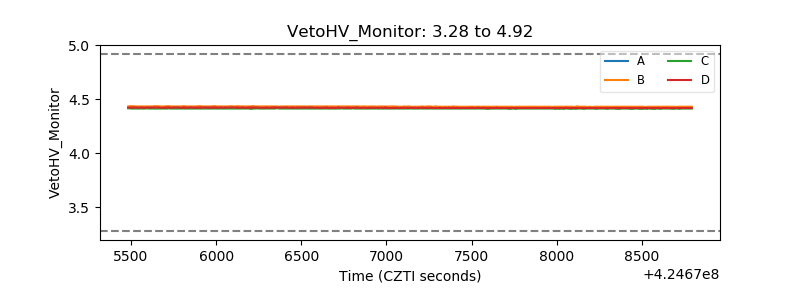 |
| Veto LLD | 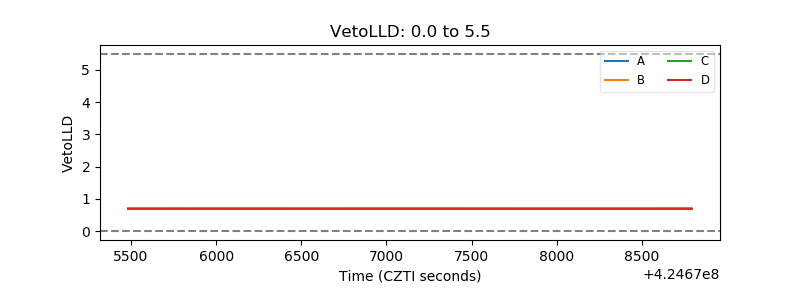 |
| Alpha Counter | 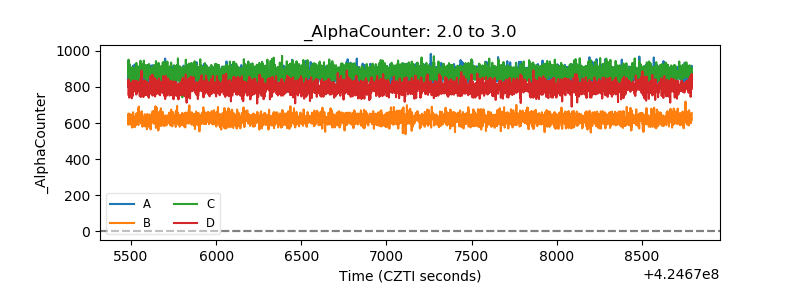 |
| _CPM_Rate | 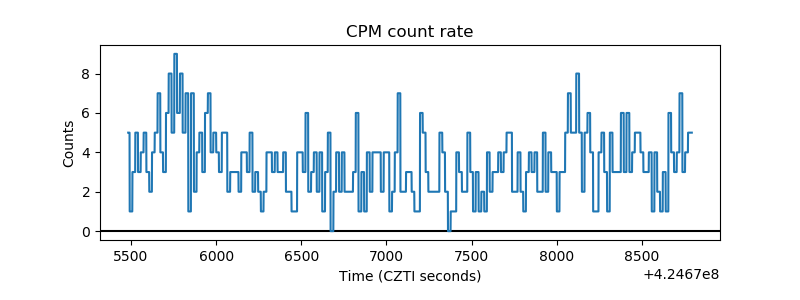 |
| CZT Counter | 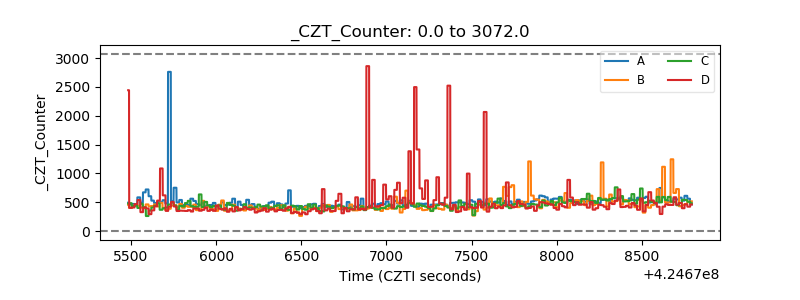 |
| +2.5 Volts monitor | 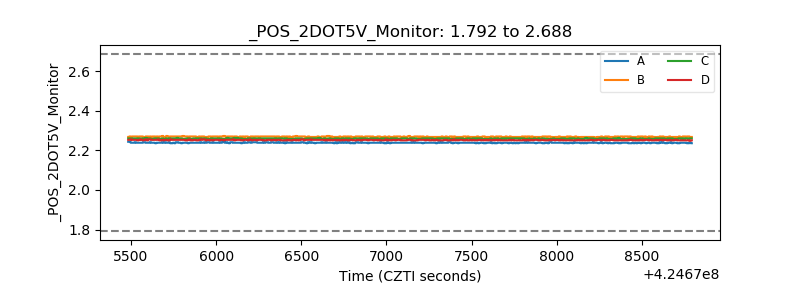 |
| +5 Volts monitor | 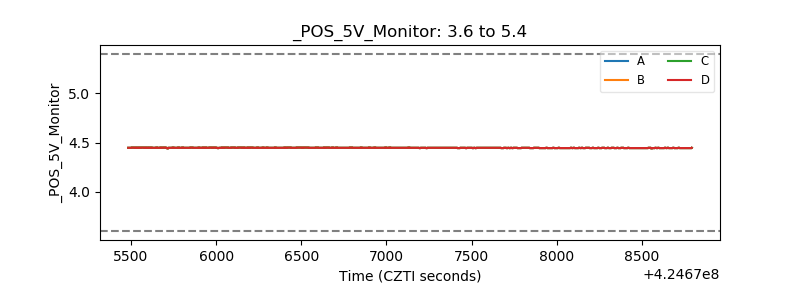 |
| _ROLL_ROT | 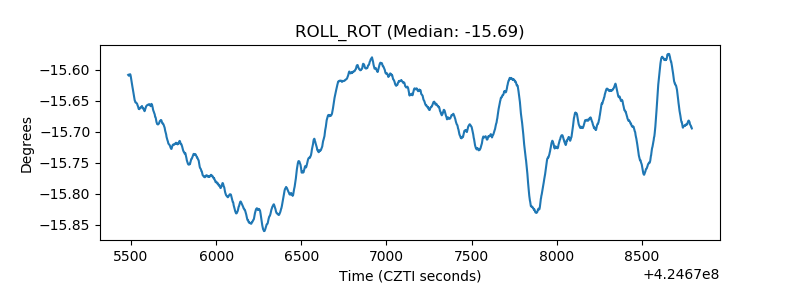 |
| _Roll_DEC | 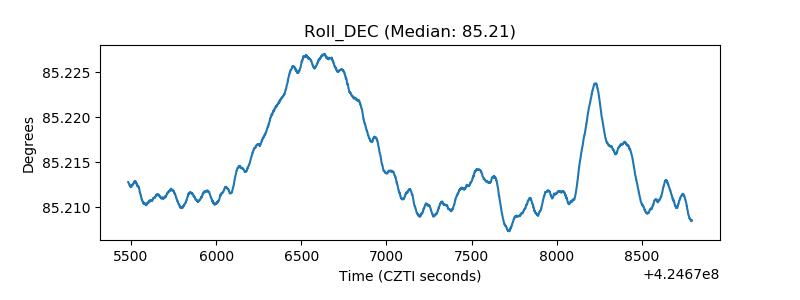 |
| _Roll_RA | 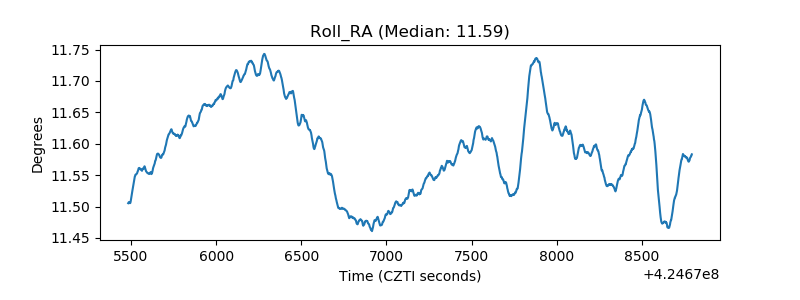 |
| Veto Counter | 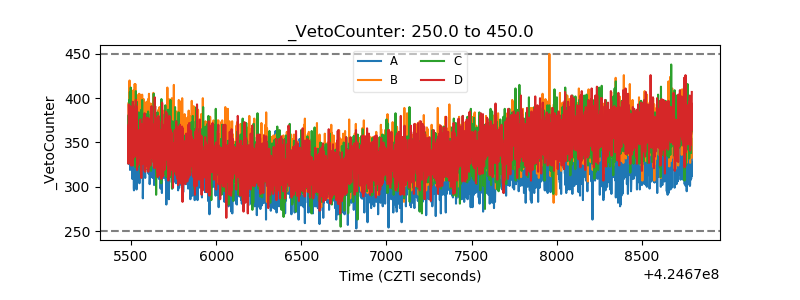 |