| Param | Original file | Final file |
|---|---|---|
| Filename | modeM0/AS1A12_077T11_9000005696_41731cztM0_level2.fits | modeM0/AS1A12_077T11_9000005696_41731cztM0_level2_quad_clean.evt |
| Size (bytes) | 67,884,480 | 15,736,320 |
| Size | 64.7 MB | 15.0 MB |
| Events in quadrant A | 717,289 | 107,964 |
| Events in quadrant B | 441,339 | 113,728 |
| Events in quadrant C | 744,717 | 89,682 |
| Events in quadrant D | 534,884 | 94,035 |
| Mode M9 | |||
|---|---|---|---|
| Quadrant | BADHDUFLAG | Total packets | Discarded packets |
| A | 0 | 17 | 0 |
| B | 0 | 17 | 0 |
| C | 0 | 17 | 0 |
| D | 0 | 17 | 0 |
| Mode M0 | |||
|---|---|---|---|
| Quadrant | BADHDUFLAG | Total packets | Discarded packets |
| A | 0 | 2770 | 1 |
| B | 0 | 1855 | 2 |
| C | 0 | 2767 | 1 |
| D | 0 | 2188 | 1 |
| Mode SS | |||
|---|---|---|---|
| Quadrant | BADHDUFLAG | Total packets | Discarded packets |
| A | 0 | 20 | 0 |
| B | 0 | 20 | 0 |
| C | 0 | 20 | 0 |
| D | 0 | 20 | 0 |
| Quadrant | Total seconds | Saturated seconds | Saturation percentage |
|---|---|---|---|
| A | 920 | 14 | 1.521739% |
| B | 919 | 5 | 0.544070% |
| C | 919 | 119 | 12.948857% |
| D | 919 | 33 | 3.590860% |
Noise dominated data is calculated using 1-second bins in cleaned event files. If a bin has >2000 counts, and if more than 50% of those come from <1% of pixels, then it is considered to be noise-dominated and hence unusable.
| Quadrant | # 1 sec bins | Bins with >0 counts | Bins with >2000 counts | High rate bins dominated by noise | Noise dominated (total time) | Noise dominated (detector-on time) | Marked lightcurve |
|---|---|---|---|---|---|---|---|
| A | 920 | 920 | 2 | 2 | 0.22% | 0.22% | 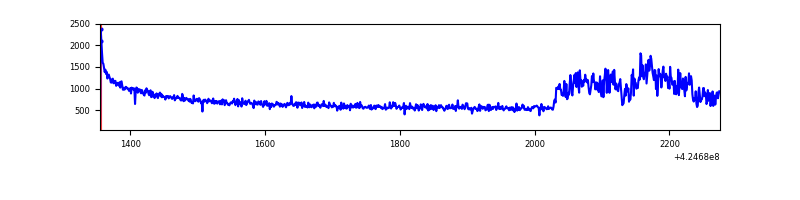 |
| B | 919 | 919 | 0 | 0 | 0.00% | 0.00% | 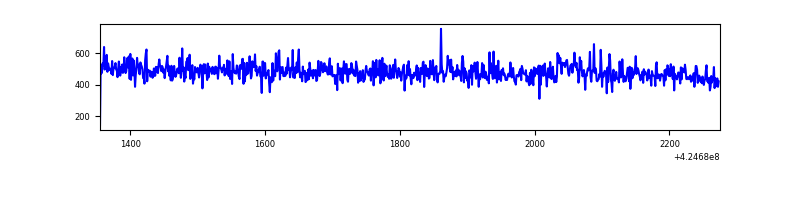 |
| C | 919 | 919 | 115 | 115 | 12.51% | 12.51% | 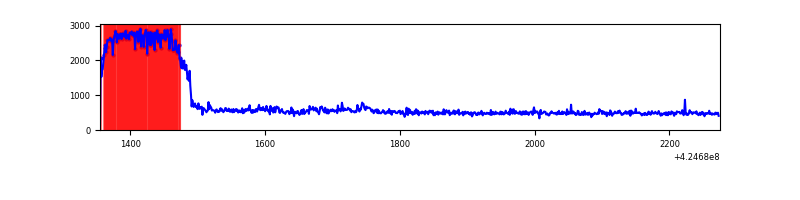 |
| D | 919 | 919 | 33 | 33 | 3.59% | 3.59% | 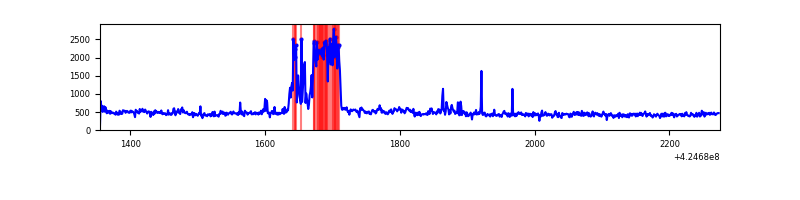 |
Top three noisy pixels from each quadrant. If the there are fewer than three noisy pixels in the level2.evt file, extra rows are filled as -1
| Pixel properties | Quadrant properties | ||||||
|---|---|---|---|---|---|---|---|
| Quadrant | DetID | PixID | Counts | Sigma | Mean | Median | Sigma |
| A | 10 | 83 | 154229 | 6364.47 | 110 | 108 | 24.2 |
| A | 15 | 223 | 135052 | 5572.55 | 110 | 108 | 24.2 |
| A | 13 | 254 | 1653 | 63.8 | 110 | 108 | 24.2 |
| B | 0 | 183 | 4551 | 189.31 | 110 | 107 | 23.5 |
| B | 12 | 111 | 2838 | 116.34 | 110 | 107 | 23.5 |
| B | 14 | 111 | 2592 | 105.86 | 110 | 107 | 23.5 |
| C | 0 | 10 | 331226 | 13499.07 | 96 | 96 | 24.5 |
| C | 15 | 214 | 37874 | 1540.08 | 96 | 96 | 24.5 |
| C | 14 | 67 | 870 | 31.55 | 96 | 96 | 24.5 |
| D | 13 | 249 | 96145 | 3500.07 | 103 | 100 | 27.4 |
| D | 2 | 16 | 14920 | 540.07 | 103 | 100 | 27.4 |
| D | 12 | 6 | 10805 | 390.11 | 103 | 100 | 27.4 |
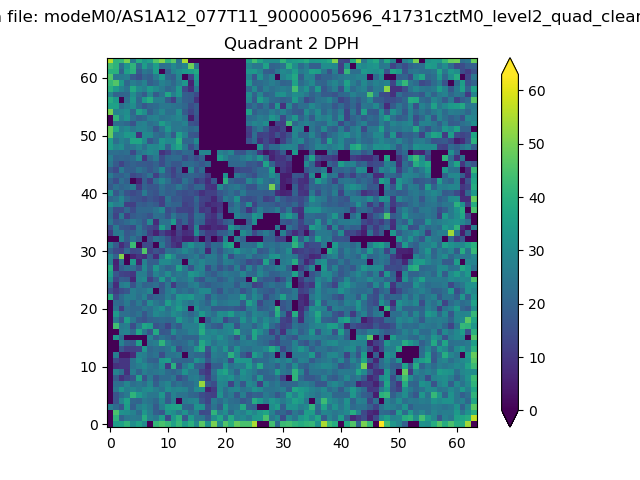
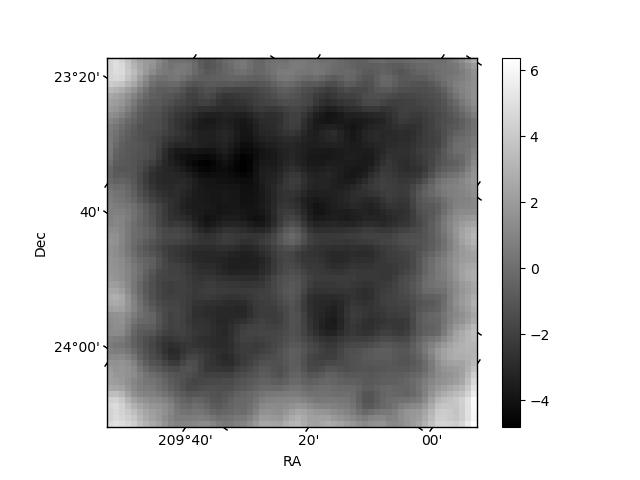
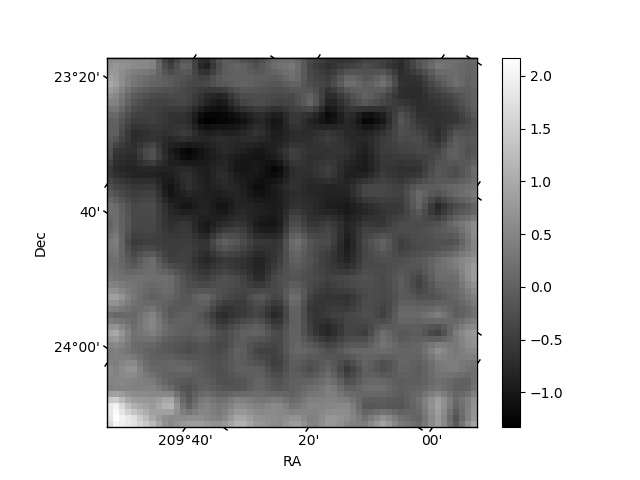
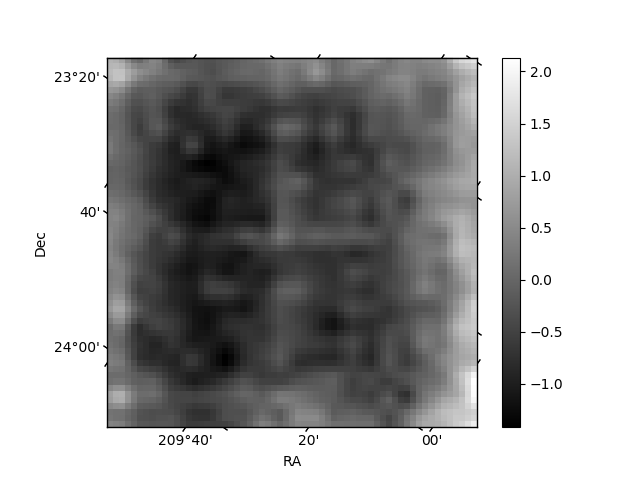
Histogram calculated using DETX and DETY for each event in the final _common_clean file
| Quadrant A | 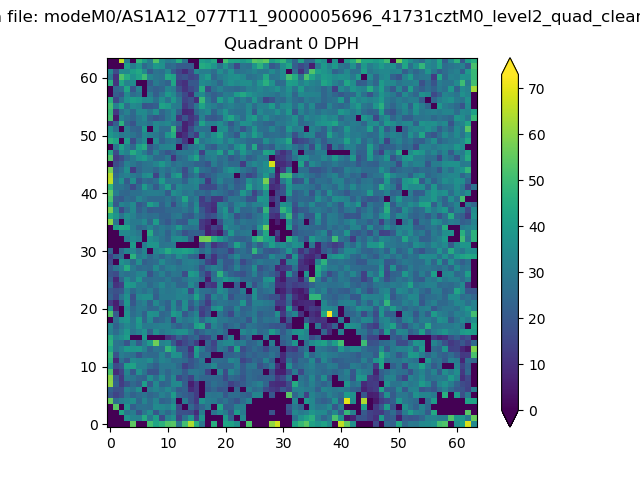 |
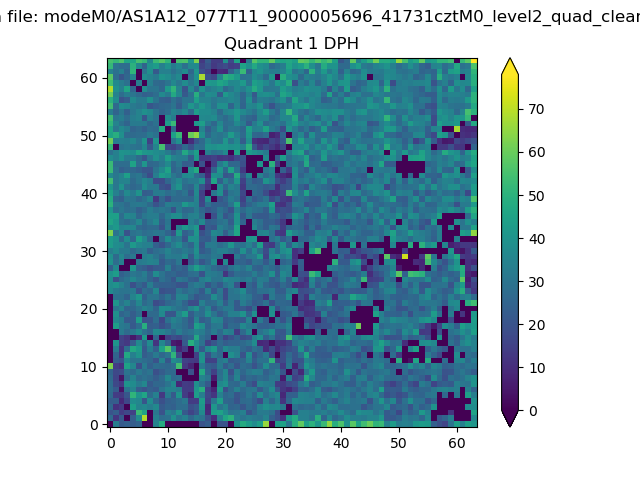 |
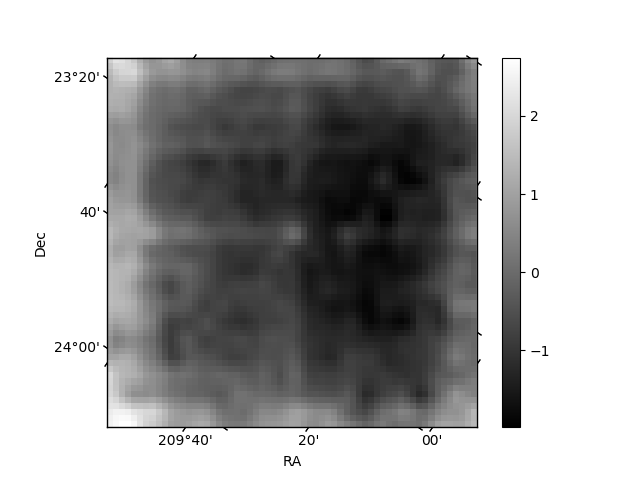
Quadrant B |
|---|---|---|---|
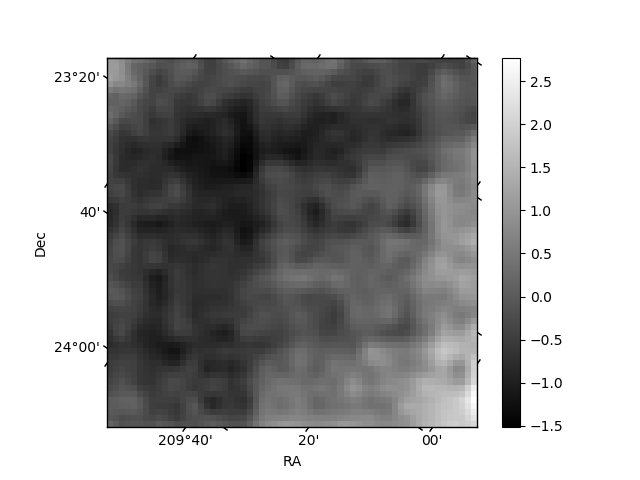
| Quadrant D | 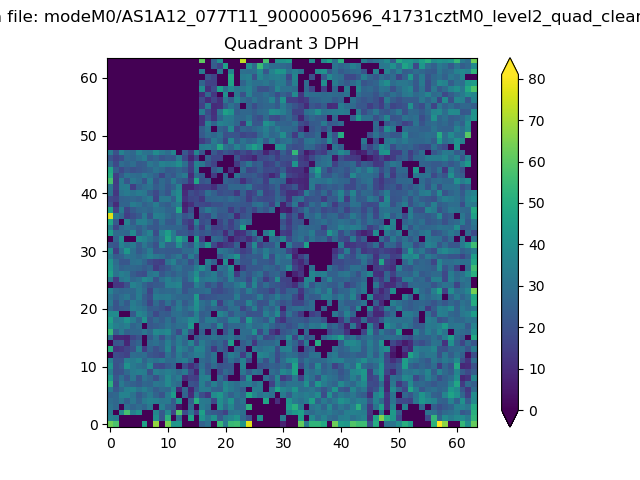 |
 |
Quadrant C |
| Plot type | Count rate plots | Images |
|---|---|---|
| Comparison with Poisson distribution Blue bars denote a histogram of data divided into 1 sec bins. Red curve is a Poisson curve with rate = median count rate of data. |
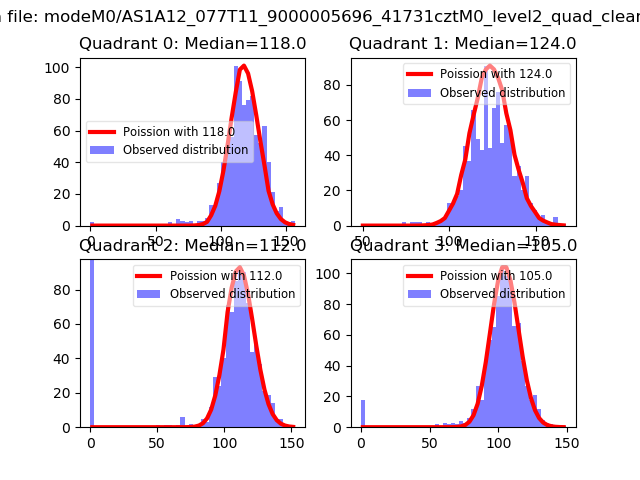 |
 |
| Quadrant-wise count rates Data is divided into 100 sec bins |
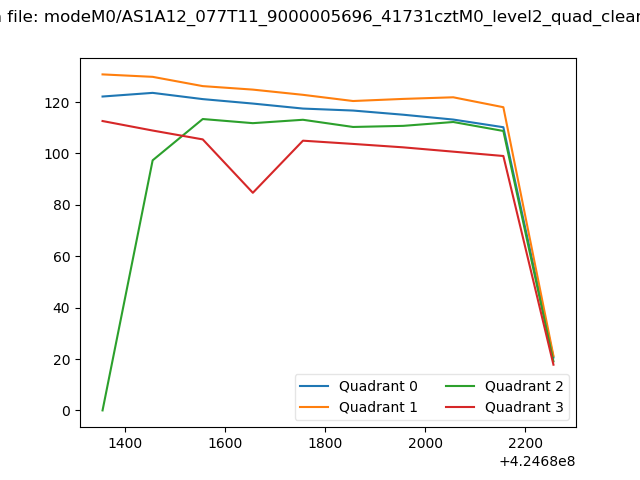 |
|
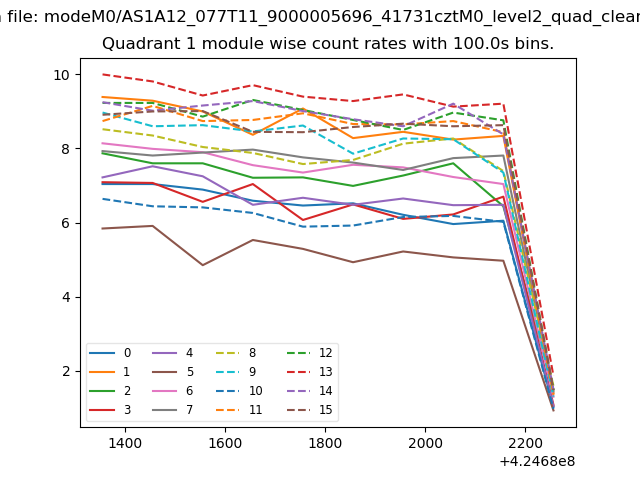
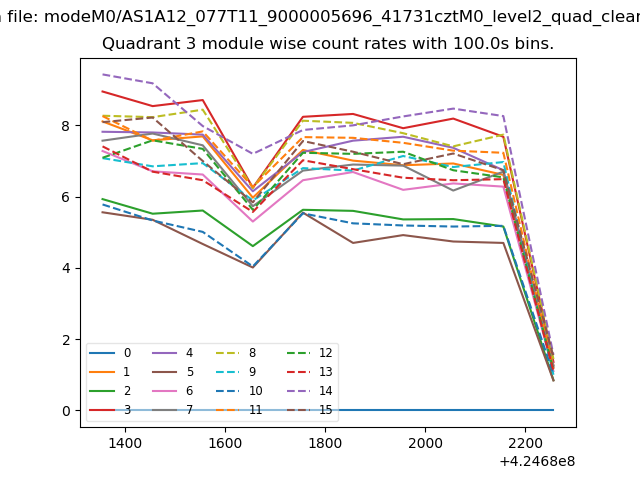
| Module-wise count rates for Quadrant A Data is divided into 100 sec bins |
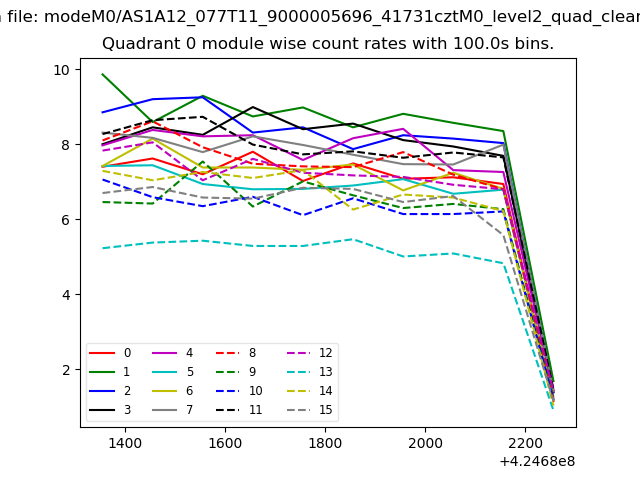 |
 |
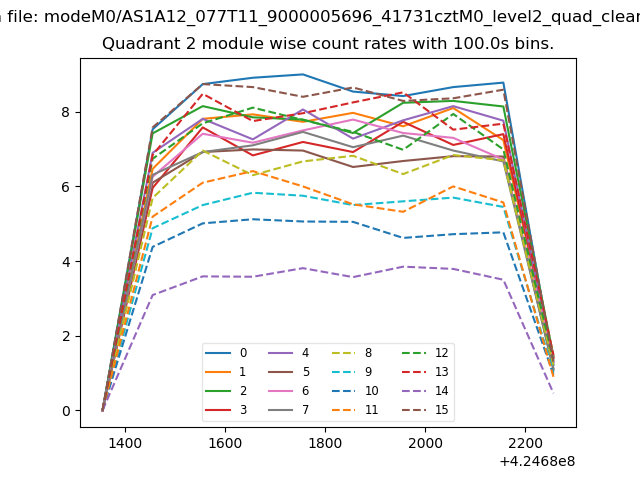
| Module-wise count rates for Quadrant B Data is divided into 100 sec bins |
 |
 |
| Module-wise count rates for Quadrant C Data is divided into 100 sec bins |
 |
 |
| Module-wise count rates for Quadrant D Data is divided into 100 sec bins |
 |
 |
| Parameter | Plot |
|---|---|
| CZT HV Monitor | 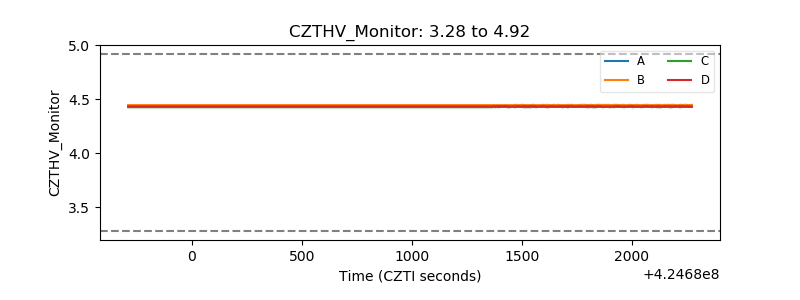 |
| D_VDD | 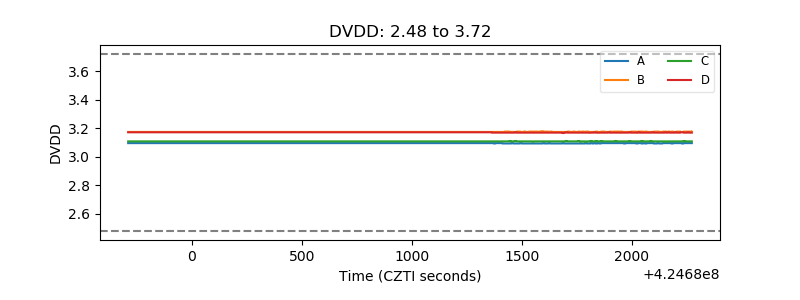 |
| Temperature 1 | 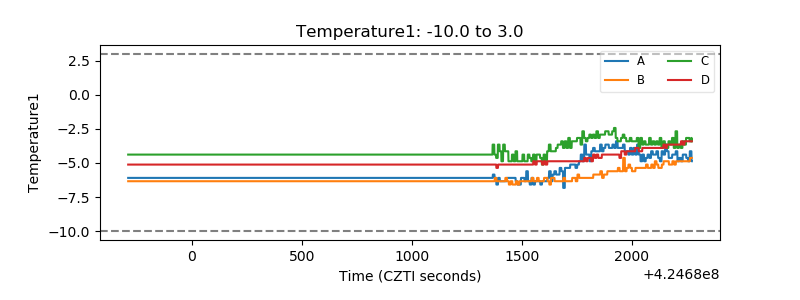 |
| Veto HV Monitor | 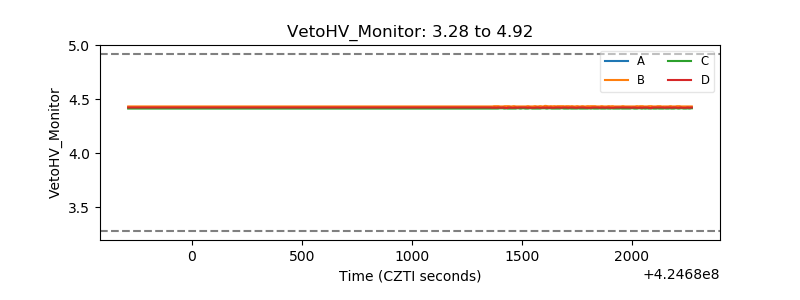 |
| Veto LLD | 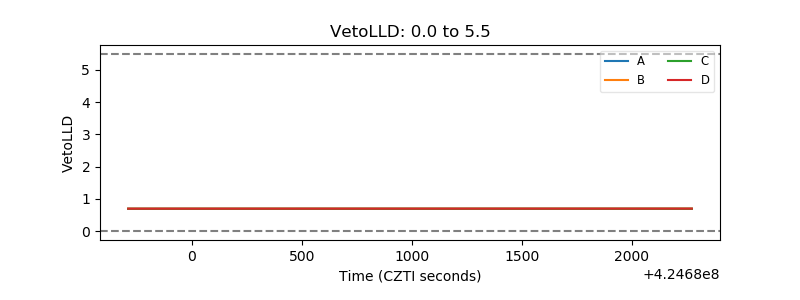 |
| Alpha Counter | 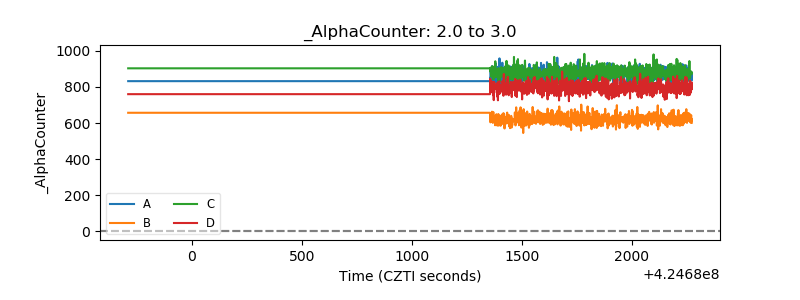 |
| _CPM_Rate | 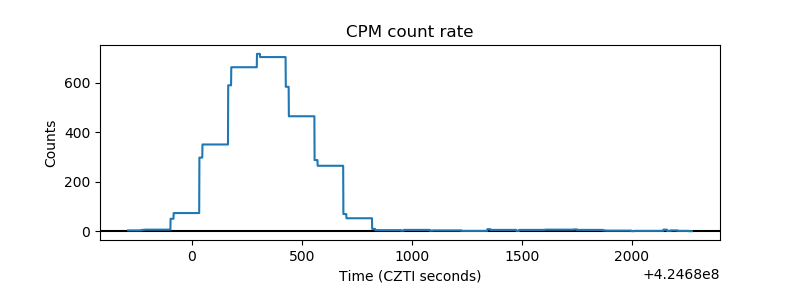 |
| CZT Counter | 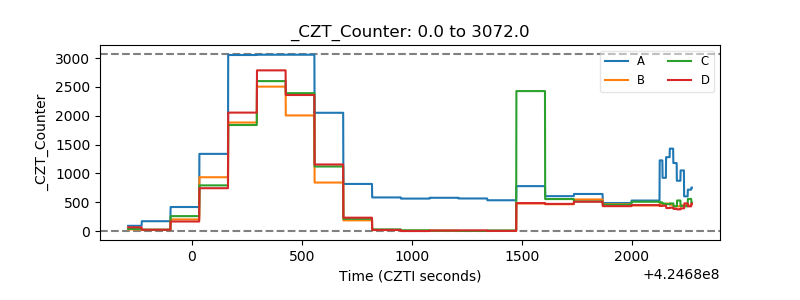 |
| +2.5 Volts monitor | 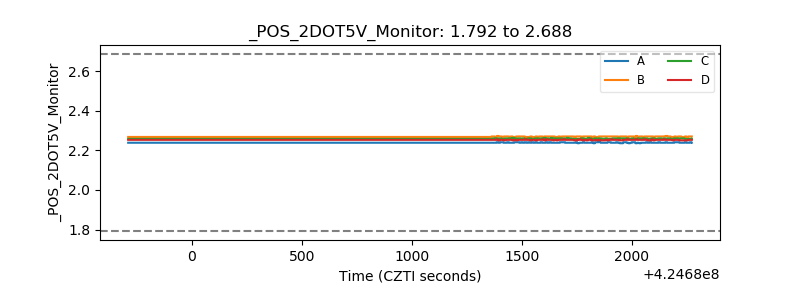 |
| +5 Volts monitor | 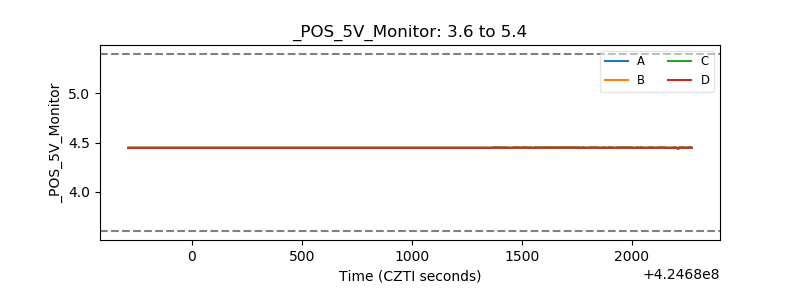 |
| _ROLL_ROT | 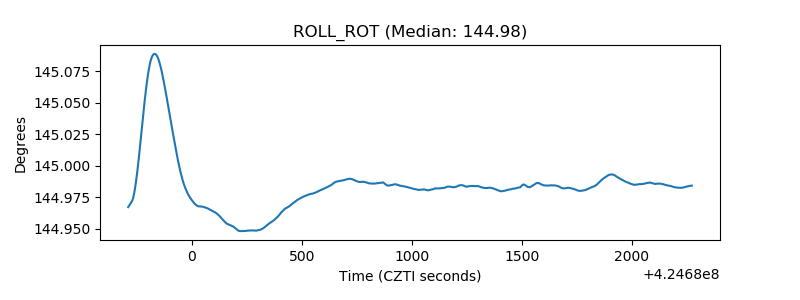 |
| _Roll_DEC | 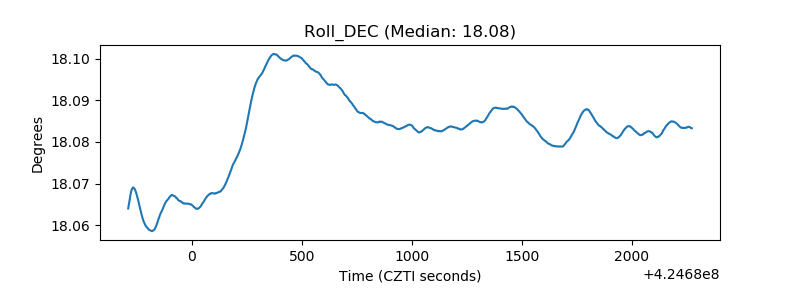 |
| _Roll_RA | 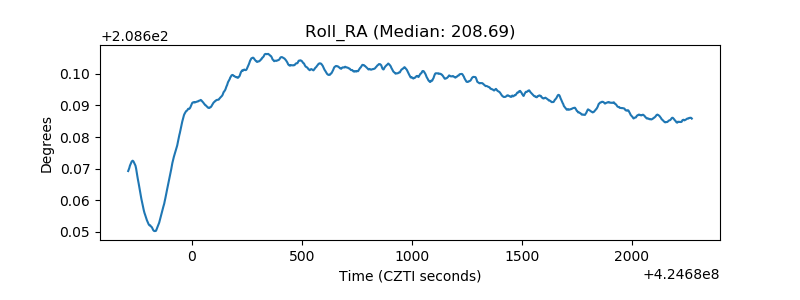 |
| Veto Counter | 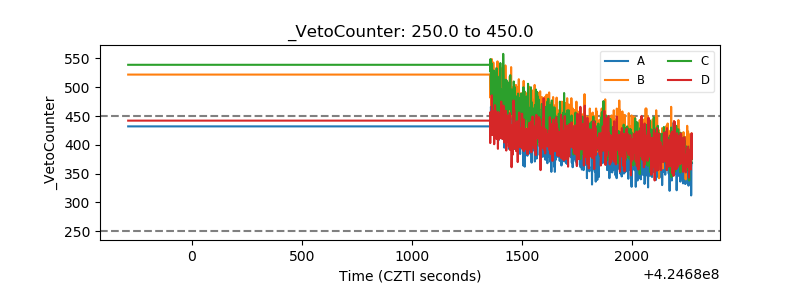 |