| Param | Original file | Final file |
|---|---|---|
| Filename | modeM0/AS1A12_077T11_9000005696_41733cztM0_level2.fits | modeM0/AS1A12_077T11_9000005696_41733cztM0_level2_quad_clean.evt |
| Size (bytes) | 371,122,560 | 89,663,040 |
| Size | 353.9 MB | 85.5 MB |
| Events in quadrant A | 3,150,359 | 621,142 |
| Events in quadrant B | 2,610,970 | 641,984 |
| Events in quadrant C | 3,212,402 | 569,416 |
| Events in quadrant D | 4,352,162 | 512,211 |
| Mode M9 | |||
|---|---|---|---|
| Quadrant | BADHDUFLAG | Total packets | Discarded packets |
| A | 0 | 29 | 0 |
| B | 0 | 29 | 0 |
| C | 0 | 30 | 0 |
| D | 0 | 30 | 0 |
| Mode M0 | |||
|---|---|---|---|
| Quadrant | BADHDUFLAG | Total packets | Discarded packets |
| A | 0 | 12486 | 2 |
| B | 0 | 11137 | 2 |
| C | 0 | 12593 | 2 |
| D | 0 | 16525 | 2 |
| Mode SS | |||
|---|---|---|---|
| Quadrant | BADHDUFLAG | Total packets | Discarded packets |
| A | 0 | 106 | 0 |
| B | 0 | 106 | 0 |
| C | 0 | 106 | 0 |
| D | 0 | 106 | 0 |
| Quadrant | Total seconds | Saturated seconds | Saturation percentage |
|---|---|---|---|
| A | 5292 | 25 | 0.472411% |
| B | 5292 | 11 | 0.207861% |
| C | 5292 | 228 | 4.308390% |
| D | 5292 | 464 | 8.767952% |
Noise dominated data is calculated using 1-second bins in cleaned event files. If a bin has >2000 counts, and if more than 50% of those come from <1% of pixels, then it is considered to be noise-dominated and hence unusable.
| Quadrant | # 1 sec bins | Bins with >0 counts | Bins with >2000 counts | High rate bins dominated by noise | Noise dominated (total time) | Noise dominated (detector-on time) | Marked lightcurve |
|---|---|---|---|---|---|---|---|
| A | 7145 | 5293 | 4 | 4 | 0.06% | 0.08% | 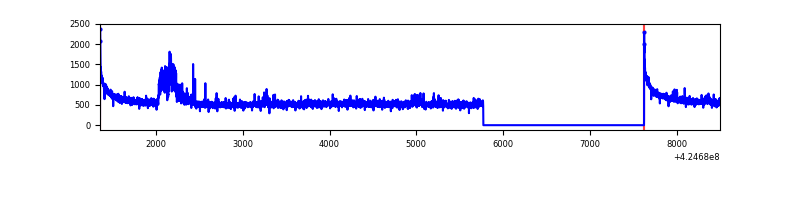 |
| B | 7144 | 5292 | 0 | 0 | 0.00% | 0.00% | 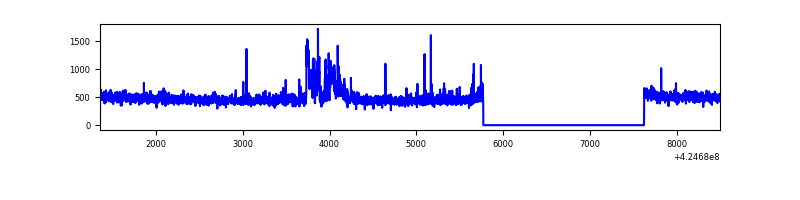 |
| C | 7145 | 5293 | 217 | 217 | 3.04% | 4.10% | 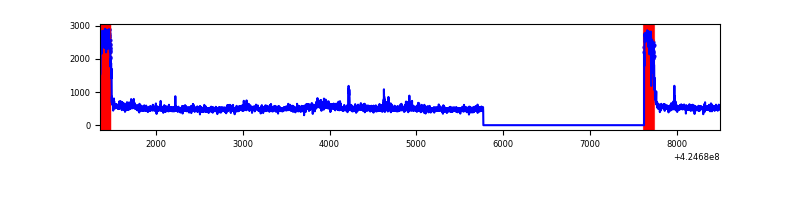 |
| D | 7144 | 5292 | 453 | 453 | 6.34% | 8.56% | 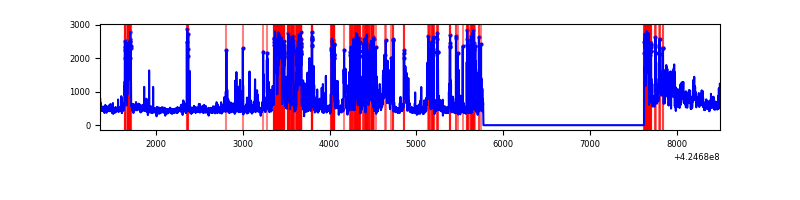 |
Top three noisy pixels from each quadrant. If the there are fewer than three noisy pixels in the level2.evt file, extra rows are filled as -1
| Pixel properties | Quadrant properties | ||||||
|---|---|---|---|---|---|---|---|
| Quadrant | DetID | PixID | Counts | Sigma | Mean | Median | Sigma |
| A | 10 | 83 | 552024 | 4338.17 | 618 | 607 | 127.1 |
| A | 15 | 223 | 164257 | 1287.49 | 618 | 607 | 127.1 |
| A | 3 | 1 | 30028 | 231.46 | 618 | 607 | 127.1 |
| B | 0 | 186 | 151509 | 1271.86 | 611 | 595 | 118.7 |
| B | 0 | 183 | 21824 | 178.91 | 611 | 595 | 118.7 |
| B | 0 | 245 | 19121 | 156.13 | 611 | 595 | 118.7 |
| C | 0 | 10 | 700359 | 5167.48 | 576 | 580 | 135.4 |
| C | 15 | 214 | 210558 | 1550.57 | 576 | 580 | 135.4 |
| C | 3 | 233 | 37476 | 272.46 | 576 | 580 | 135.4 |
| D | 2 | 249 | 901642 | 6409.2 | 575 | 558 | 140.6 |
| D | 13 | 249 | 603490 | 4288.52 | 575 | 558 | 140.6 |
| D | 12 | 79 | 382476 | 2716.49 | 575 | 558 | 140.6 |
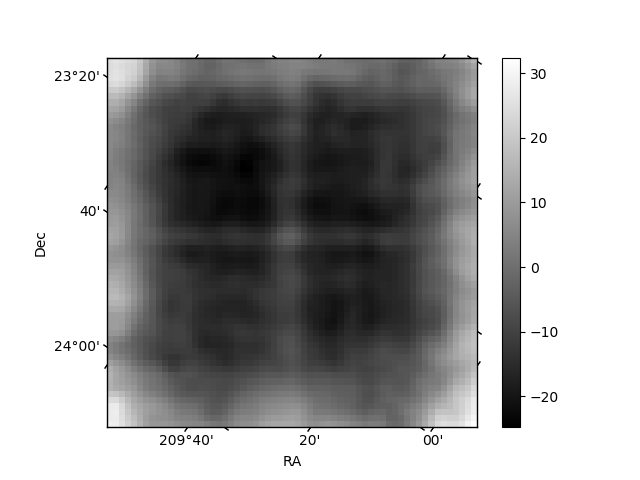
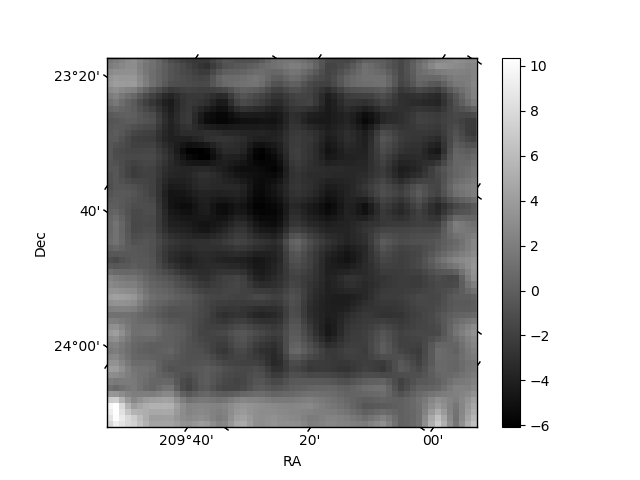
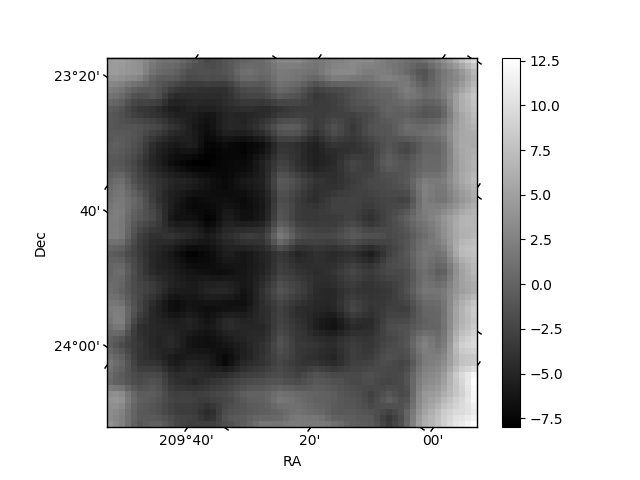
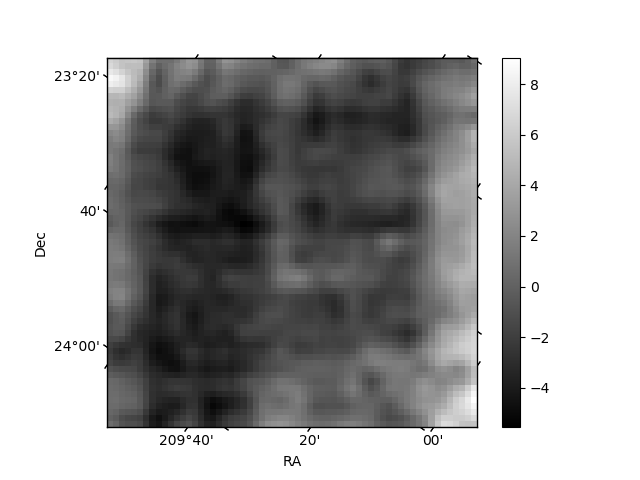
Histogram calculated using DETX and DETY for each event in the final _common_clean file
| Quadrant A | 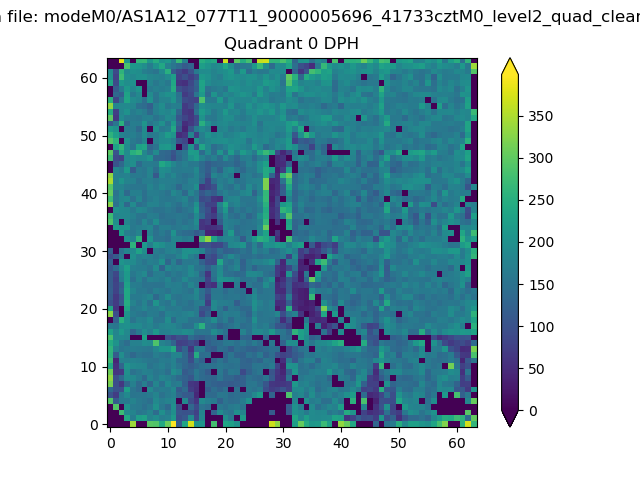 |
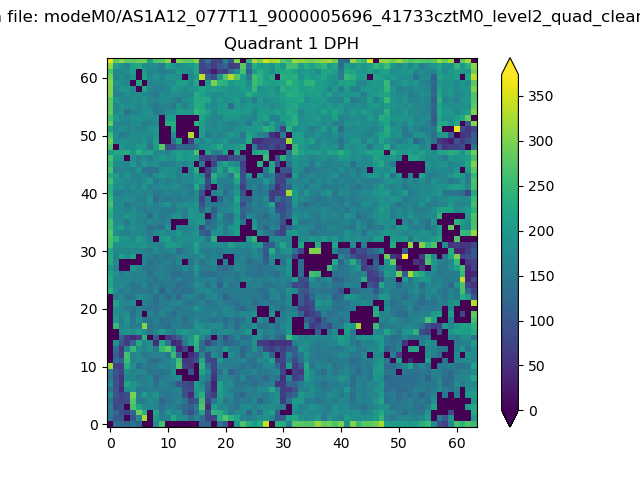 |
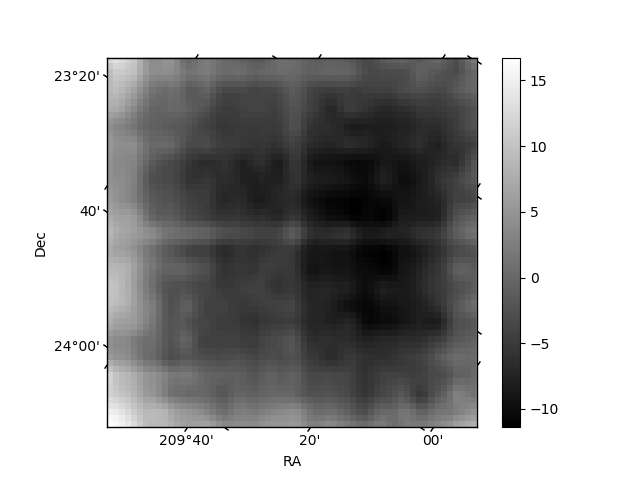
Quadrant B |
|---|---|---|---|
| Quadrant D | 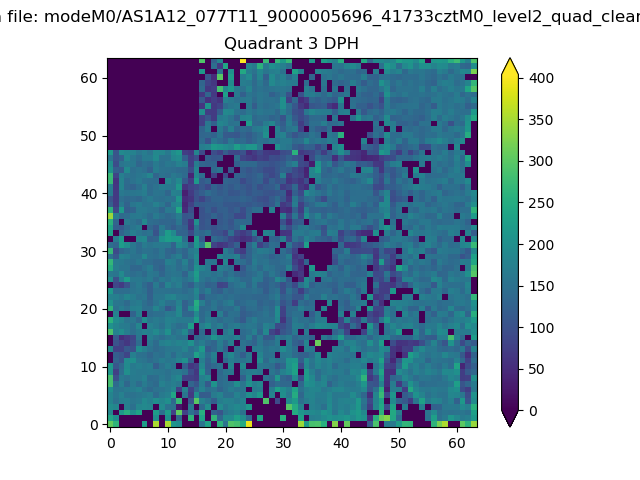 |
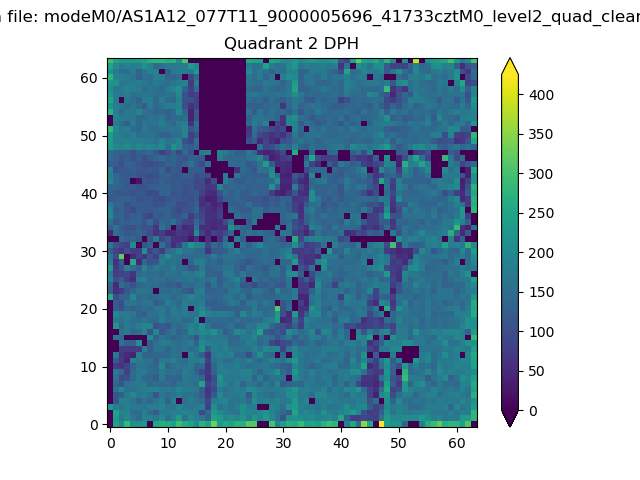 |
Quadrant C |
| Plot type | Count rate plots | Images |
|---|---|---|
| Comparison with Poisson distribution Blue bars denote a histogram of data divided into 1 sec bins. Red curve is a Poisson curve with rate = median count rate of data. |
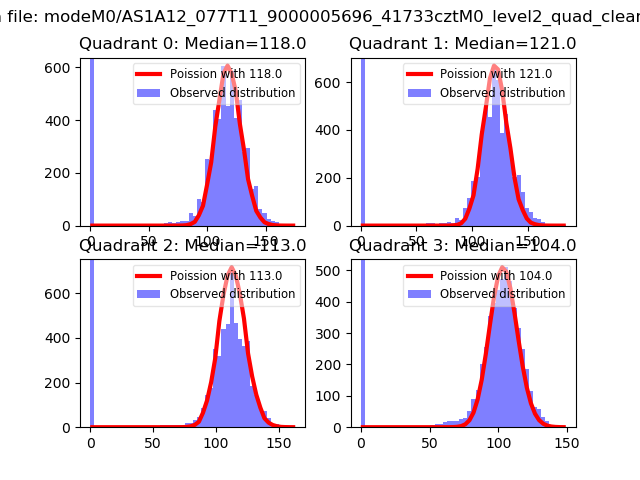 |
 |
| Quadrant-wise count rates Data is divided into 100 sec bins |
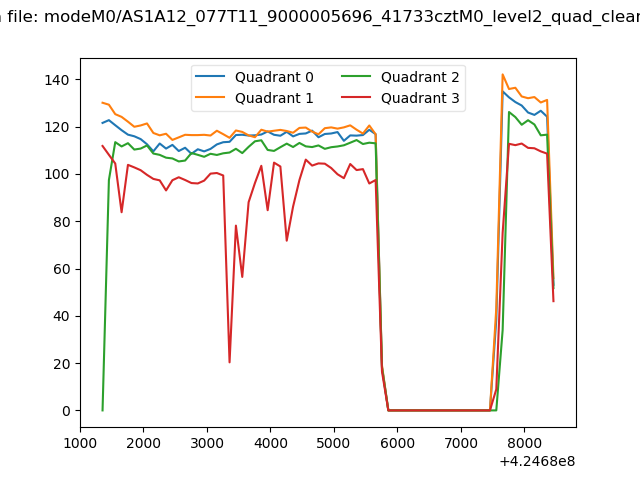 |
|
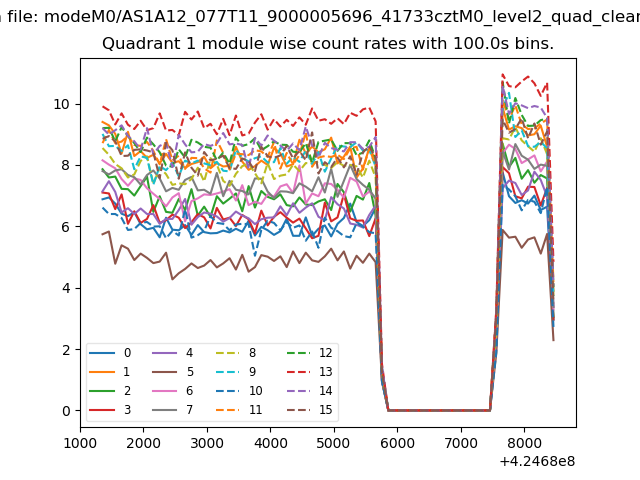
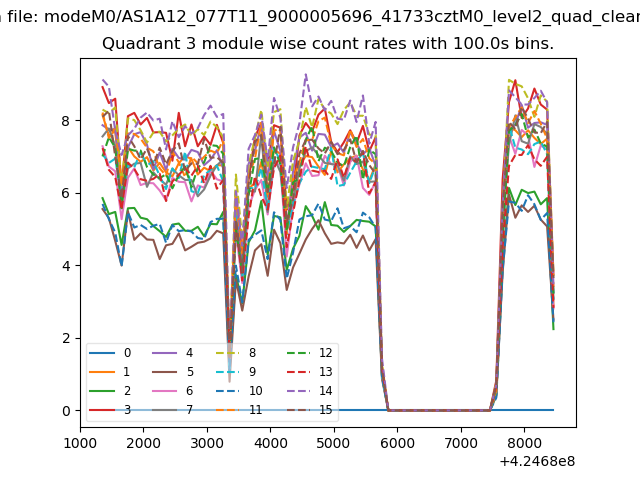
| Module-wise count rates for Quadrant A Data is divided into 100 sec bins |
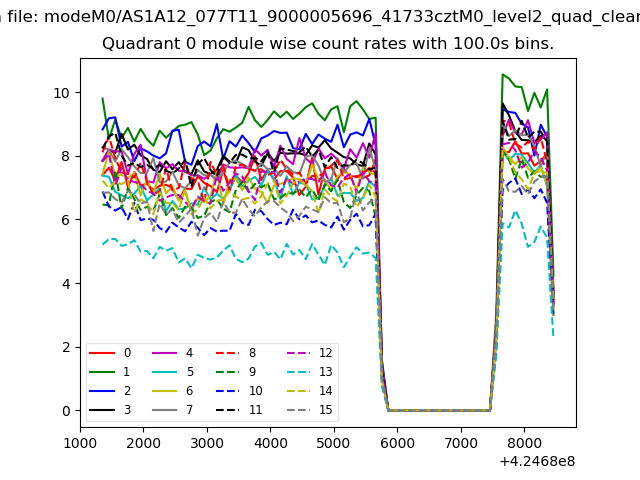 |
 |
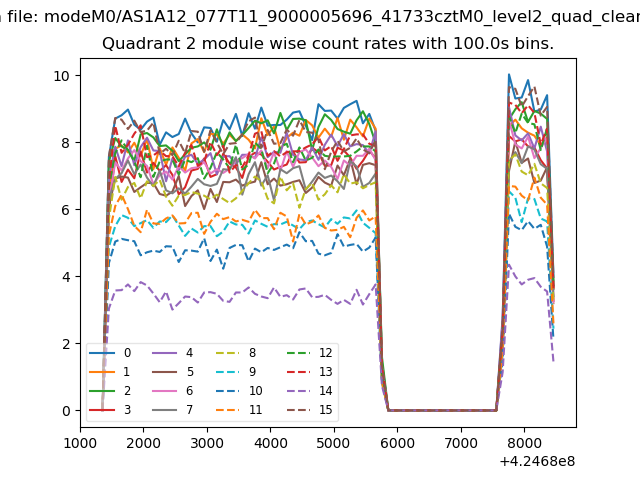
| Module-wise count rates for Quadrant B Data is divided into 100 sec bins |
 |
 |
| Module-wise count rates for Quadrant C Data is divided into 100 sec bins |
 |
 |
| Module-wise count rates for Quadrant D Data is divided into 100 sec bins |
 |
 |
| Parameter | Plot |
|---|---|
| CZT HV Monitor | 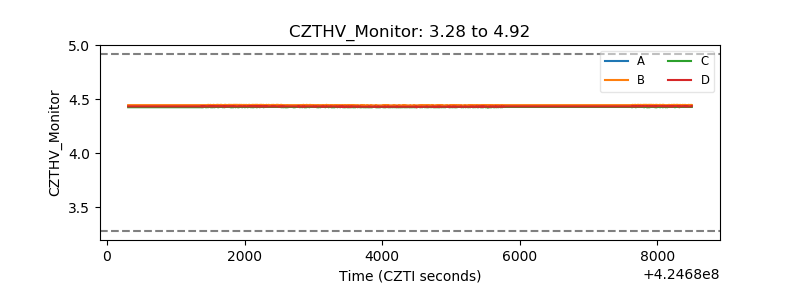 |
| D_VDD | 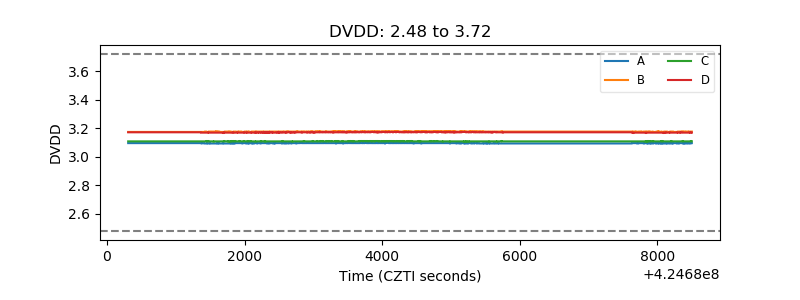 |
| Temperature 1 | 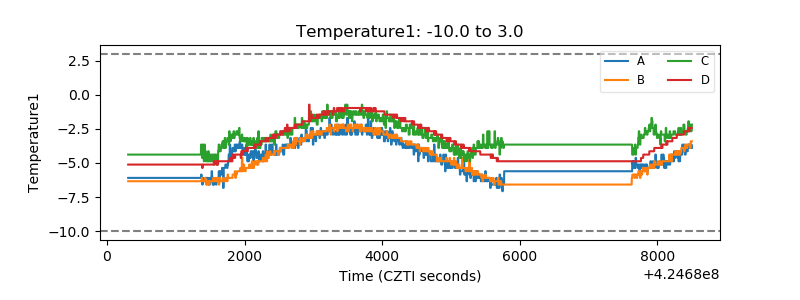 |
| Veto HV Monitor | 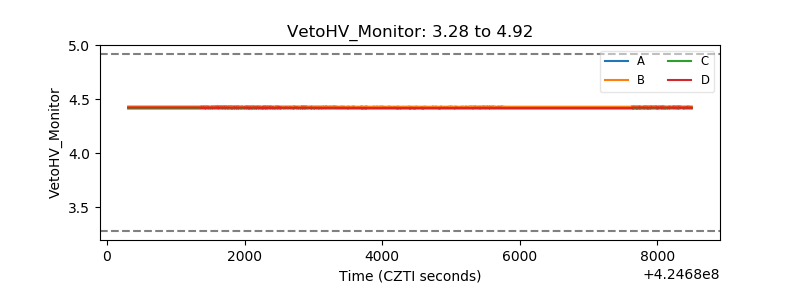 |
| Veto LLD | 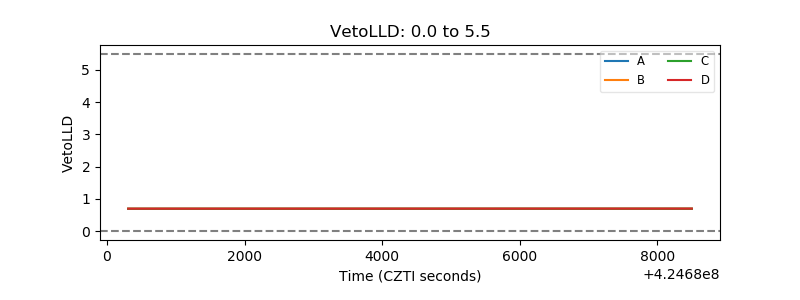 |
| Alpha Counter | 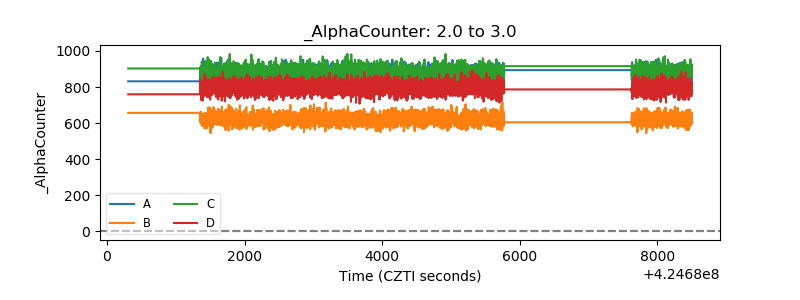 |
| _CPM_Rate | 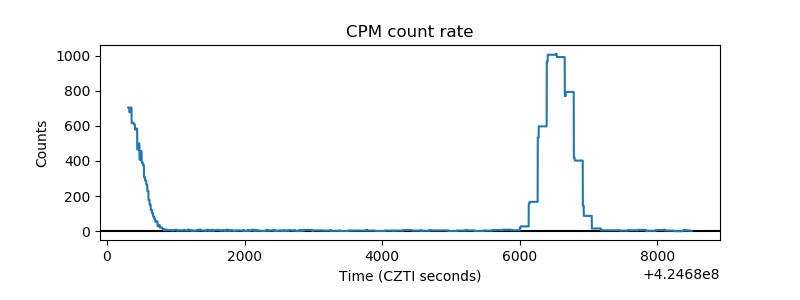 |
| CZT Counter | 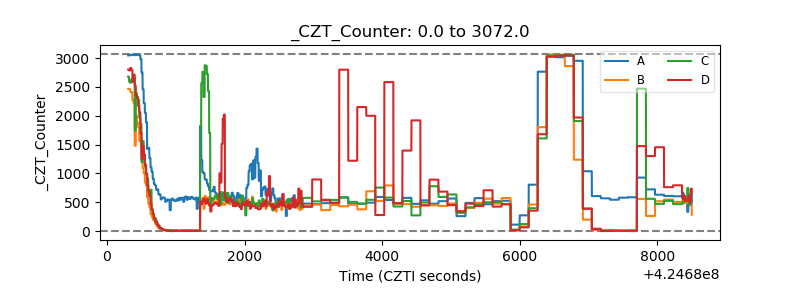 |
| +2.5 Volts monitor | 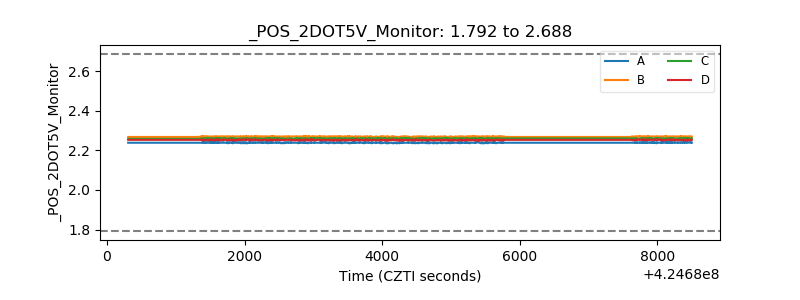 |
| +5 Volts monitor | 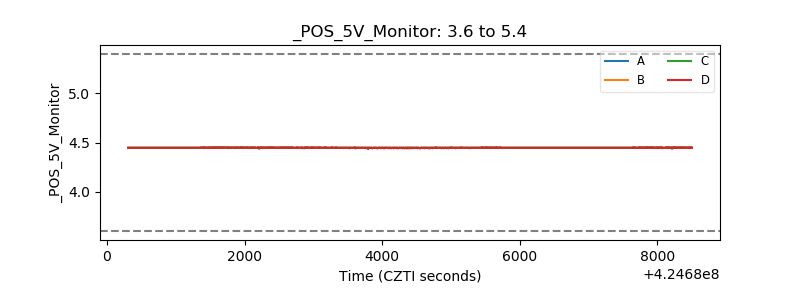 |
| _ROLL_ROT | 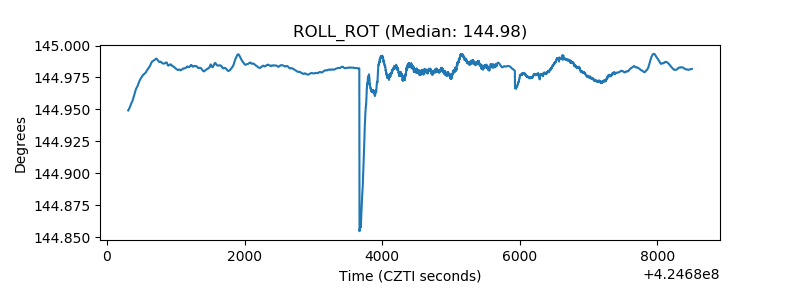 |
| _Roll_DEC | 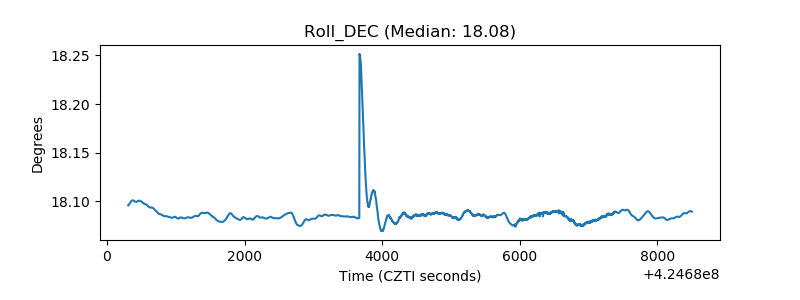 |
| _Roll_RA | 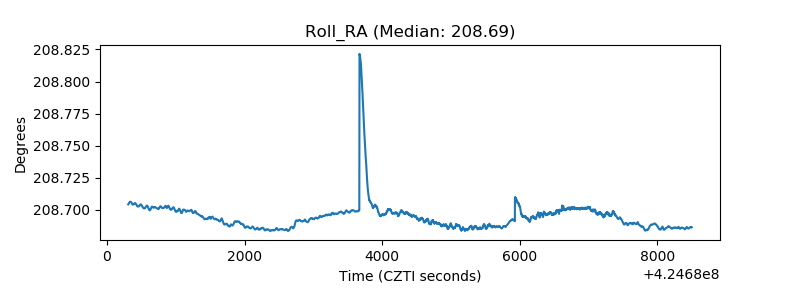 |
| Veto Counter | 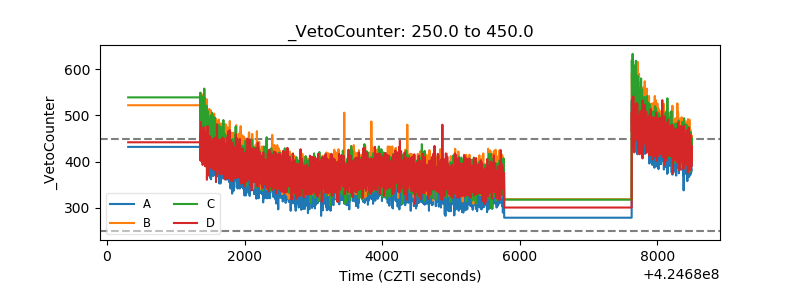 |