| Param | Original file | Final file |
|---|---|---|
| Filename | modeM0/AS1A12_077T11_9000005696_41734cztM0_level2.fits | modeM0/AS1A12_077T11_9000005696_41734cztM0_level2_quad_clean.evt |
| Size (bytes) | 381,104,640 | 90,907,200 |
| Size | 363.4 MB | 86.7 MB |
| Events in quadrant A | 2,997,294 | 636,206 |
| Events in quadrant B | 2,554,107 | 649,311 |
| Events in quadrant C | 3,451,936 | 572,756 |
| Events in quadrant D | 4,706,934 | 537,146 |
| Mode M9 | |||
|---|---|---|---|
| Quadrant | BADHDUFLAG | Total packets | Discarded packets |
| A | 0 | 29 | 0 |
| B | 0 | 30 | 0 |
| C | 0 | 30 | 0 |
| D | 0 | 30 | 0 |
| Mode M0 | |||
|---|---|---|---|
| Quadrant | BADHDUFLAG | Total packets | Discarded packets |
| A | 0 | 11899 | 2 |
| B | 0 | 10723 | 2 |
| C | 0 | 13250 | 2 |
| D | 0 | 17641 | 2 |
| Mode SS | |||
|---|---|---|---|
| Quadrant | BADHDUFLAG | Total packets | Discarded packets |
| A | 0 | 102 | 0 |
| B | 0 | 102 | 0 |
| C | 0 | 102 | 0 |
| D | 0 | 102 | 0 |
| Quadrant | Total seconds | Saturated seconds | Saturation percentage |
|---|---|---|---|
| A | 5109 | 14 | 0.274026% |
| B | 5109 | 19 | 0.371893% |
| C | 5109 | 264 | 5.167352% |
| D | 5109 | 267 | 5.226072% |
Noise dominated data is calculated using 1-second bins in cleaned event files. If a bin has >2000 counts, and if more than 50% of those come from <1% of pixels, then it is considered to be noise-dominated and hence unusable.
| Quadrant | # 1 sec bins | Bins with >0 counts | Bins with >2000 counts | High rate bins dominated by noise | Noise dominated (total time) | Noise dominated (detector-on time) | Marked lightcurve |
|---|---|---|---|---|---|---|---|
| A | 7081 | 5109 | 3 | 3 | 0.04% | 0.06% | 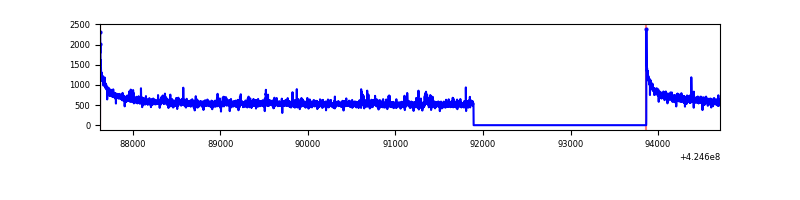 |
| B | 7081 | 5108 | 12 | 12 | 0.17% | 0.23% | 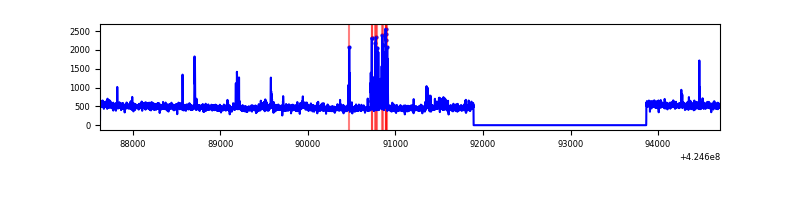 |
| C | 7081 | 5108 | 237 | 237 | 3.35% | 4.64% | 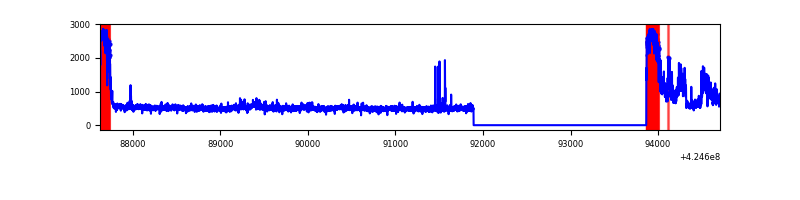 |
| D | 7081 | 5108 | 236 | 236 | 3.33% | 4.62% | 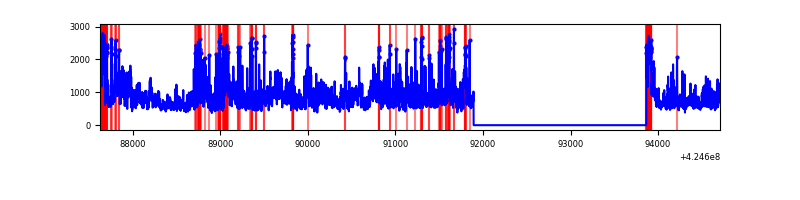 |
Top three noisy pixels from each quadrant. If the there are fewer than three noisy pixels in the level2.evt file, extra rows are filled as -1
| Pixel properties | Quadrant properties | ||||||
|---|---|---|---|---|---|---|---|
| Quadrant | DetID | PixID | Counts | Sigma | Mean | Median | Sigma |
| A | 10 | 83 | 532145 | 4213.62 | 616 | 605 | 126.1 |
| A | 3 | 1 | 38554 | 300.83 | 616 | 605 | 126.1 |
| A | 15 | 223 | 23781 | 183.72 | 616 | 605 | 126.1 |
| B | 15 | 32 | 85236 | 730.27 | 605 | 591 | 115.9 |
| B | 0 | 245 | 41601 | 353.81 | 605 | 591 | 115.9 |
| B | 0 | 186 | 26219 | 221.1 | 605 | 591 | 115.9 |
| C | 0 | 10 | 705517 | 5292.32 | 571 | 575 | 133.2 |
| C | 3 | 233 | 286772 | 2148.61 | 571 | 575 | 133.2 |
| C | 15 | 214 | 203984 | 1527.08 | 571 | 575 | 133.2 |
| D | 12 | 79 | 1547170 | 10864.94 | 583 | 567 | 142.3 |
| D | 13 | 249 | 529837 | 3718.14 | 583 | 567 | 142.3 |
| D | 2 | 249 | 214540 | 1503.17 | 583 | 567 | 142.3 |
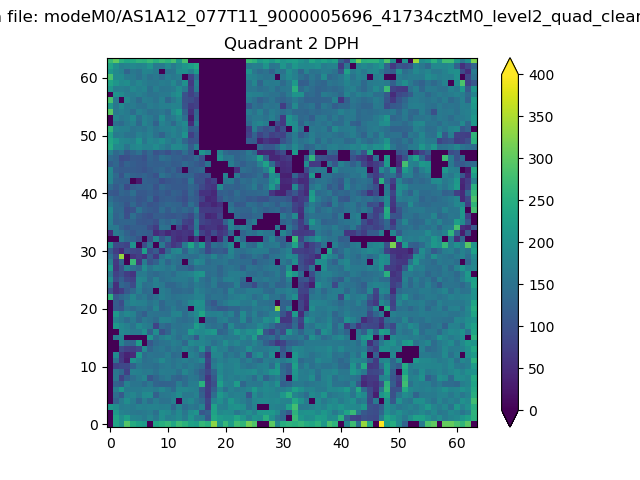
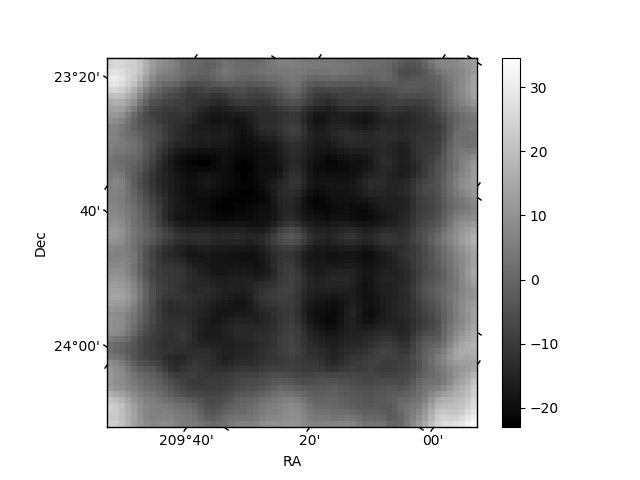
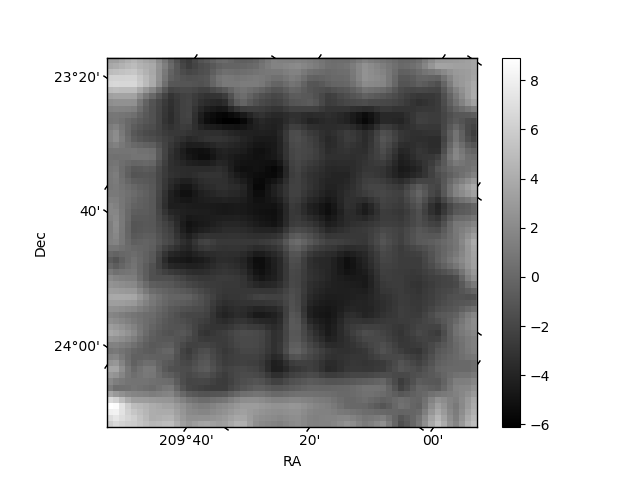
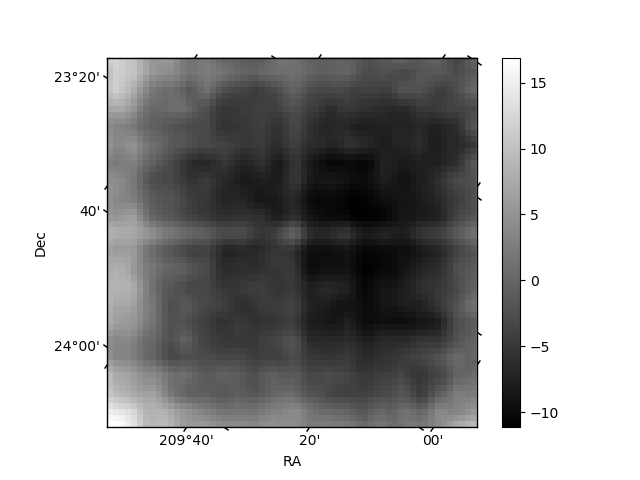
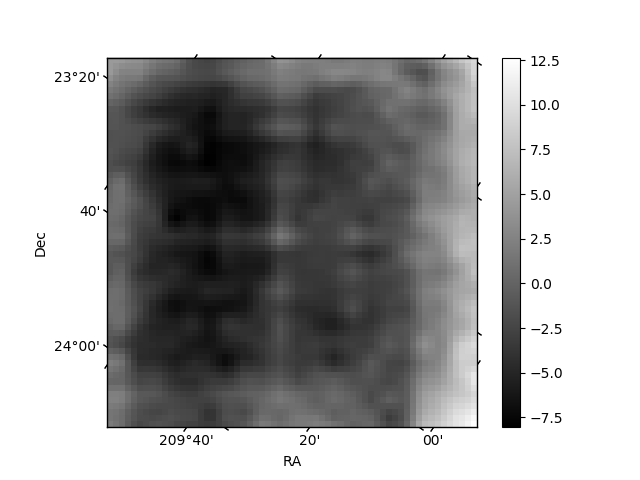
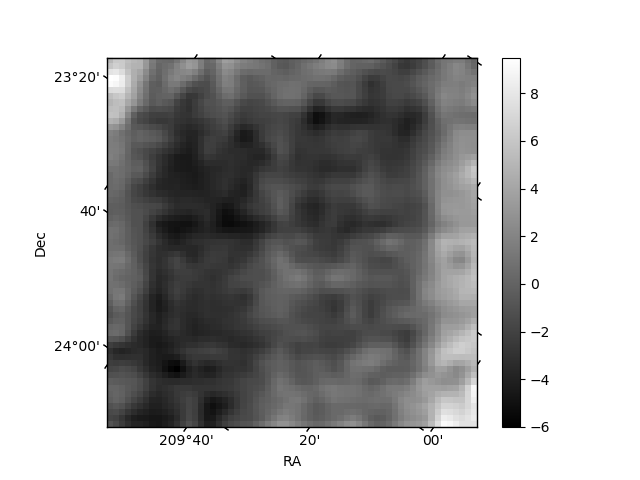
Histogram calculated using DETX and DETY for each event in the final _common_clean file
| Quadrant A | 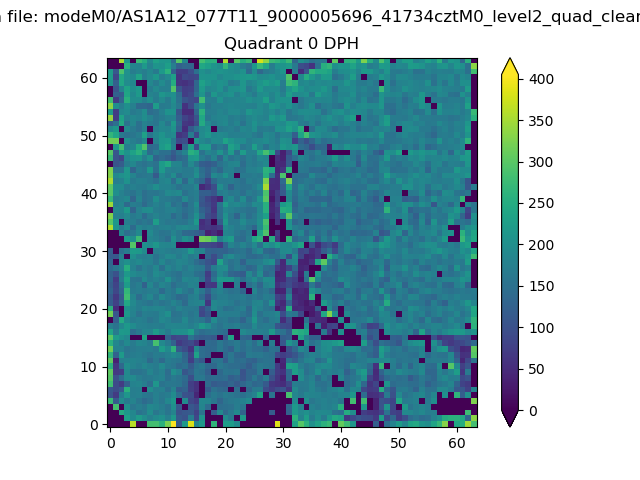 |
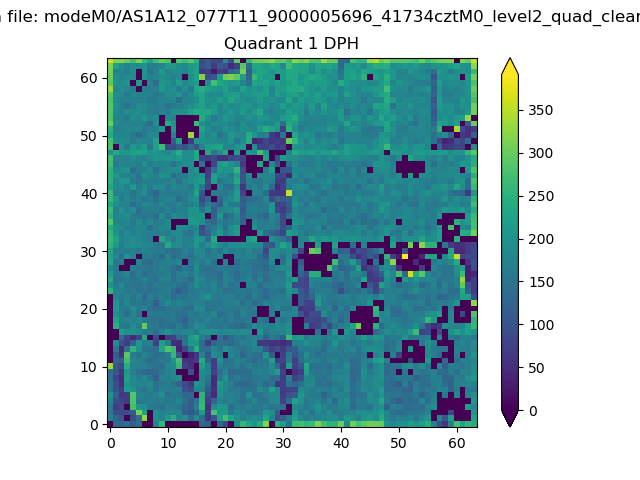 |
Quadrant B |
|---|---|---|---|
| Quadrant D | 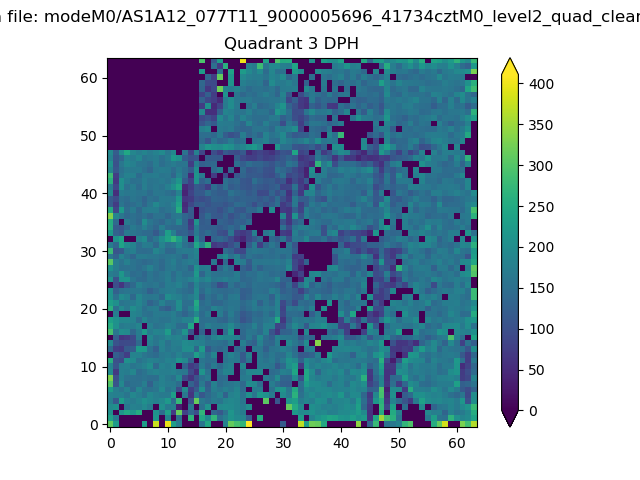 |
 |
Quadrant C |
| Plot type | Count rate plots | Images |
|---|---|---|
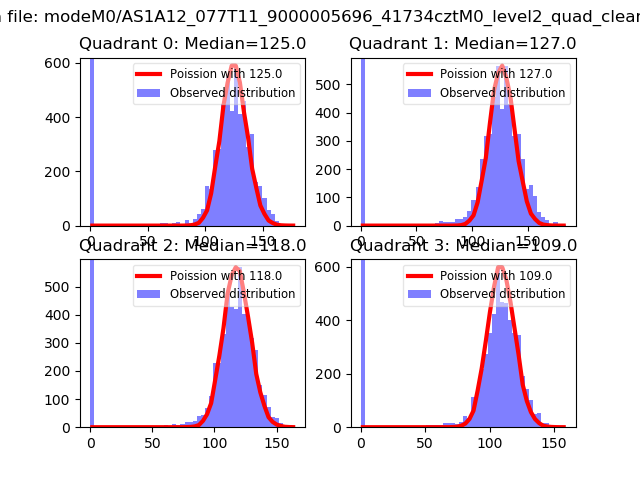
| Comparison with Poisson distribution Blue bars denote a histogram of data divided into 1 sec bins. Red curve is a Poisson curve with rate = median count rate of data. |
 |
 |
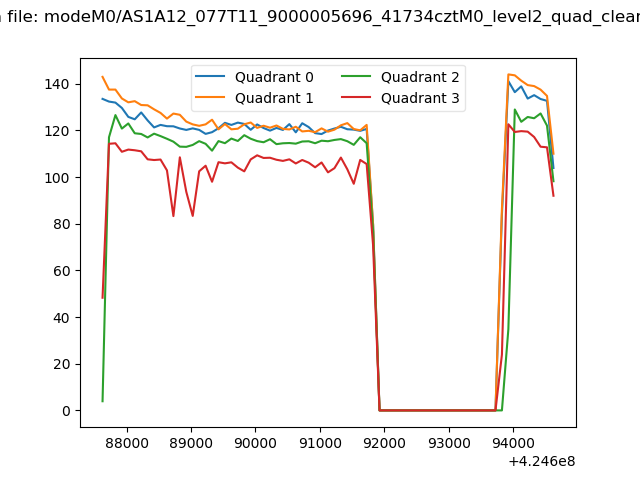
| Quadrant-wise count rates Data is divided into 100 sec bins |
 |
|
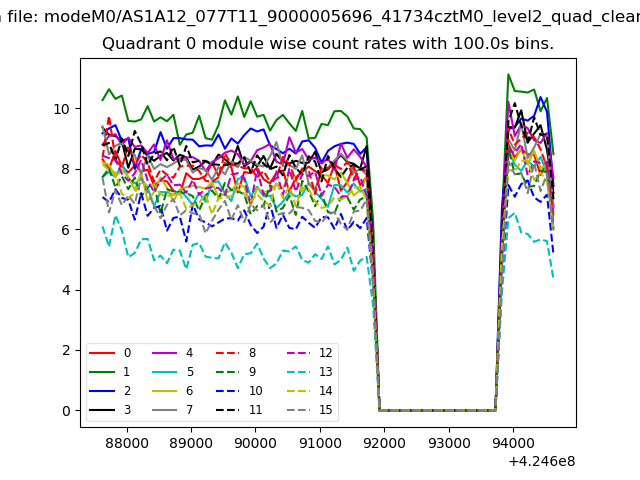
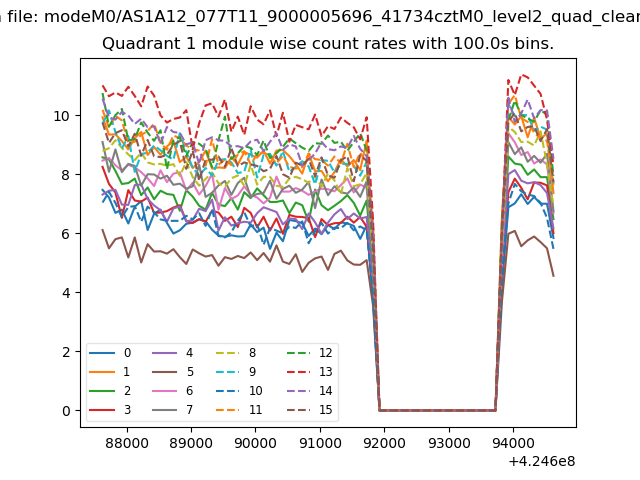
| Module-wise count rates for Quadrant A Data is divided into 100 sec bins |
 |
 |
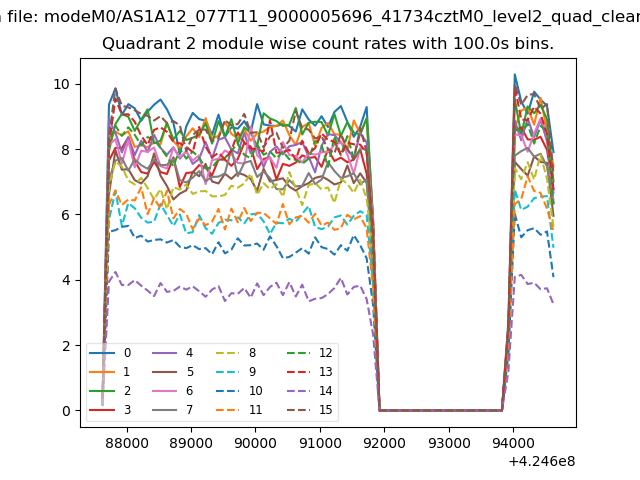
| Module-wise count rates for Quadrant B Data is divided into 100 sec bins |
 |
 |
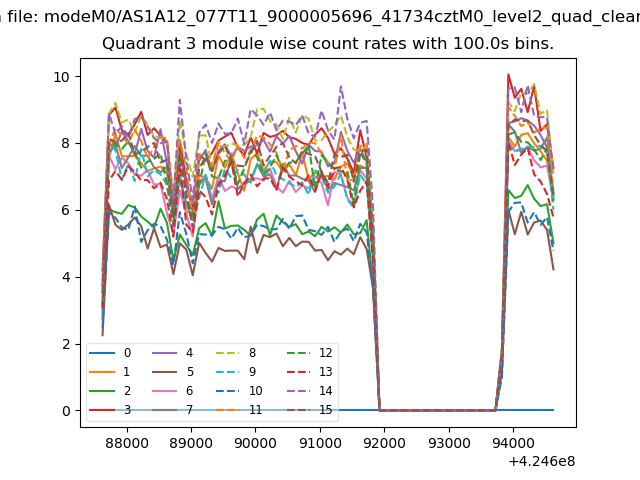
| Module-wise count rates for Quadrant C Data is divided into 100 sec bins |
 |
 |
| Module-wise count rates for Quadrant D Data is divided into 100 sec bins |
 |
 |
| Parameter | Plot |
|---|---|
| CZT HV Monitor | 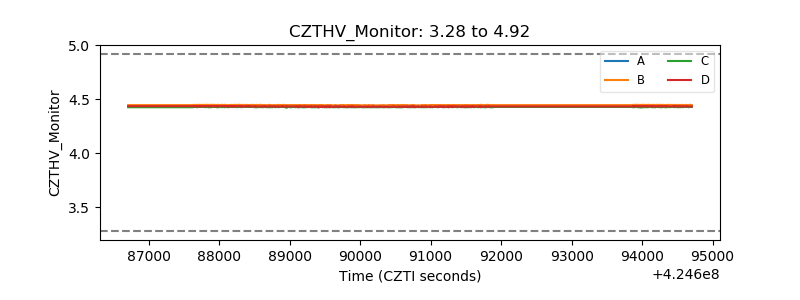 |
| D_VDD | 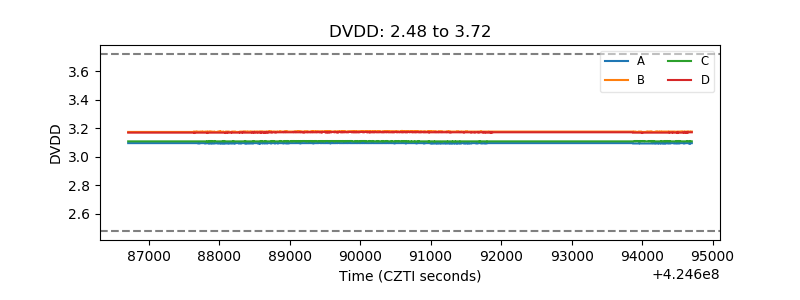 |
| Temperature 1 | 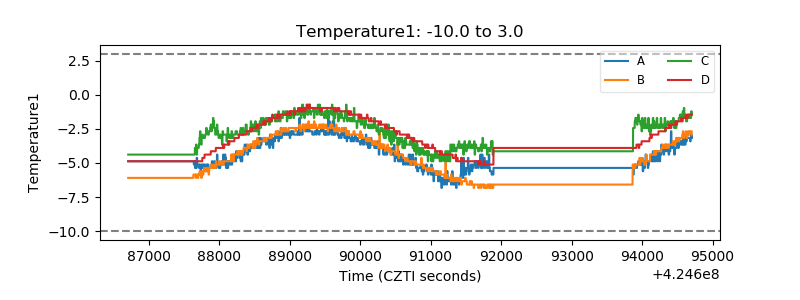 |
| Veto HV Monitor | 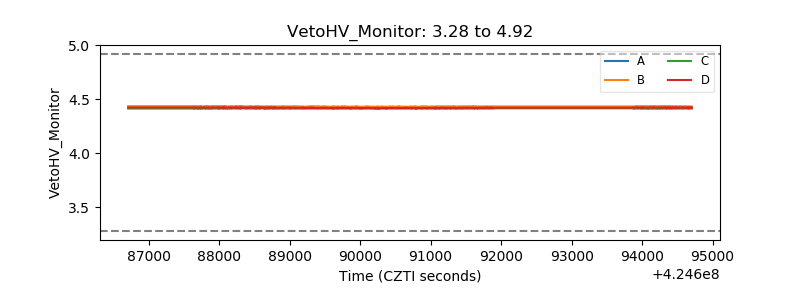 |
| Veto LLD | 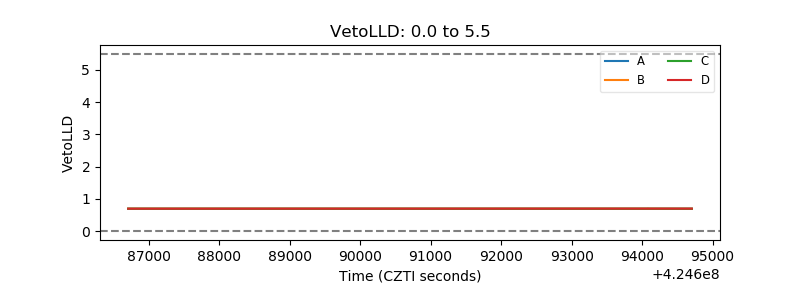 |
| Alpha Counter | 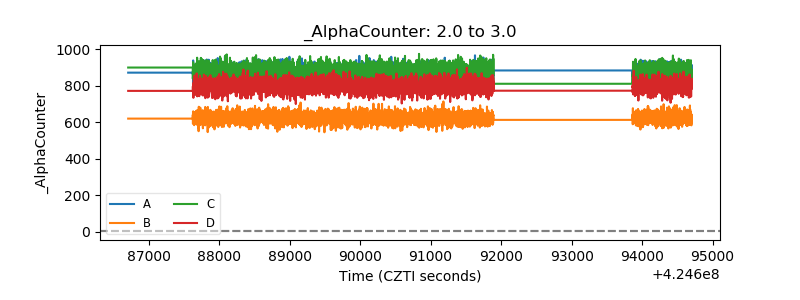 |
| _CPM_Rate | 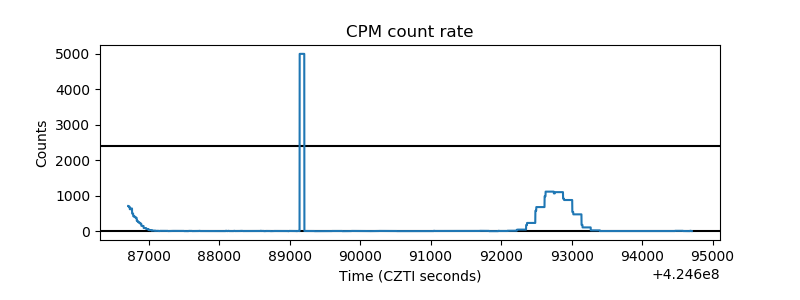 |
| CZT Counter | 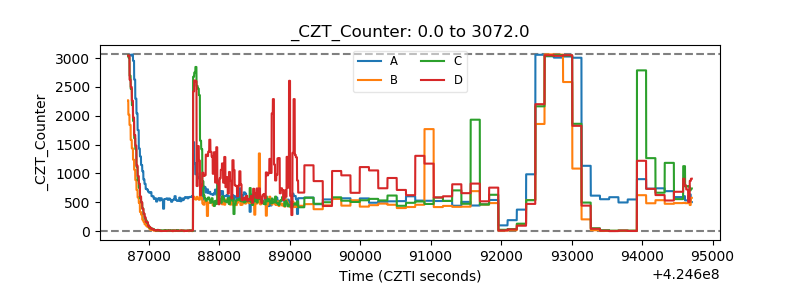 |
| +2.5 Volts monitor | 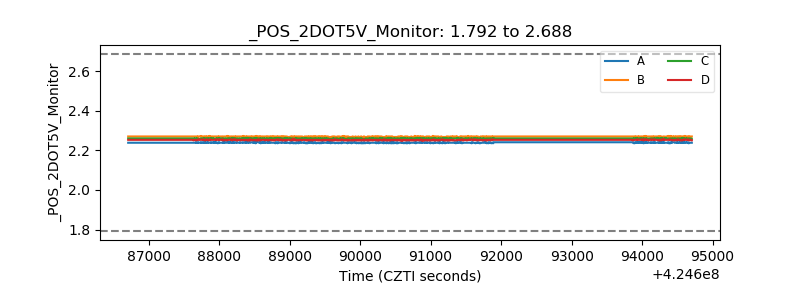 |
| +5 Volts monitor | 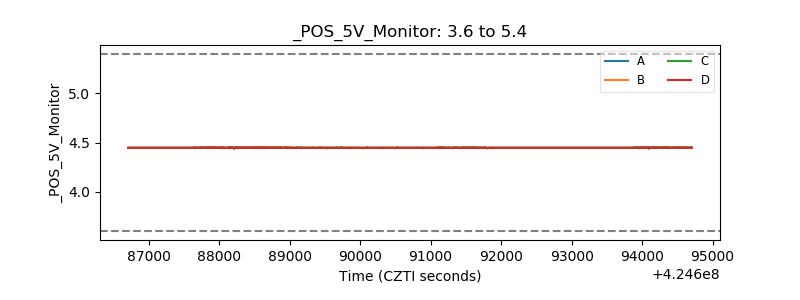 |
| _ROLL_ROT | 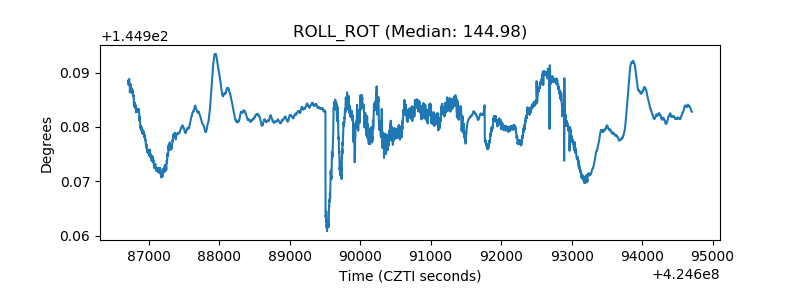 |
| _Roll_DEC | 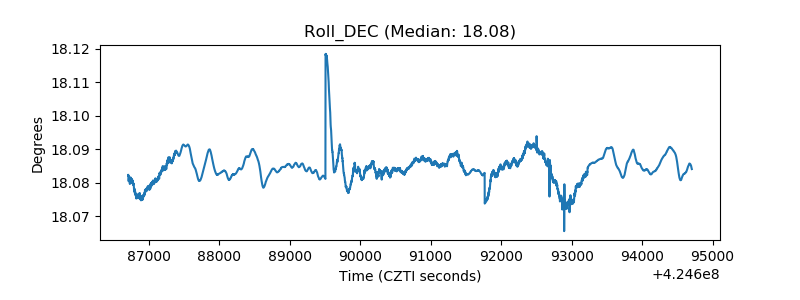 |
| _Roll_RA | 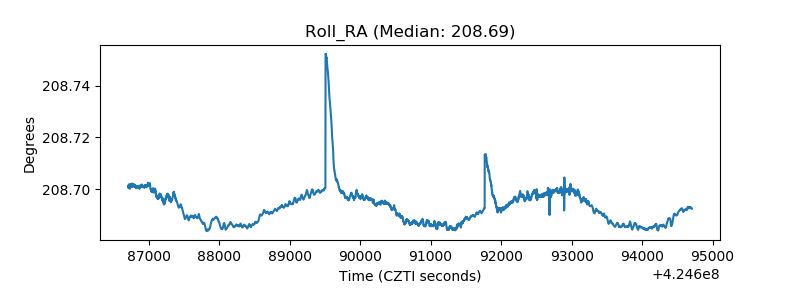 |
| Veto Counter | 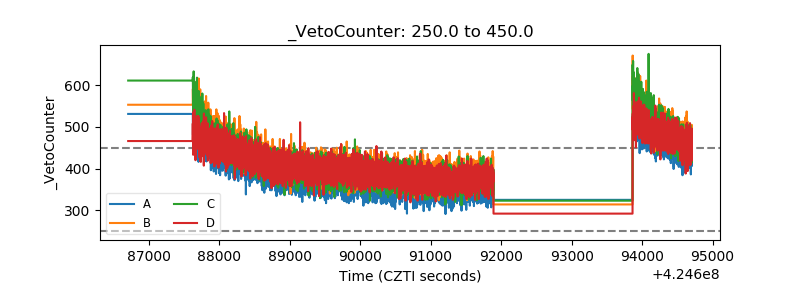 |