| Param | Original file | Final file |
|---|---|---|
| Filename | modeM0/AS1A12_077T11_9000005696_41735cztM0_level2.fits | modeM0/AS1A12_077T11_9000005696_41735cztM0_level2_quad_clean.evt |
| Size (bytes) | 516,945,600 | 94,855,680 |
| Size | 493.0 MB | 90.5 MB |
| Events in quadrant A | 3,959,977 | 663,671 |
| Events in quadrant B | 2,655,969 | 712,230 |
| Events in quadrant C | 4,632,425 | 607,083 |
| Events in quadrant D | 7,458,322 | 502,625 |
| Mode M9 | |||
|---|---|---|---|
| Quadrant | BADHDUFLAG | Total packets | Discarded packets |
| A | 0 | 41 | 0 |
| B | 0 | 41 | 0 |
| C | 0 | 41 | 0 |
| D | 0 | 41 | 0 |
| Mode M0 | |||
|---|---|---|---|
| Quadrant | BADHDUFLAG | Total packets | Discarded packets |
| A | 0 | 15110 | 2 |
| B | 0 | 11297 | 3 |
| C | 0 | 17233 | 2 |
| D | 0 | 26075 | 2 |
| Mode SS | |||
|---|---|---|---|
| Quadrant | BADHDUFLAG | Total packets | Discarded packets |
| A | 0 | 114 | 0 |
| B | 0 | 114 | 0 |
| C | 0 | 114 | 0 |
| D | 0 | 114 | 0 |
| Quadrant | Total seconds | Saturated seconds | Saturation percentage |
|---|---|---|---|
| A | 5528 | 321 | 5.806802% |
| B | 5527 | 10 | 0.180930% |
| C | 5528 | 540 | 9.768452% |
| D | 5528 | 1223 | 22.123734% |
Noise dominated data is calculated using 1-second bins in cleaned event files. If a bin has >2000 counts, and if more than 50% of those come from <1% of pixels, then it is considered to be noise-dominated and hence unusable.
| Quadrant | # 1 sec bins | Bins with >0 counts | Bins with >2000 counts | High rate bins dominated by noise | Noise dominated (total time) | Noise dominated (detector-on time) | Marked lightcurve |
|---|---|---|---|---|---|---|---|
| A | 9562 | 5528 | 308 | 308 | 3.22% | 5.57% | 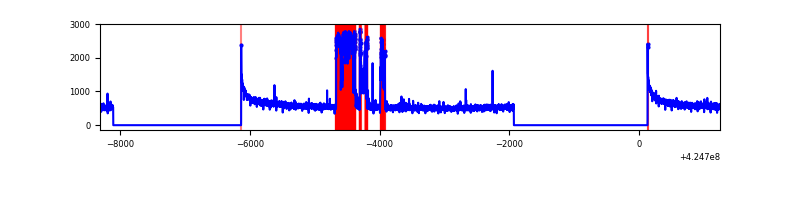 |
| B | 9561 | 5526 | 0 | 0 | 0.00% | 0.00% | 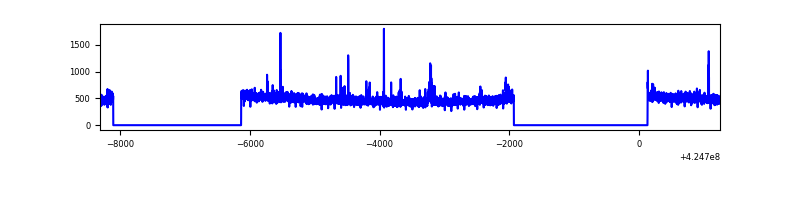 |
| C | 9562 | 5527 | 536 | 536 | 5.61% | 9.70% | 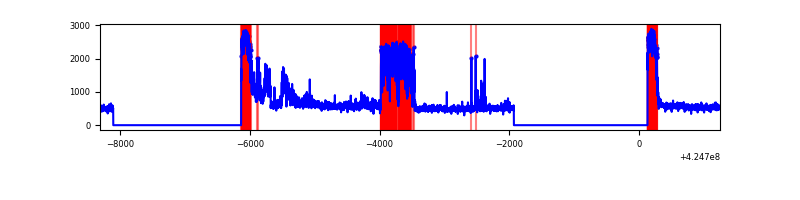 |
| D | 9562 | 5527 | 1205 | 1205 | 12.60% | 21.80% | 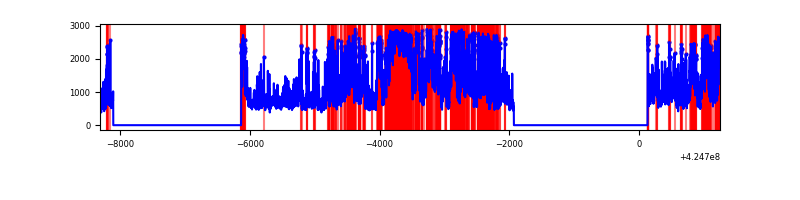 |
Top three noisy pixels from each quadrant. If the there are fewer than three noisy pixels in the level2.evt file, extra rows are filled as -1
| Pixel properties | Quadrant properties | ||||||
|---|---|---|---|---|---|---|---|
| Quadrant | DetID | PixID | Counts | Sigma | Mean | Median | Sigma |
| A | 15 | 223 | 864930 | 6514.61 | 653 | 641 | 132.7 |
| A | 10 | 83 | 547717 | 4123.61 | 653 | 641 | 132.7 |
| A | 3 | 1 | 11990 | 85.54 | 653 | 641 | 132.7 |
| B | 0 | 186 | 23461 | 180.94 | 657 | 640 | 126.1 |
| B | 15 | 32 | 17531 | 133.92 | 657 | 640 | 126.1 |
| B | 0 | 183 | 16125 | 122.77 | 657 | 640 | 126.1 |
| C | 3 | 233 | 1063560 | 7382.01 | 615 | 620 | 144.0 |
| C | 0 | 10 | 906684 | 6292.52 | 615 | 620 | 144.0 |
| C | 15 | 214 | 217772 | 1508.1 | 615 | 620 | 144.0 |
| D | 12 | 79 | 2727701 | 18928.81 | 589 | 574 | 144.1 |
| D | 13 | 249 | 1384086 | 9602.87 | 589 | 574 | 144.1 |
| D | 1 | 47 | 372751 | 2583.26 | 589 | 574 | 144.1 |
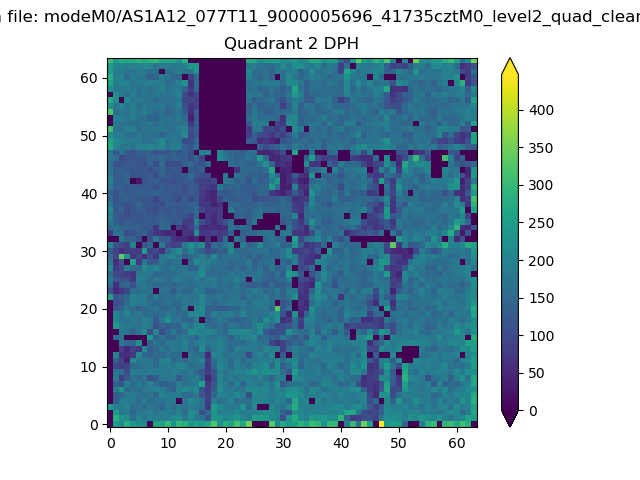
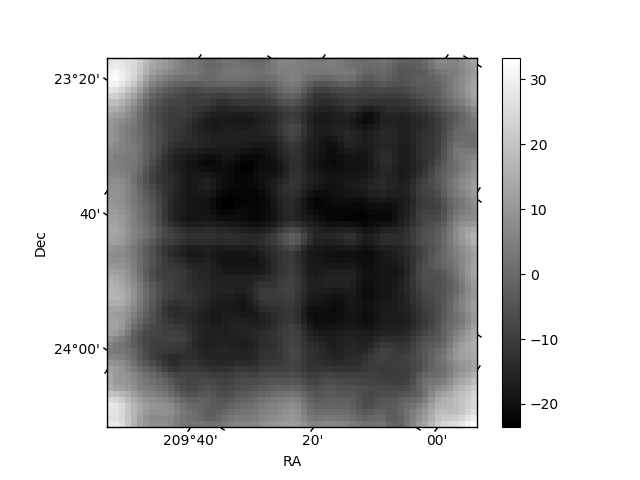
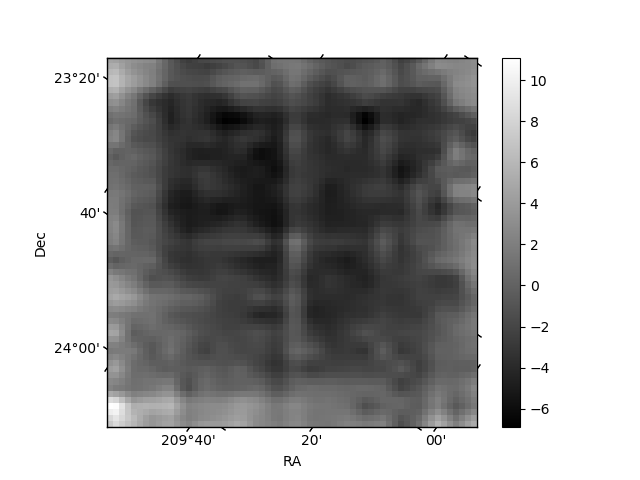
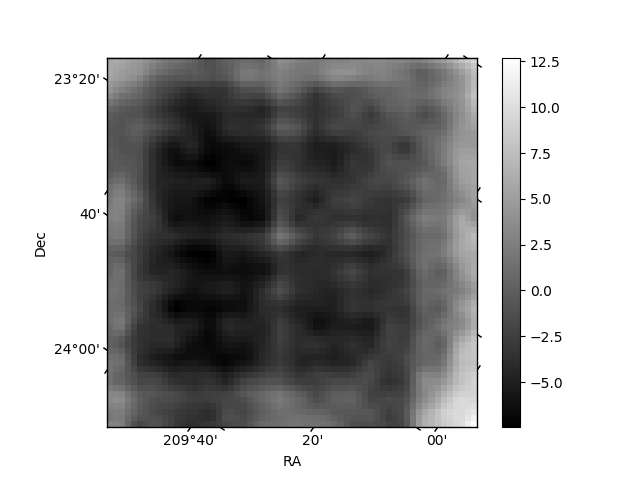
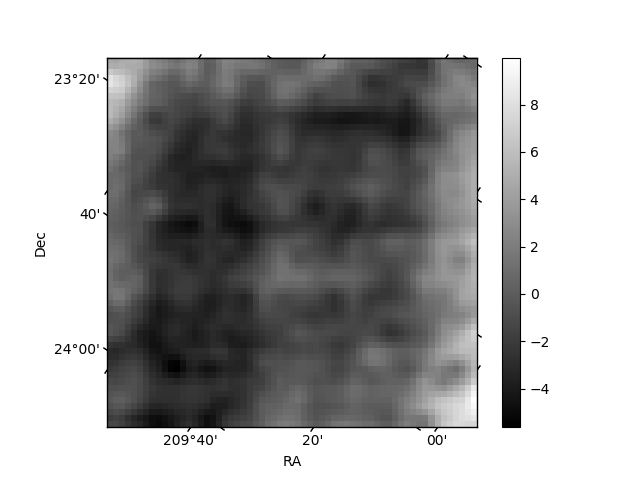
Histogram calculated using DETX and DETY for each event in the final _common_clean file
| Quadrant A | 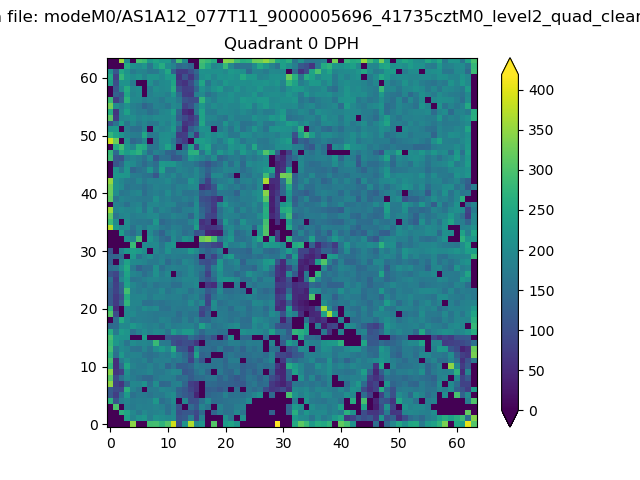 |
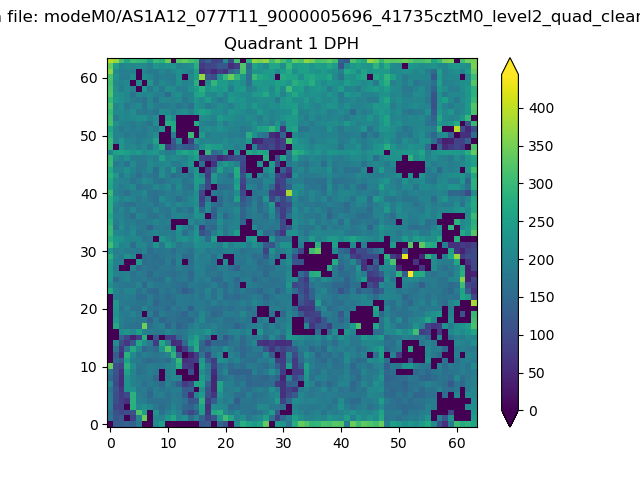 |
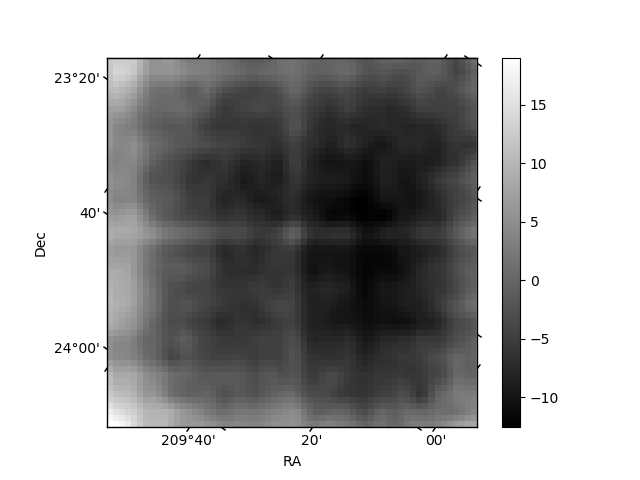
Quadrant B |
|---|---|---|---|
| Quadrant D | 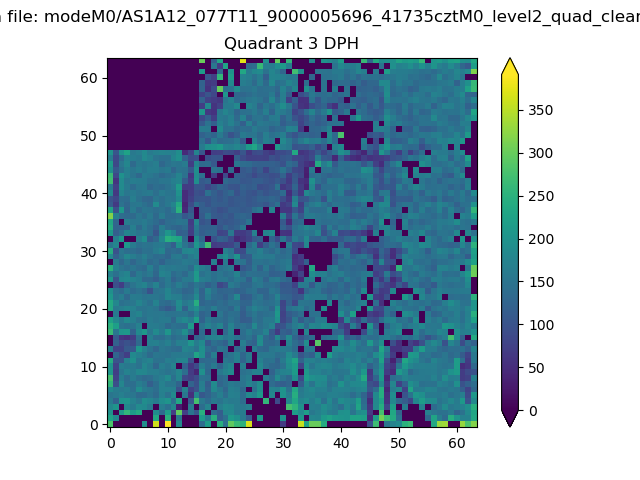 |
 |
Quadrant C |
| Plot type | Count rate plots | Images |
|---|---|---|
| Comparison with Poisson distribution Blue bars denote a histogram of data divided into 1 sec bins. Red curve is a Poisson curve with rate = median count rate of data. |
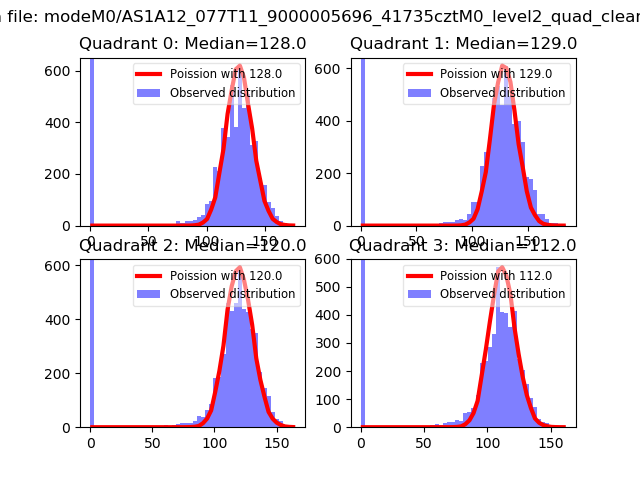 |
 |
| Quadrant-wise count rates Data is divided into 100 sec bins |
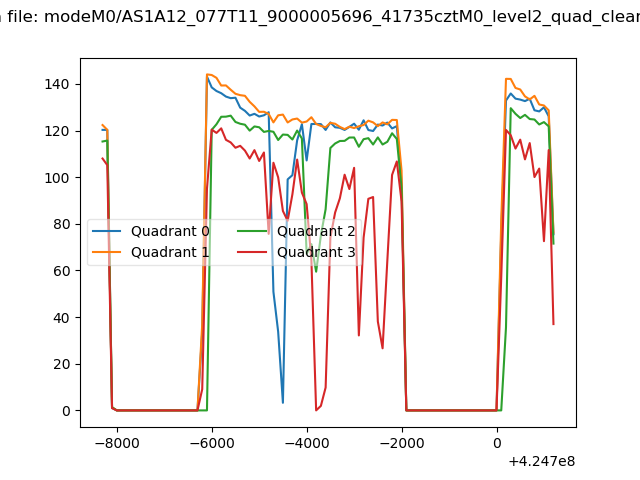 |
|
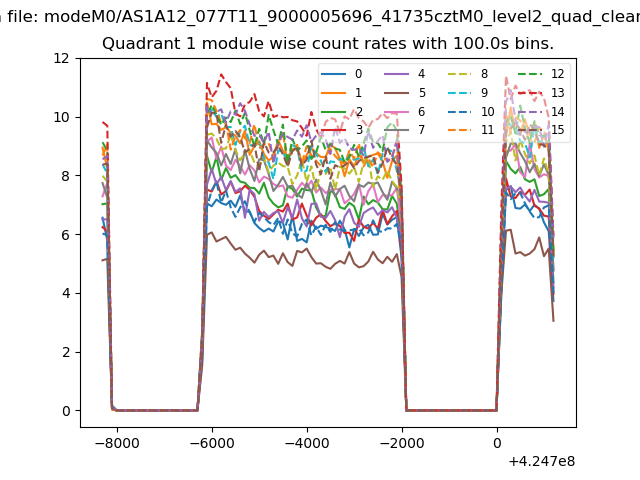
| Module-wise count rates for Quadrant A Data is divided into 100 sec bins |
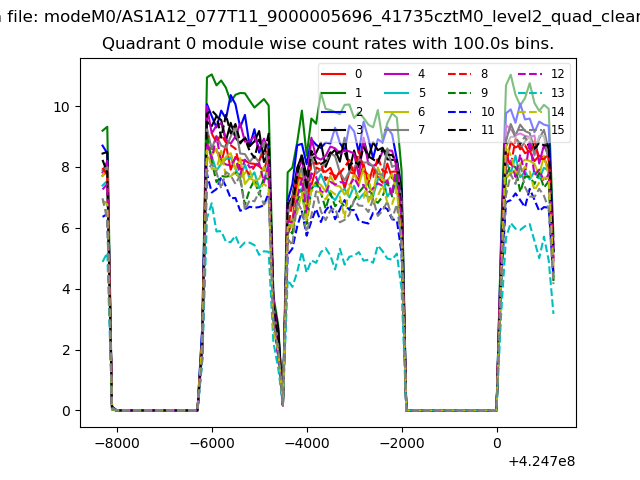 |
 |
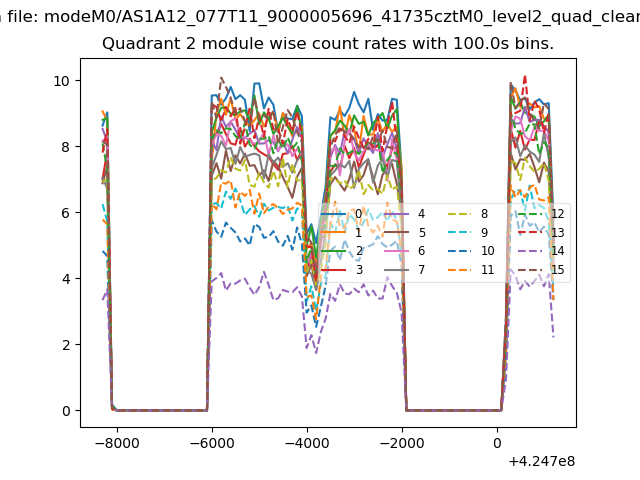
| Module-wise count rates for Quadrant B Data is divided into 100 sec bins |
 |
 |
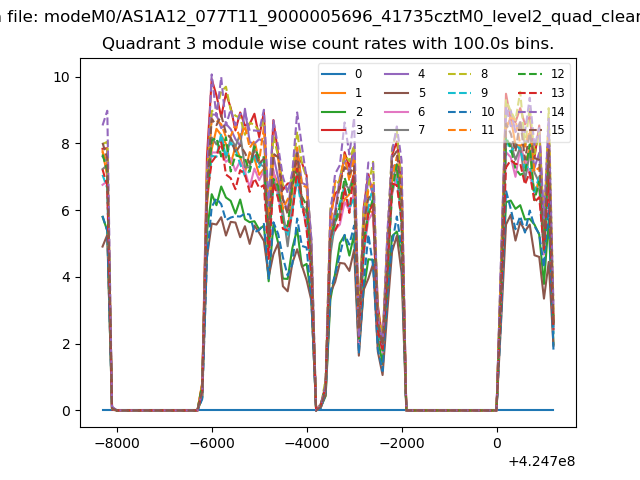
| Module-wise count rates for Quadrant C Data is divided into 100 sec bins |
 |
 |
| Module-wise count rates for Quadrant D Data is divided into 100 sec bins |
 |
 |
| Parameter | Plot |
|---|---|
| CZT HV Monitor | 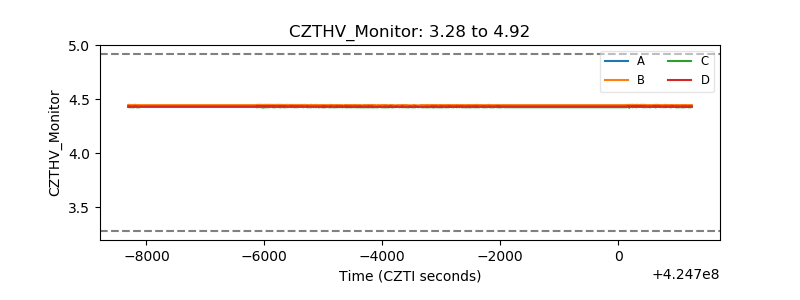 |
| D_VDD | 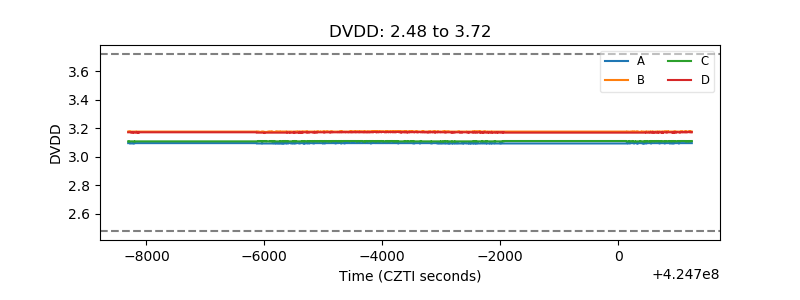 |
| Temperature 1 | 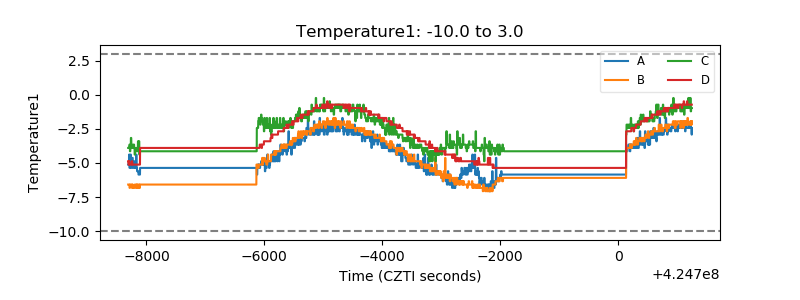 |
| Veto HV Monitor |  |
| Veto LLD | 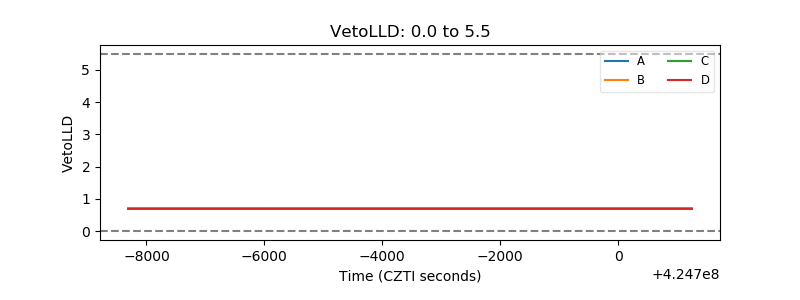 |
| Alpha Counter | 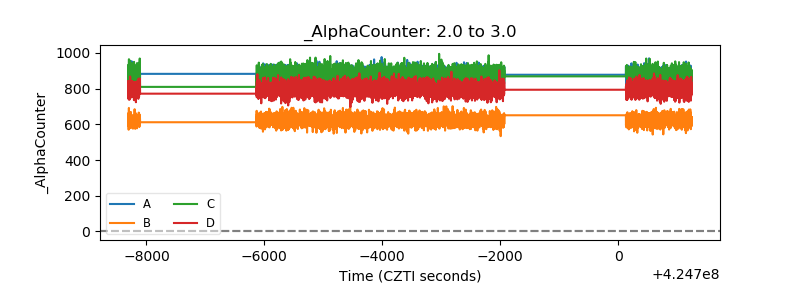 |
| _CPM_Rate | 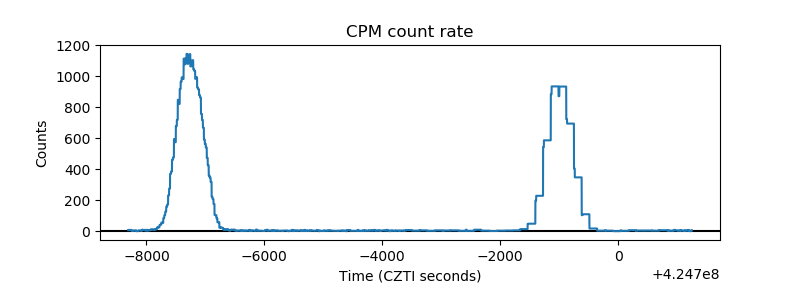 |
| CZT Counter | 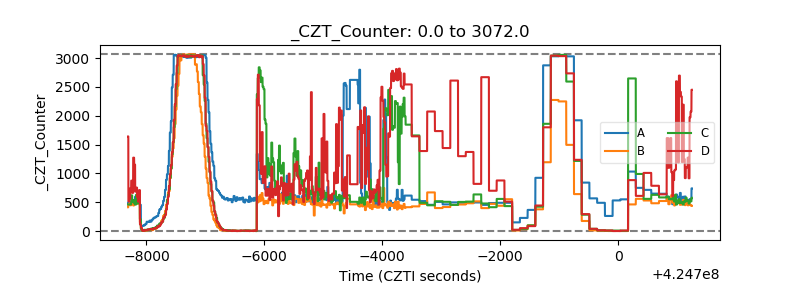 |
| +2.5 Volts monitor | 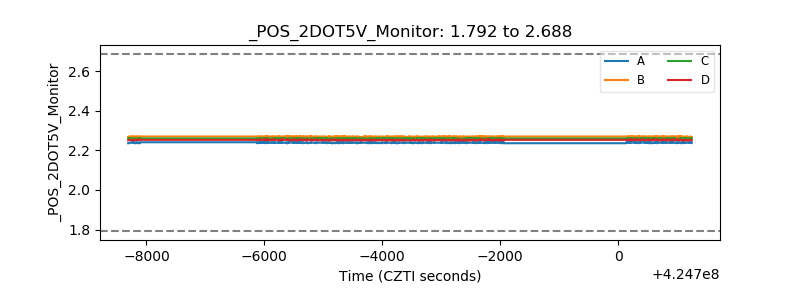 |
| +5 Volts monitor | 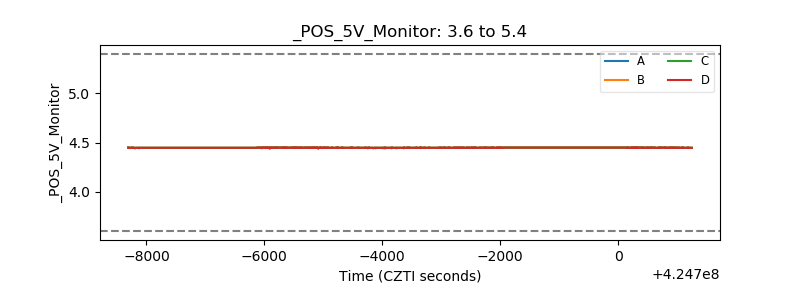 |
| _ROLL_ROT | 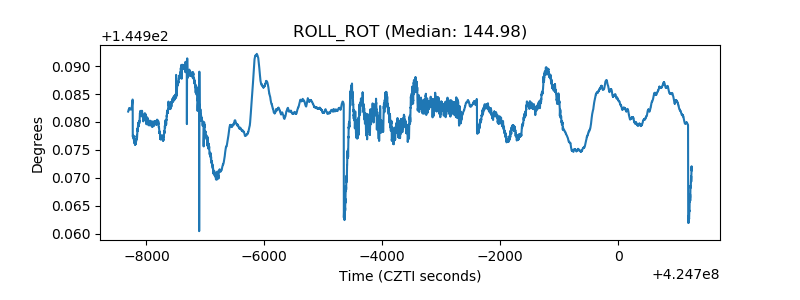 |
| _Roll_DEC | 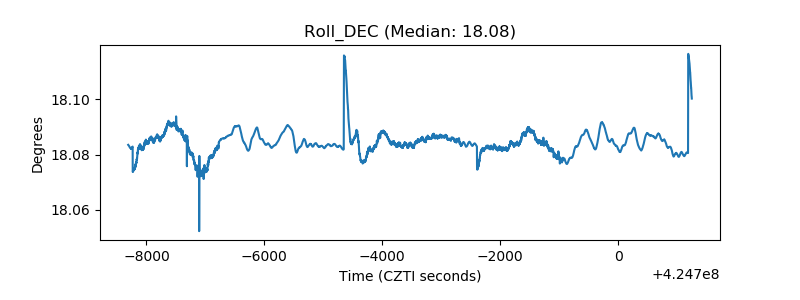 |
| _Roll_RA | 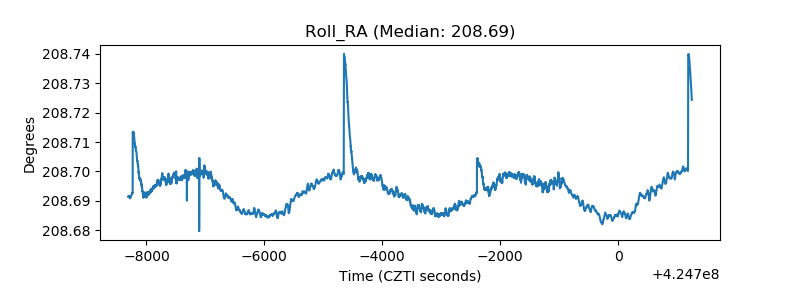 |
| Veto Counter | 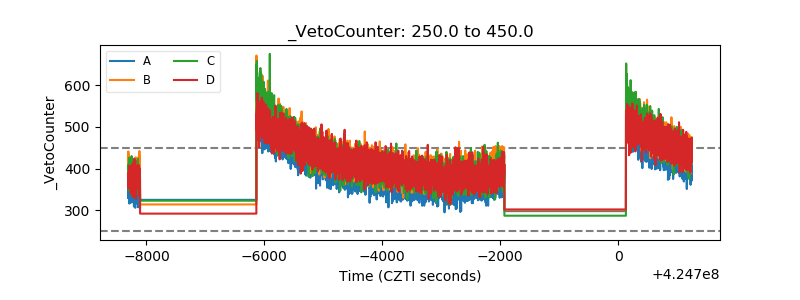 |