| Param | Original file | Final file |
|---|---|---|
| Filename | modeM0/AS1A12_077T11_9000005696_41736cztM0_level2.fits | modeM0/AS1A12_077T11_9000005696_41736cztM0_level2_quad_clean.evt |
| Size (bytes) | 419,561,280 | 88,159,680 |
| Size | 400.1 MB | 84.1 MB |
| Events in quadrant A | 2,790,106 | 618,800 |
| Events in quadrant B | 2,326,868 | 628,251 |
| Events in quadrant C | 2,907,999 | 575,764 |
| Events in quadrant D | 7,116,966 | 495,767 |
| Mode M9 | |||
|---|---|---|---|
| Quadrant | BADHDUFLAG | Total packets | Discarded packets |
| A | 0 | 21 | 0 |
| B | 0 | 21 | 0 |
| C | 0 | 21 | 0 |
| D | 0 | 21 | 0 |
| Mode M0 | |||
|---|---|---|---|
| Quadrant | BADHDUFLAG | Total packets | Discarded packets |
| A | 0 | 11281 | 1 |
| B | 0 | 10159 | 2 |
| C | 0 | 11442 | 1 |
| D | 0 | 24667 | 1 |
| Mode SS | |||
|---|---|---|---|
| Quadrant | BADHDUFLAG | Total packets | Discarded packets |
| A | 0 | 102 | 0 |
| B | 0 | 102 | 0 |
| C | 0 | 102 | 0 |
| D | 0 | 102 | 0 |
| Quadrant | Total seconds | Saturated seconds | Saturation percentage |
|---|---|---|---|
| A | 5008 | 15 | 0.299521% |
| B | 5007 | 4 | 0.079888% |
| C | 5007 | 139 | 2.776113% |
| D | 5007 | 716 | 14.299980% |
Noise dominated data is calculated using 1-second bins in cleaned event files. If a bin has >2000 counts, and if more than 50% of those come from <1% of pixels, then it is considered to be noise-dominated and hence unusable.
| Quadrant | # 1 sec bins | Bins with >0 counts | Bins with >2000 counts | High rate bins dominated by noise | Noise dominated (total time) | Noise dominated (detector-on time) | Marked lightcurve |
|---|---|---|---|---|---|---|---|
| A | 7130 | 5008 | 0 | 0 | 0.00% | 0.00% | 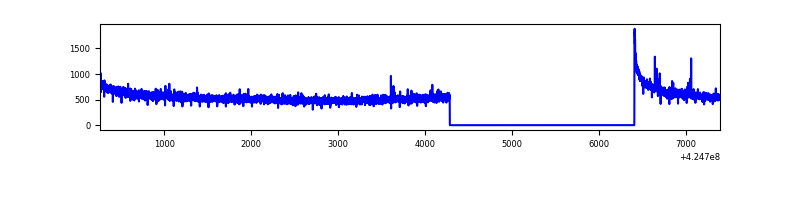 |
| B | 7129 | 5006 | 0 | 0 | 0.00% | 0.00% | 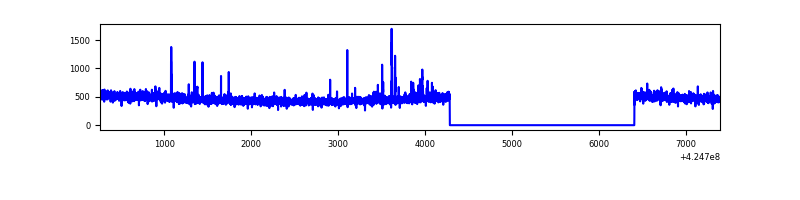 |
| C | 7129 | 5006 | 137 | 137 | 1.92% | 2.74% |  |
| D | 7129 | 5006 | 814 | 814 | 11.42% | 16.26% | 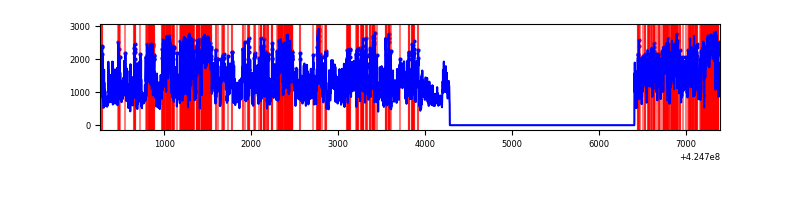 |
Top three noisy pixels from each quadrant. If the there are fewer than three noisy pixels in the level2.evt file, extra rows are filled as -1
| Pixel properties | Quadrant properties | ||||||
|---|---|---|---|---|---|---|---|
| Quadrant | DetID | PixID | Counts | Sigma | Mean | Median | Sigma |
| A | 10 | 83 | 480482 | 3955.27 | 591 | 580 | 121.3 |
| A | 15 | 223 | 12363 | 97.11 | 591 | 580 | 121.3 |
| A | 13 | 254 | 7965 | 60.87 | 591 | 580 | 121.3 |
| B | 5 | 255 | 33486 | 293.8 | 579 | 563 | 112.1 |
| B | 12 | 111 | 13489 | 115.35 | 579 | 563 | 112.1 |
| B | 11 | 111 | 12720 | 108.48 | 579 | 563 | 112.1 |
| C | 0 | 10 | 512819 | 3943.33 | 557 | 561 | 129.9 |
| C | 15 | 214 | 201868 | 1549.65 | 557 | 561 | 129.9 |
| C | 14 | 67 | 17735 | 132.2 | 557 | 561 | 129.9 |
| D | 12 | 79 | 3808287 | 27832.36 | 553 | 539 | 136.8 |
| D | 12 | 233 | 753645 | 5504.75 | 553 | 539 | 136.8 |
| D | 13 | 249 | 199184 | 1451.98 | 553 | 539 | 136.8 |
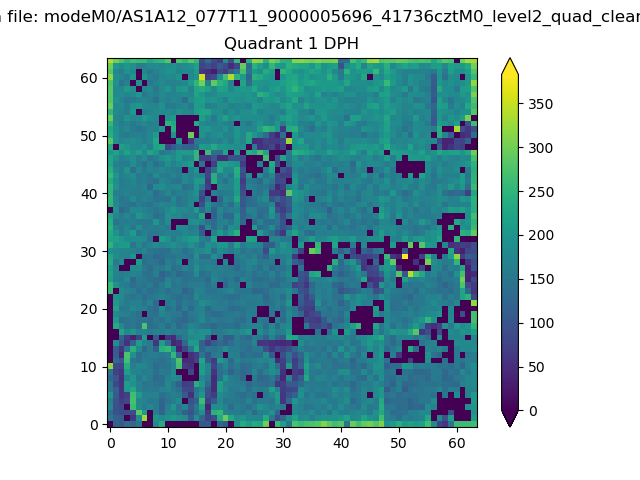
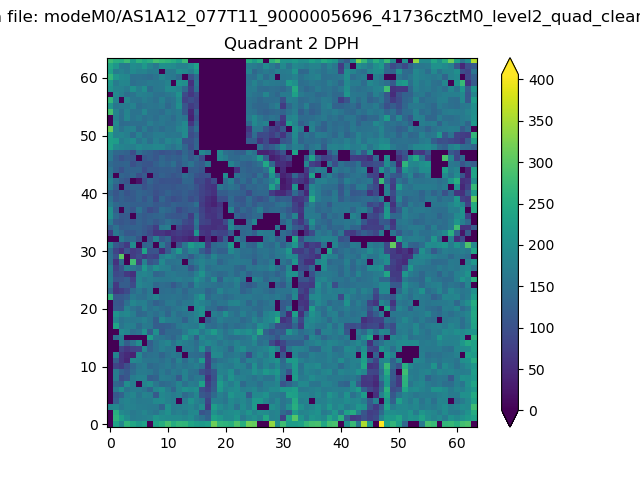
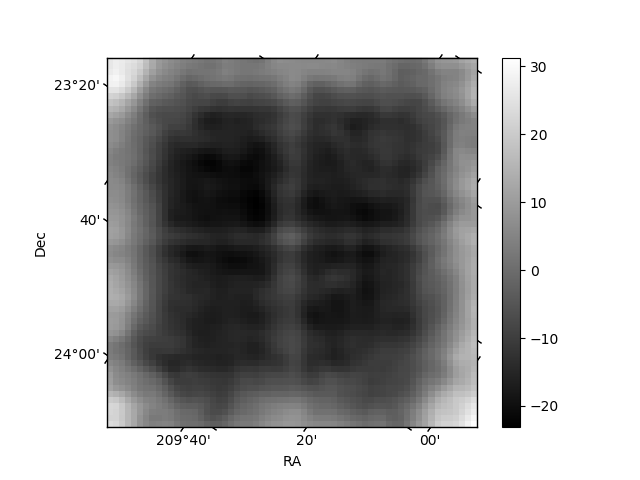
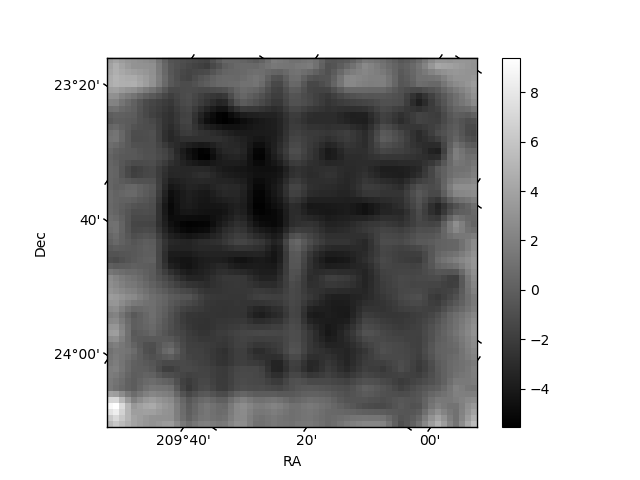
Histogram calculated using DETX and DETY for each event in the final _common_clean file
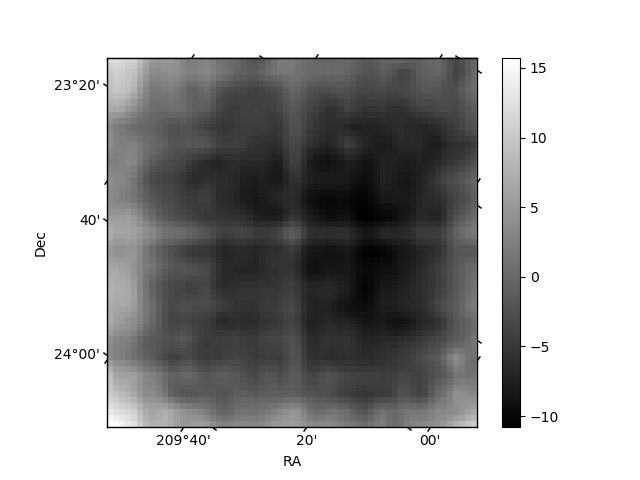
| Quadrant A | 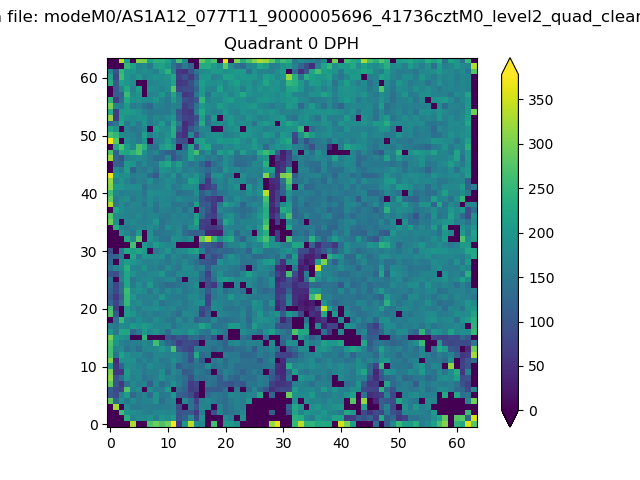 |
 |
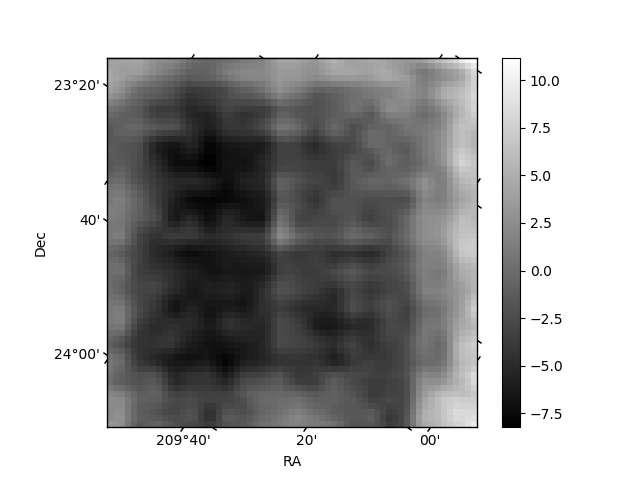
Quadrant B |
|---|---|---|---|
| Quadrant D | 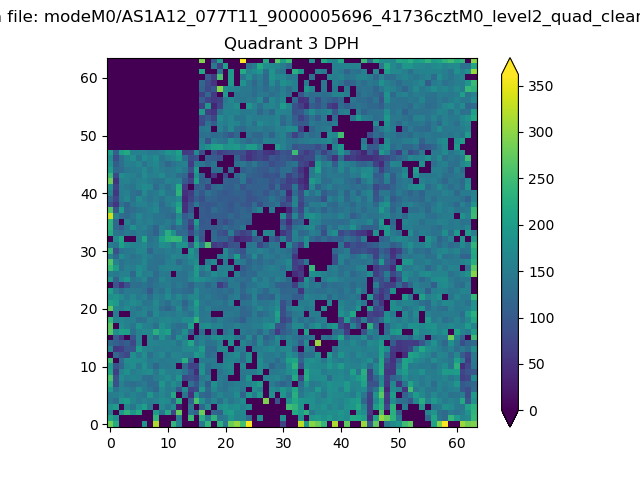 |
 |
Quadrant C |
| Plot type | Count rate plots | Images |
|---|---|---|
| Comparison with Poisson distribution Blue bars denote a histogram of data divided into 1 sec bins. Red curve is a Poisson curve with rate = median count rate of data. |
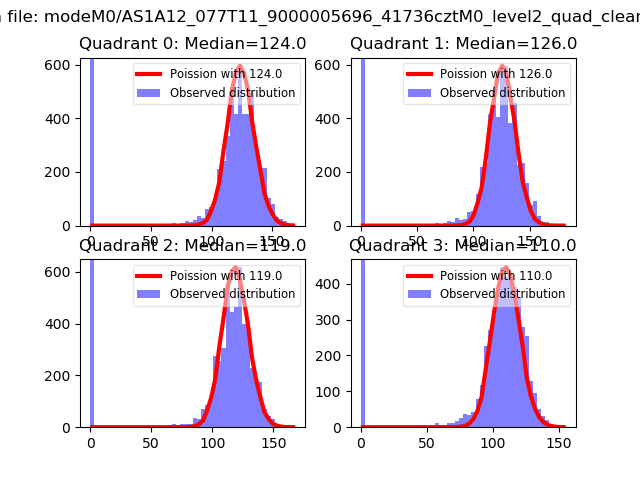 |
 |
| Quadrant-wise count rates Data is divided into 100 sec bins |
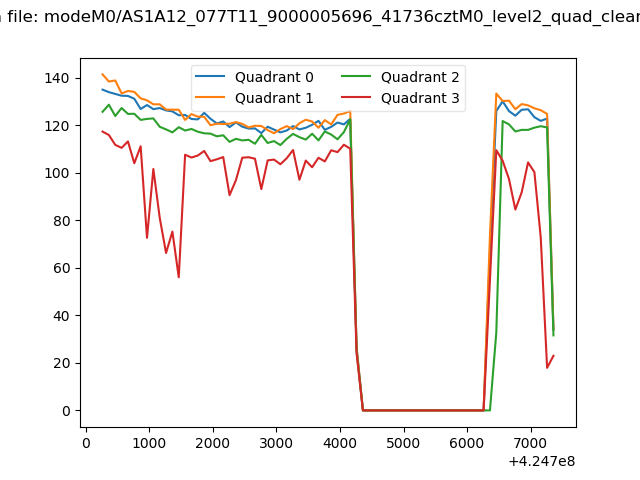 |
|
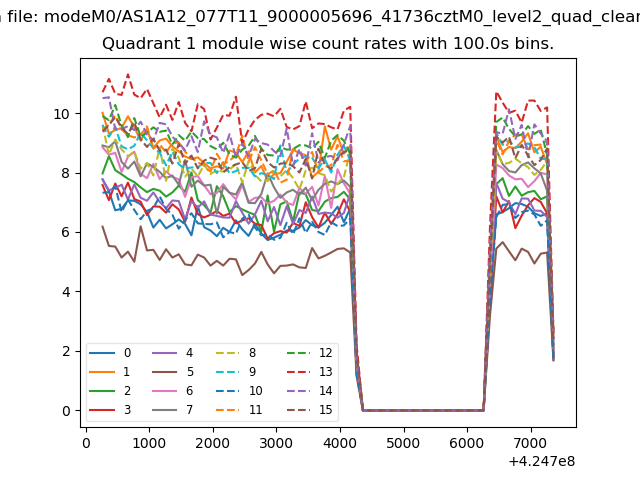
| Module-wise count rates for Quadrant A Data is divided into 100 sec bins |
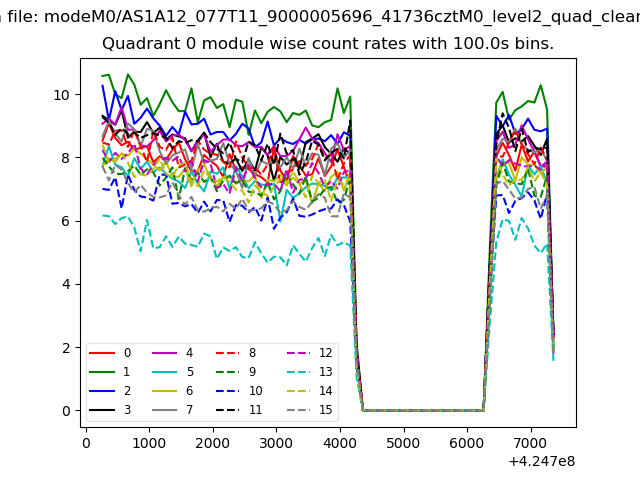 |
 |
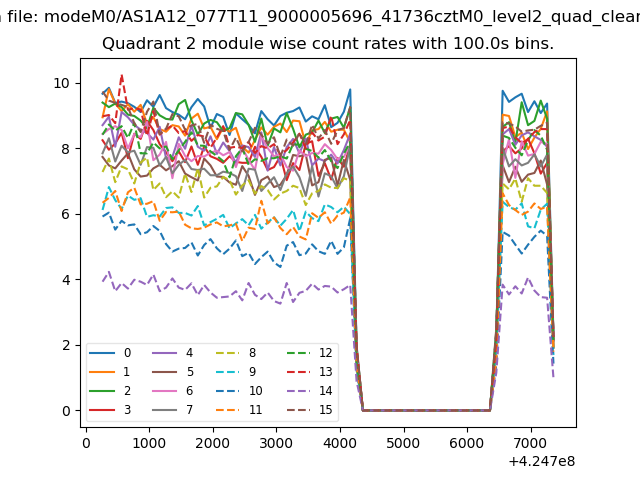
| Module-wise count rates for Quadrant B Data is divided into 100 sec bins |
 |
 |
| Module-wise count rates for Quadrant C Data is divided into 100 sec bins |
 |
 |
| Module-wise count rates for Quadrant D Data is divided into 100 sec bins |
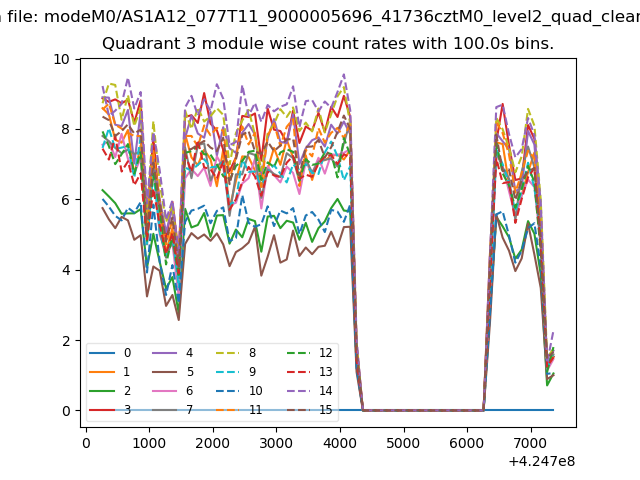 |
 |
| Parameter | Plot |
|---|---|
| CZT HV Monitor | 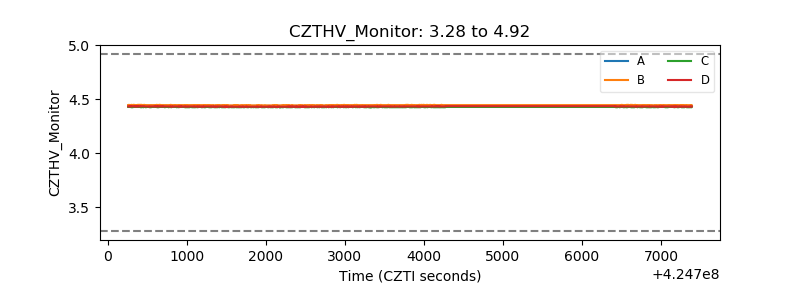 |
| D_VDD | 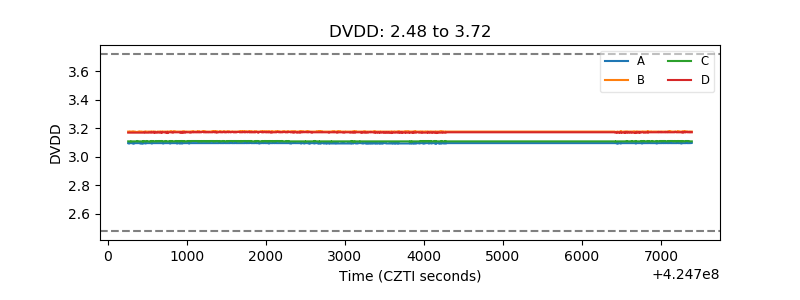 |
| Temperature 1 | 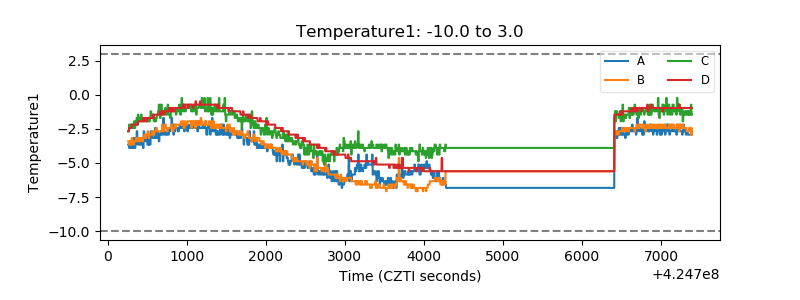 |
| Veto HV Monitor | 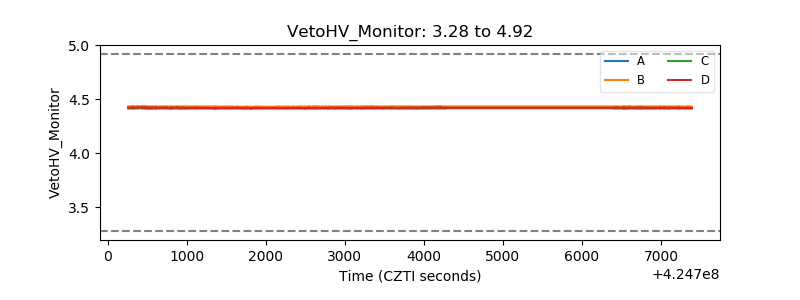 |
| Veto LLD | 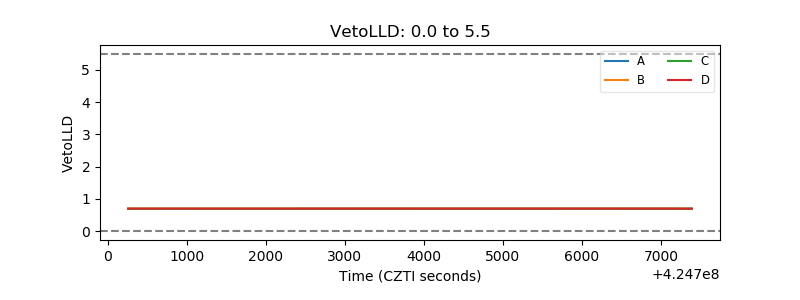 |
| Alpha Counter | 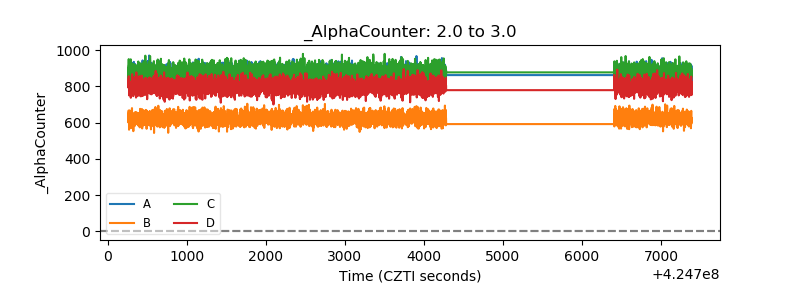 |
| _CPM_Rate | 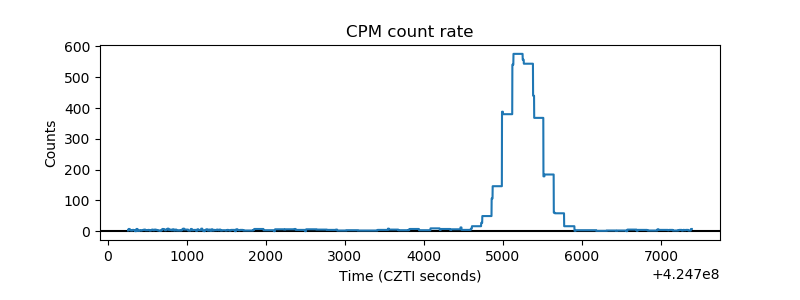 |
| CZT Counter |  |
| +2.5 Volts monitor |  |
| +5 Volts monitor | 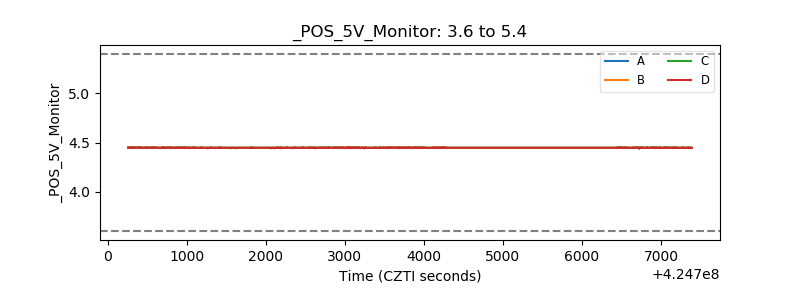 |
| _ROLL_ROT | 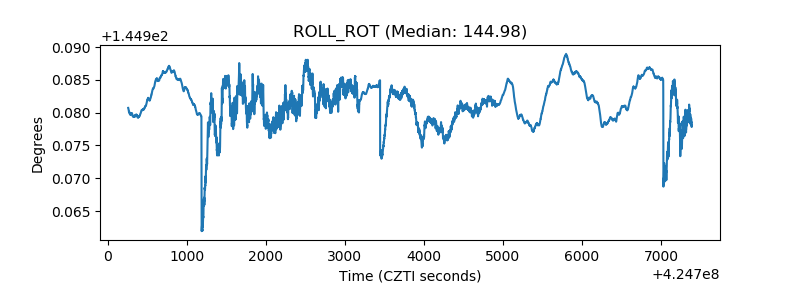 |
| _Roll_DEC | 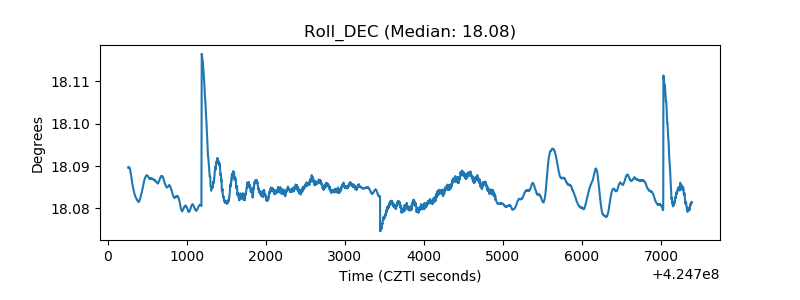 |
| _Roll_RA | 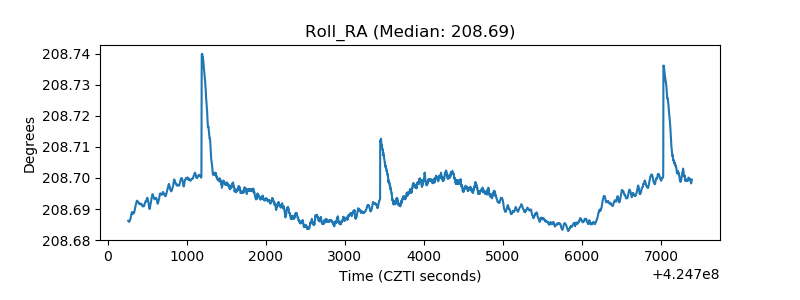 |
| Veto Counter | 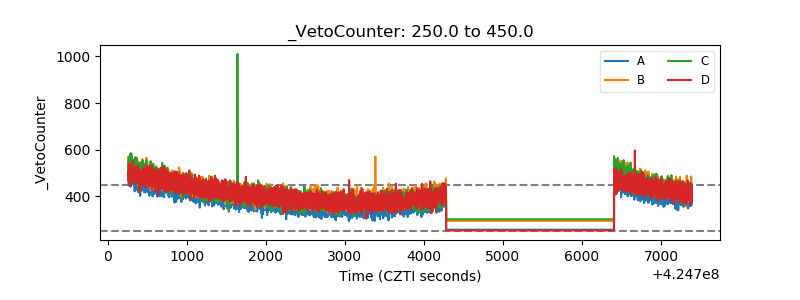 |