| Param | Original file | Final file |
|---|---|---|
| Filename | modeM0/AS1A12_077T11_9000005696_41737cztM0_level2.fits | modeM0/AS1A12_077T11_9000005696_41737cztM0_level2_quad_clean.evt |
| Size (bytes) | 452,090,880 | 82,077,120 |
| Size | 431.1 MB | 78.3 MB |
| Events in quadrant A | 2,900,760 | 577,449 |
| Events in quadrant B | 2,210,279 | 593,139 |
| Events in quadrant C | 2,915,662 | 544,718 |
| Events in quadrant D | 8,325,392 | 424,255 |
| Mode M9 | |||
|---|---|---|---|
| Quadrant | BADHDUFLAG | Total packets | Discarded packets |
| A | 0 | 21 | 0 |
| B | 0 | 21 | 0 |
| C | 0 | 21 | 0 |
| D | 0 | 21 | 0 |
| Mode M0 | |||
|---|---|---|---|
| Quadrant | BADHDUFLAG | Total packets | Discarded packets |
| A | 0 | 11610 | 1 |
| B | 0 | 9917 | 1 |
| C | 0 | 11493 | 1 |
| D | 0 | 28145 | 2 |
| Mode SS | |||
|---|---|---|---|
| Quadrant | BADHDUFLAG | Total packets | Discarded packets |
| A | 0 | 100 | 0 |
| B | 0 | 100 | 0 |
| C | 0 | 100 | 0 |
| D | 0 | 100 | 0 |
| Quadrant | Total seconds | Saturated seconds | Saturation percentage |
|---|---|---|---|
| A | 4929 | 87 | 1.765064% |
| B | 4929 | 3 | 0.060864% |
| C | 4930 | 150 | 3.042596% |
| D | 4929 | 1257 | 25.502130% |
Noise dominated data is calculated using 1-second bins in cleaned event files. If a bin has >2000 counts, and if more than 50% of those come from <1% of pixels, then it is considered to be noise-dominated and hence unusable.
| Quadrant | # 1 sec bins | Bins with >0 counts | Bins with >2000 counts | High rate bins dominated by noise | Noise dominated (total time) | Noise dominated (detector-on time) | Marked lightcurve |
|---|---|---|---|---|---|---|---|
| A | 7052 | 4929 | 80 | 80 | 1.13% | 1.62% | 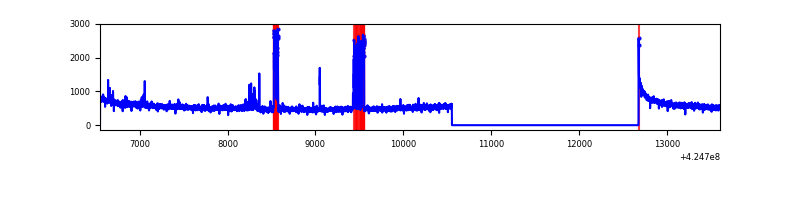 |
| B | 7052 | 4929 | 0 | 0 | 0.00% | 0.00% | 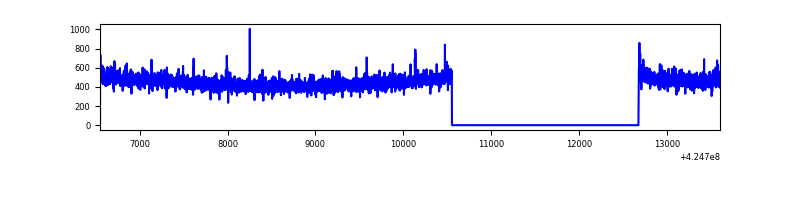 |
| C | 7053 | 4930 | 145 | 145 | 2.06% | 2.94% | 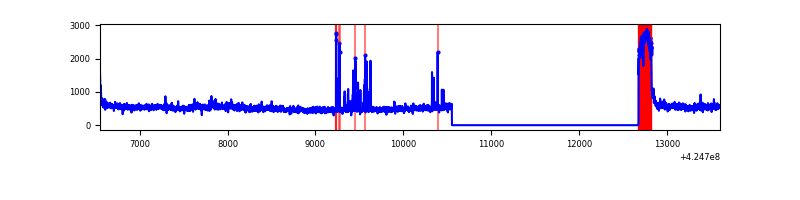 |
| D | 7052 | 4929 | 1579 | 1579 | 22.39% | 32.03% | 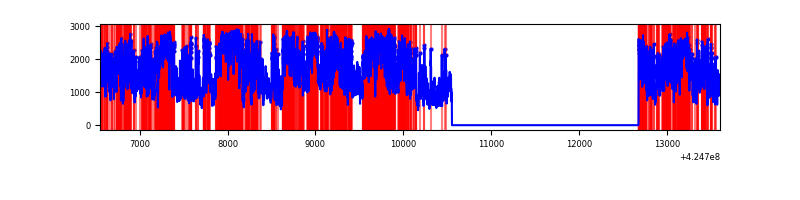 |
Top three noisy pixels from each quadrant. If the there are fewer than three noisy pixels in the level2.evt file, extra rows are filled as -1
| Pixel properties | Quadrant properties | ||||||
|---|---|---|---|---|---|---|---|
| Quadrant | DetID | PixID | Counts | Sigma | Mean | Median | Sigma |
| A | 10 | 83 | 472888 | 4118.43 | 555 | 544 | 114.7 |
| A | 15 | 223 | 267344 | 2326.26 | 555 | 544 | 114.7 |
| A | 13 | 254 | 8151 | 66.33 | 555 | 544 | 114.7 |
| B | 0 | 183 | 13979 | 125.15 | 552 | 538 | 107.4 |
| B | 12 | 111 | 12910 | 115.19 | 552 | 538 | 107.4 |
| B | 11 | 111 | 12205 | 108.63 | 552 | 538 | 107.4 |
| C | 0 | 10 | 573155 | 4618.07 | 528 | 532 | 124.0 |
| C | 15 | 214 | 197817 | 1591.06 | 528 | 532 | 124.0 |
| C | 0 | 207 | 58743 | 469.46 | 528 | 532 | 124.0 |
| D | 12 | 79 | 4955242 | 39088.29 | 509 | 495 | 126.8 |
| D | 12 | 233 | 614385 | 4843.01 | 509 | 495 | 126.8 |
| D | 13 | 249 | 329810 | 2597.99 | 509 | 495 | 126.8 |
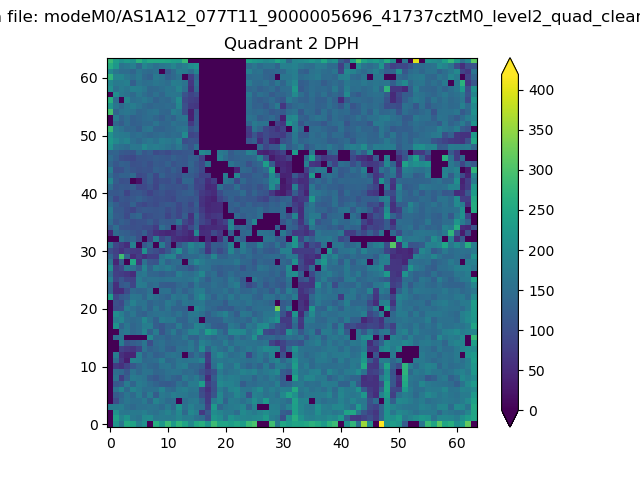
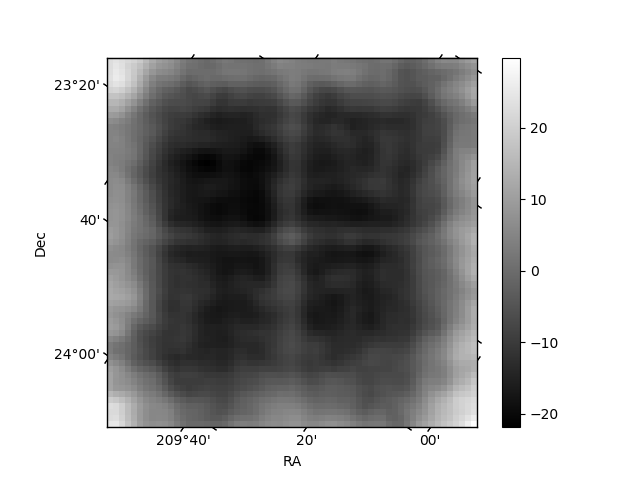
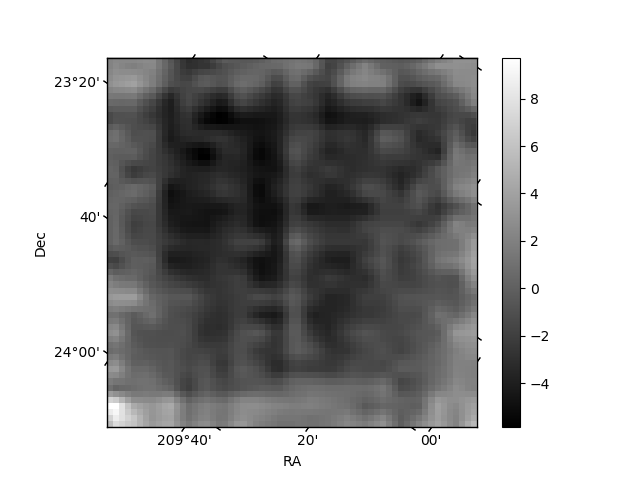
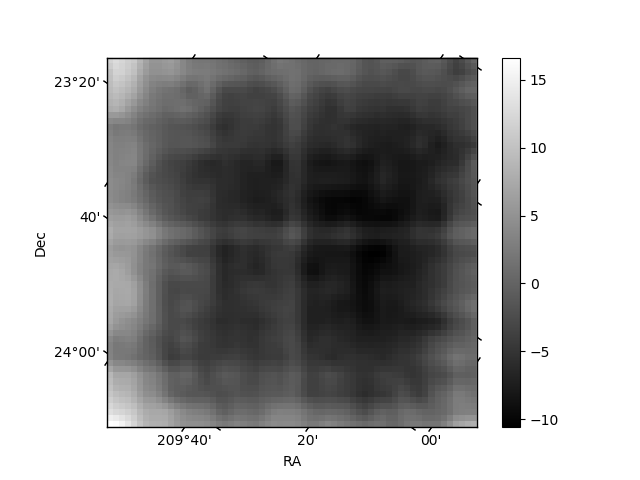
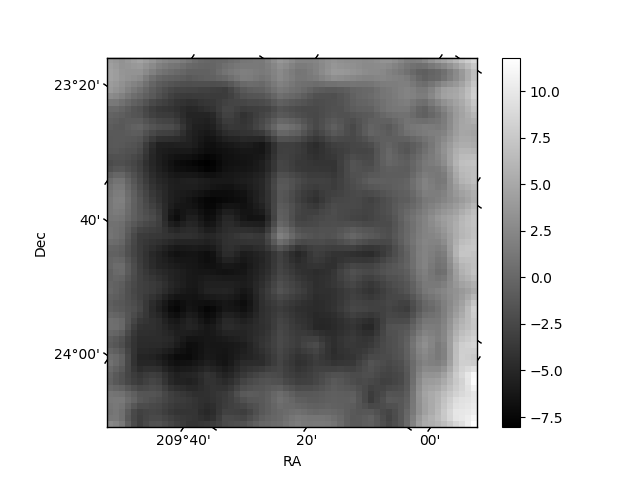
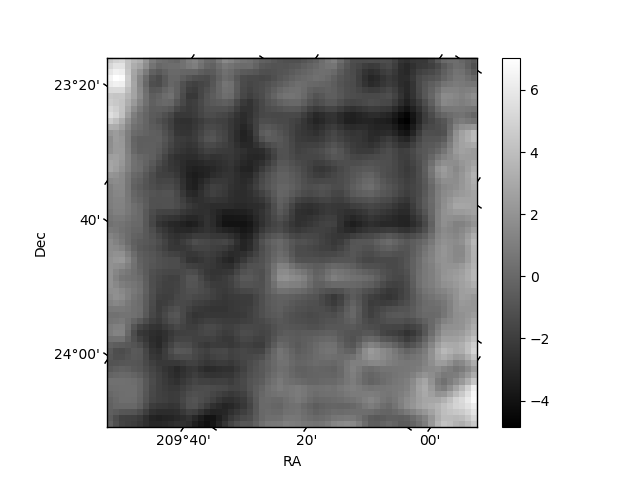
Histogram calculated using DETX and DETY for each event in the final _common_clean file
| Quadrant A | 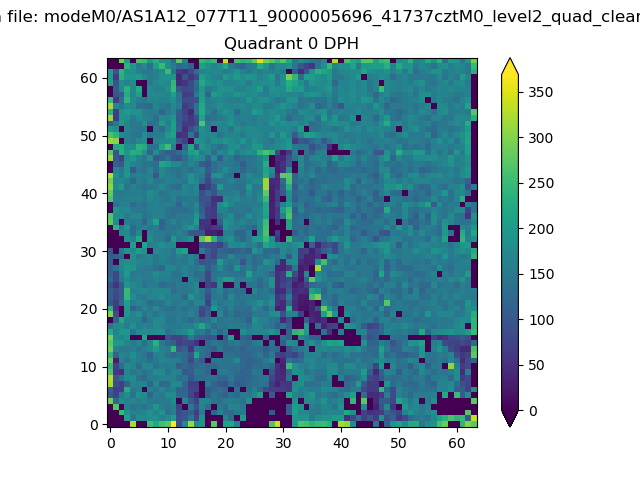 |
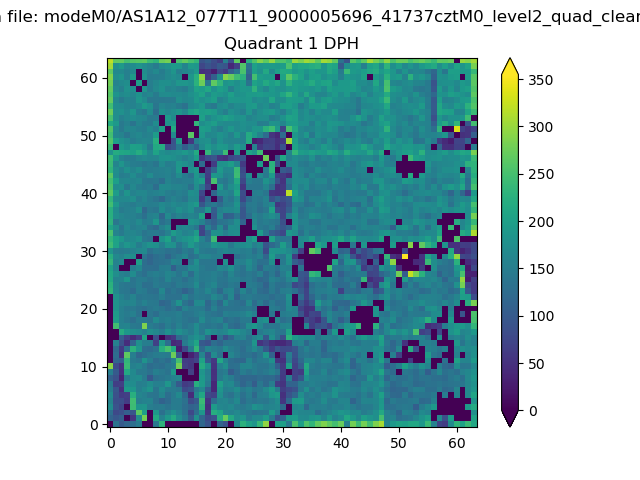 |
Quadrant B |
|---|---|---|---|
| Quadrant D | 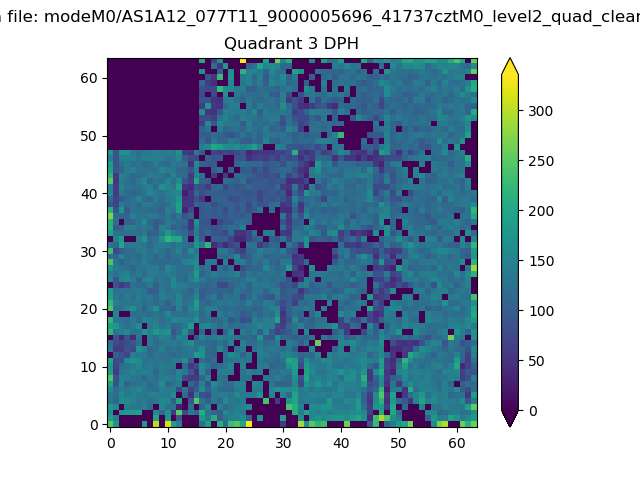 |
 |
Quadrant C |
| Plot type | Count rate plots | Images |
|---|---|---|
| Comparison with Poisson distribution Blue bars denote a histogram of data divided into 1 sec bins. Red curve is a Poisson curve with rate = median count rate of data. |
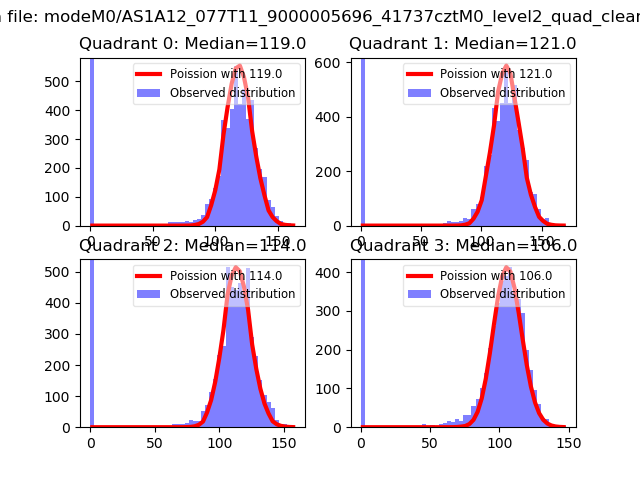 |
 |
| Quadrant-wise count rates Data is divided into 100 sec bins |
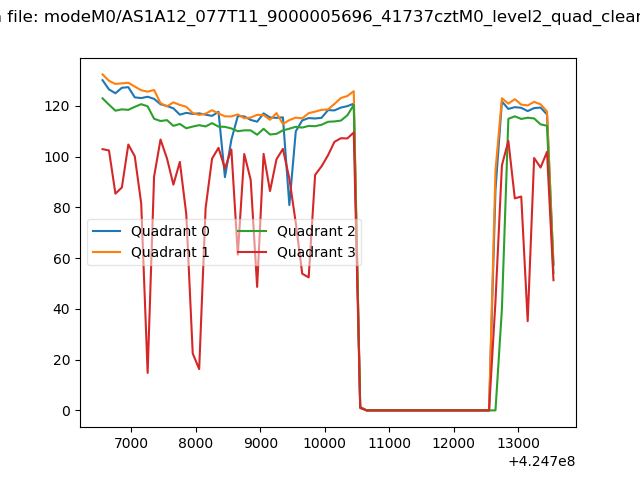 |
|
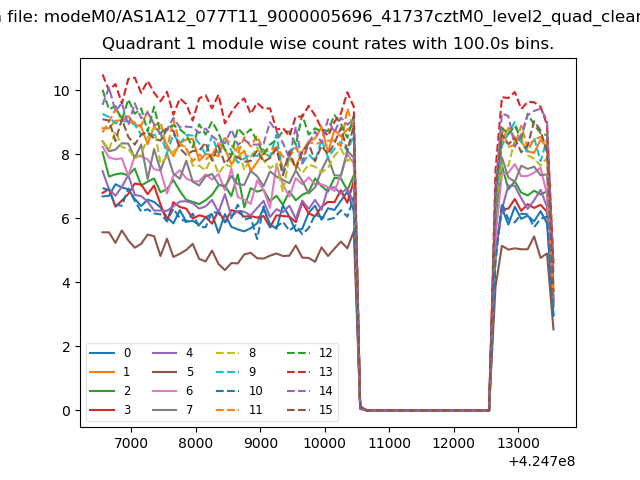
| Module-wise count rates for Quadrant A Data is divided into 100 sec bins |
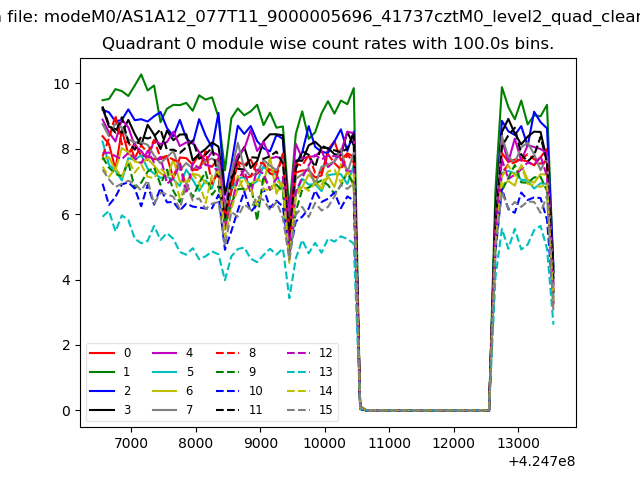 |
 |
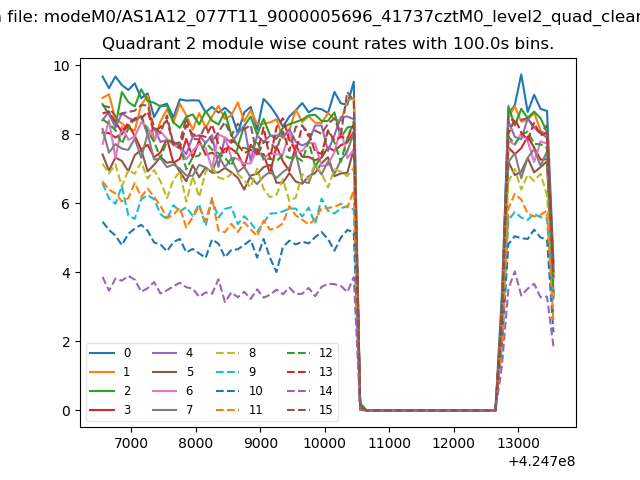
| Module-wise count rates for Quadrant B Data is divided into 100 sec bins |
 |
 |
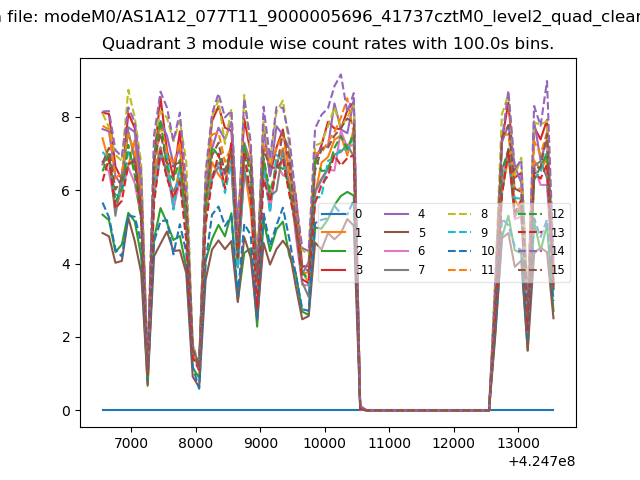
| Module-wise count rates for Quadrant C Data is divided into 100 sec bins |
 |
 |
| Module-wise count rates for Quadrant D Data is divided into 100 sec bins |
 |
 |
| Parameter | Plot |
|---|---|
| CZT HV Monitor | 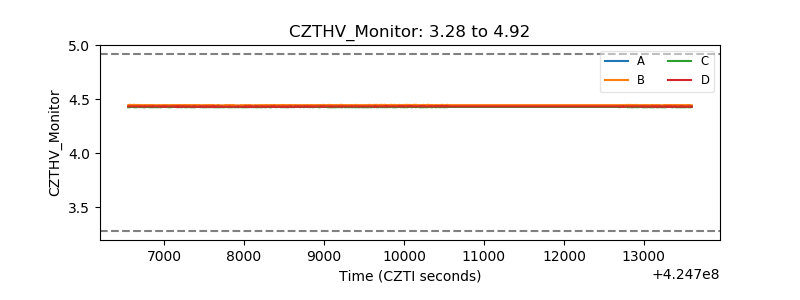 |
| D_VDD | 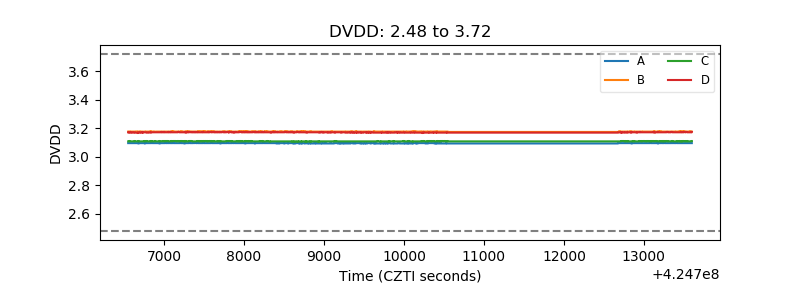 |
| Temperature 1 | 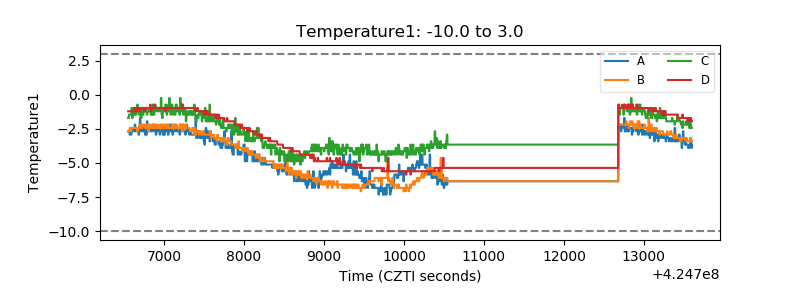 |
| Veto HV Monitor |  |
| Veto LLD | 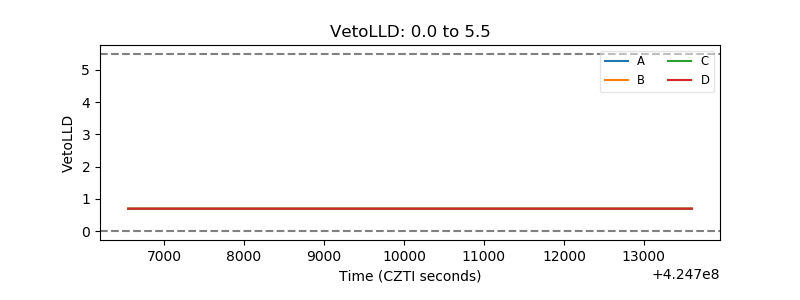 |
| Alpha Counter | 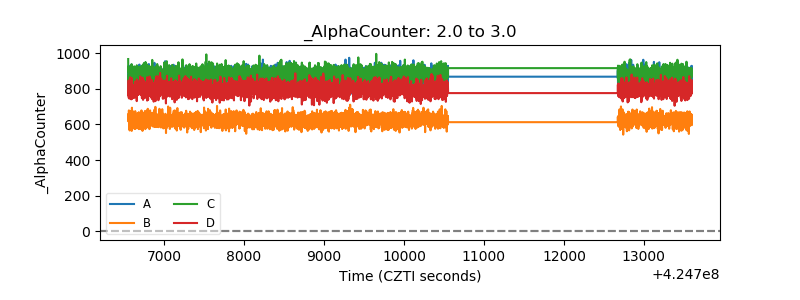 |
| _CPM_Rate | 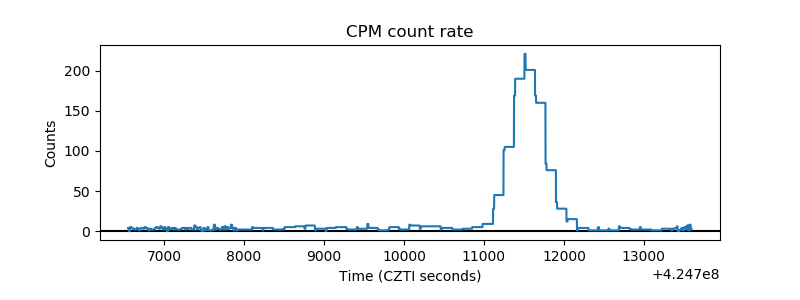 |
| CZT Counter | 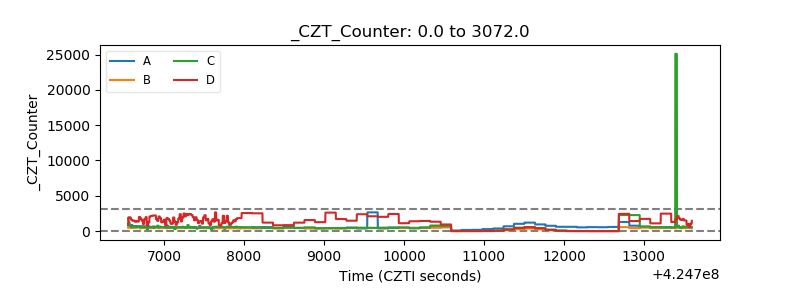 |
| +2.5 Volts monitor | 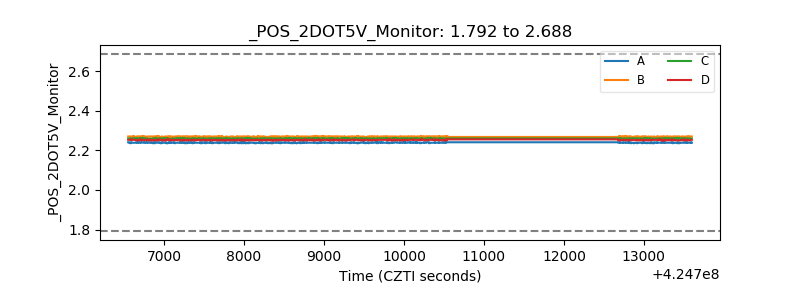 |
| +5 Volts monitor | 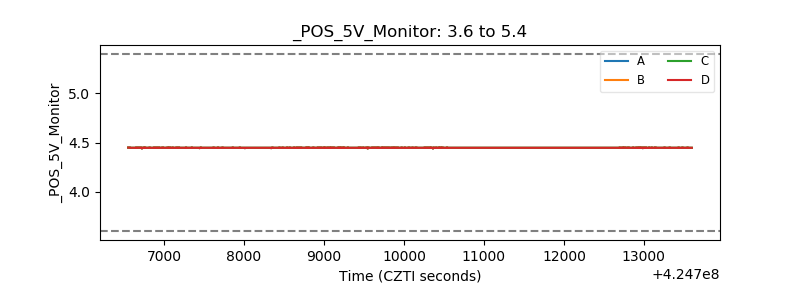 |
| _ROLL_ROT | 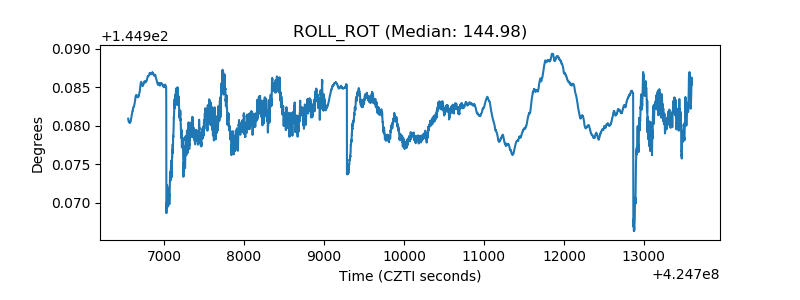 |
| _Roll_DEC | 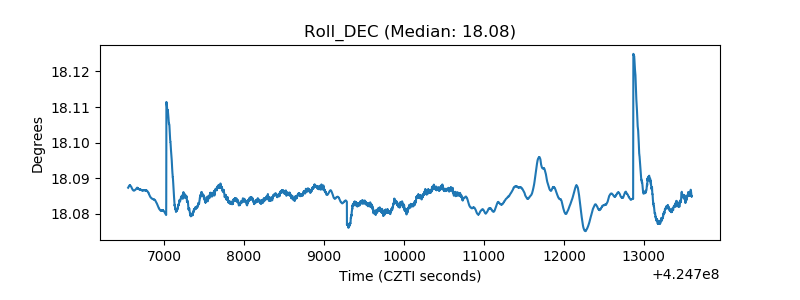 |
| _Roll_RA | 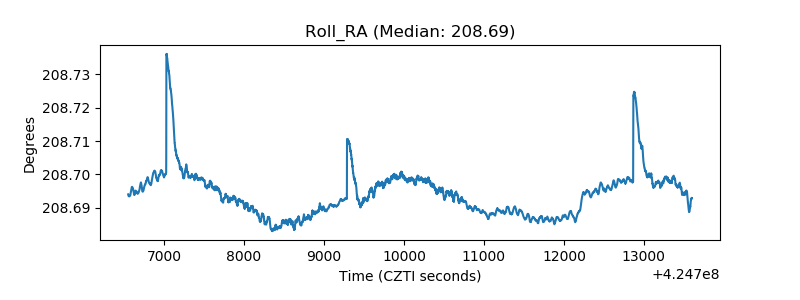 |
| Veto Counter | 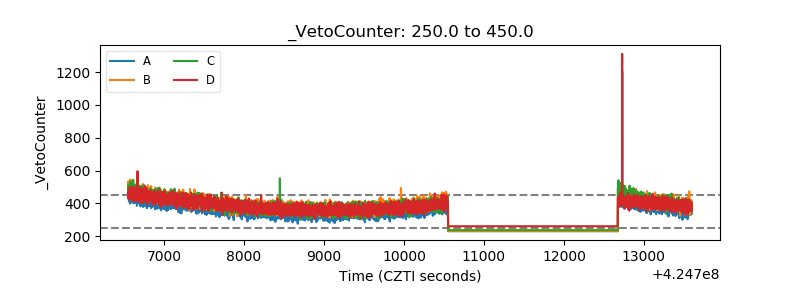 |