| Param | Original file | Final file |
|---|---|---|
| Filename | modeM0/AS1A12_077T11_9000005696_41738cztM0_level2.fits | modeM0/AS1A12_077T11_9000005696_41738cztM0_level2_quad_clean.evt |
| Size (bytes) | 975,893,760 | 219,035,520 |
| Size | 930.7 MB | 208.9 MB |
| Events in quadrant A | 7,316,952 | 1,519,797 |
| Events in quadrant B | 6,182,191 | 1,554,625 |
| Events in quadrant C | 7,781,505 | 1,401,947 |
| Events in quadrant D | 13,835,216 | 1,255,392 |
| Mode M9 | |||
|---|---|---|---|
| Quadrant | BADHDUFLAG | Total packets | Discarded packets |
| A | 0 | 63 | 0 |
| B | 0 | 63 | 0 |
| C | 0 | 64 | 0 |
| D | 0 | 64 | 0 |
| Mode M0 | |||
|---|---|---|---|
| Quadrant | BADHDUFLAG | Total packets | Discarded packets |
| A | 0 | 29339 | 4 |
| B | 0 | 27073 | 4 |
| C | 0 | 30665 | 4 |
| D | 0 | 50161 | 6 |
| Mode SS | |||
|---|---|---|---|
| Quadrant | BADHDUFLAG | Total packets | Discarded packets |
| A | 0 | 264 | 0 |
| B | 0 | 264 | 0 |
| C | 0 | 264 | 0 |
| D | 0 | 264 | 0 |
| Quadrant | Total seconds | Saturated seconds | Saturation percentage |
|---|---|---|---|
| A | 13042 | 38 | 0.291366% |
| B | 13042 | 29 | 0.222359% |
| C | 13042 | 509 | 3.902776% |
| D | 13041 | 1297 | 9.945556% |
Noise dominated data is calculated using 1-second bins in cleaned event files. If a bin has >2000 counts, and if more than 50% of those come from <1% of pixels, then it is considered to be noise-dominated and hence unusable.
| Quadrant | # 1 sec bins | Bins with >0 counts | Bins with >2000 counts | High rate bins dominated by noise | Noise dominated (total time) | Noise dominated (detector-on time) | Marked lightcurve |
|---|---|---|---|---|---|---|---|
| A | 38416 | 13043 | 9 | 9 | 0.02% | 0.07% | 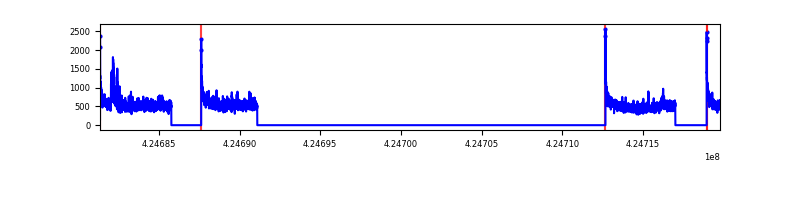 |
| B | 38416 | 13043 | 12 | 12 | 0.03% | 0.09% | 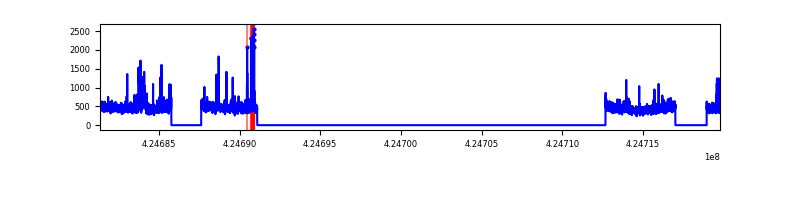 |
| C | 38416 | 13042 | 486 | 486 | 1.27% | 3.73% | 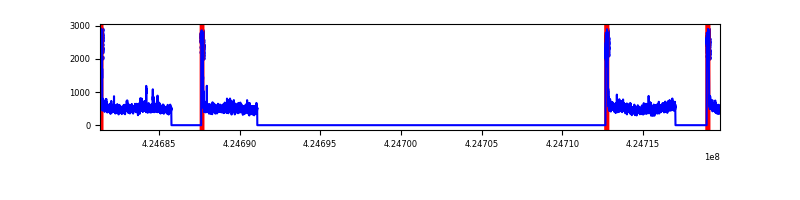 |
| D | 38416 | 13042 | 1491 | 1491 | 3.88% | 11.43% | 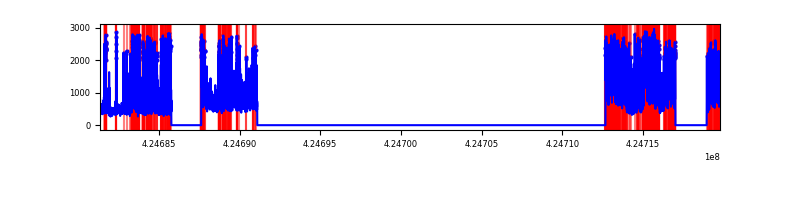 |
Top three noisy pixels from each quadrant. If the there are fewer than three noisy pixels in the level2.evt file, extra rows are filled as -1
| Pixel properties | Quadrant properties | ||||||
|---|---|---|---|---|---|---|---|
| Quadrant | DetID | PixID | Counts | Sigma | Mean | Median | Sigma |
| A | 10 | 83 | 1273087 | 4196.73 | 1487 | 1457 | 303.0 |
| A | 15 | 223 | 214996 | 704.74 | 1487 | 1457 | 303.0 |
| A | 3 | 1 | 51434 | 164.94 | 1487 | 1457 | 303.0 |
| B | 0 | 186 | 188412 | 662.22 | 1468 | 1429 | 282.4 |
| B | 15 | 32 | 100335 | 350.29 | 1468 | 1429 | 282.4 |
| B | 0 | 245 | 40702 | 139.09 | 1468 | 1429 | 282.4 |
| C | 0 | 10 | 1764775 | 5454.06 | 1394 | 1405 | 323.3 |
| C | 15 | 214 | 514996 | 1588.52 | 1394 | 1405 | 323.3 |
| C | 3 | 233 | 38832 | 115.76 | 1394 | 1405 | 323.3 |
| D | 12 | 79 | 5588966 | 16472.54 | 1399 | 1365 | 339.2 |
| D | 2 | 249 | 1149696 | 3385.34 | 1399 | 1365 | 339.2 |
| D | 13 | 249 | 957537 | 2818.85 | 1399 | 1365 | 339.2 |
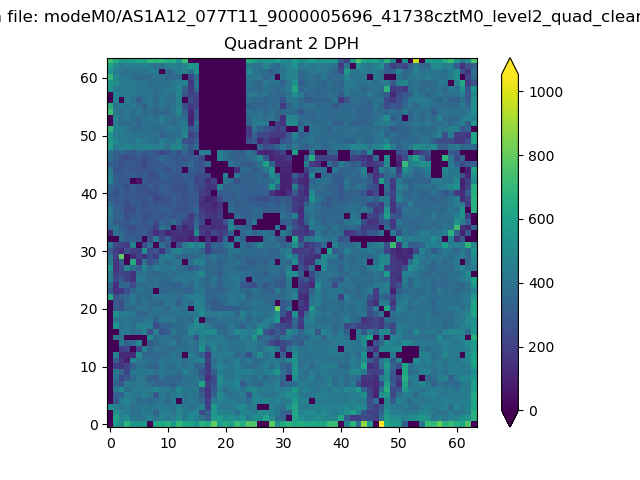
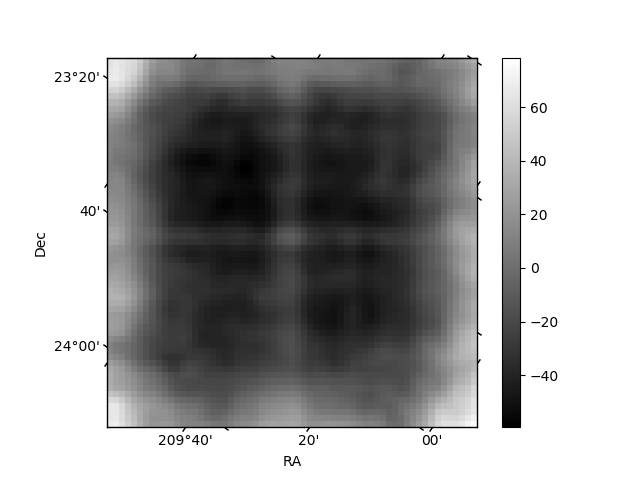
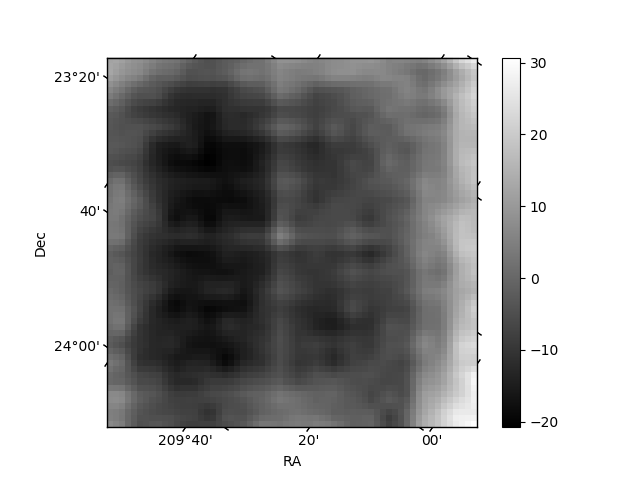
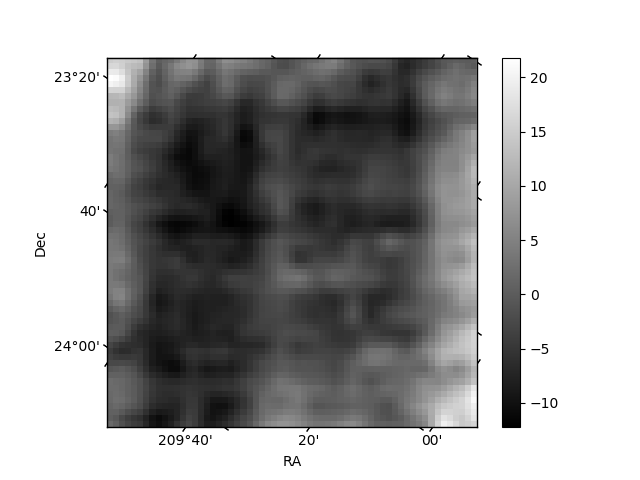
Histogram calculated using DETX and DETY for each event in the final _common_clean file
| Quadrant A | 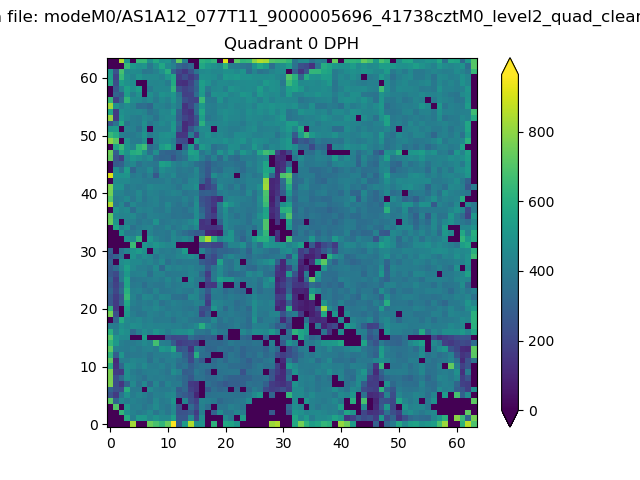 |
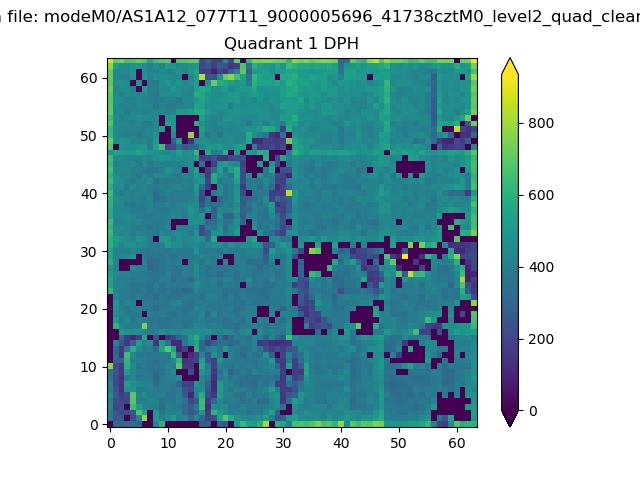 |
Quadrant B |
|---|---|---|---|
| Quadrant D | 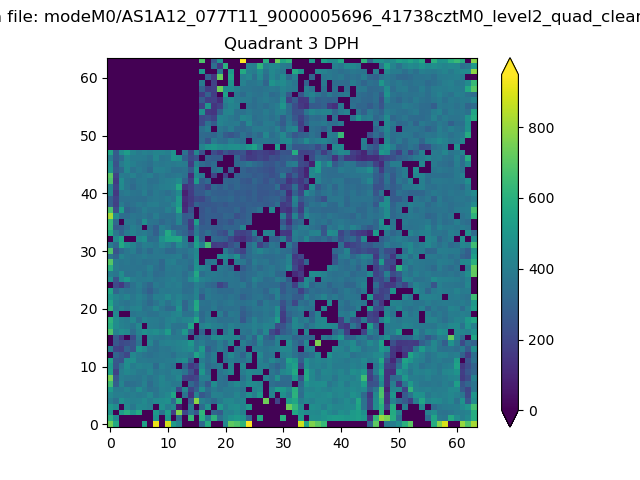 |
 |
Quadrant C |
| Plot type | Count rate plots | Images |
|---|---|---|
| Comparison with Poisson distribution Blue bars denote a histogram of data divided into 1 sec bins. Red curve is a Poisson curve with rate = median count rate of data. |
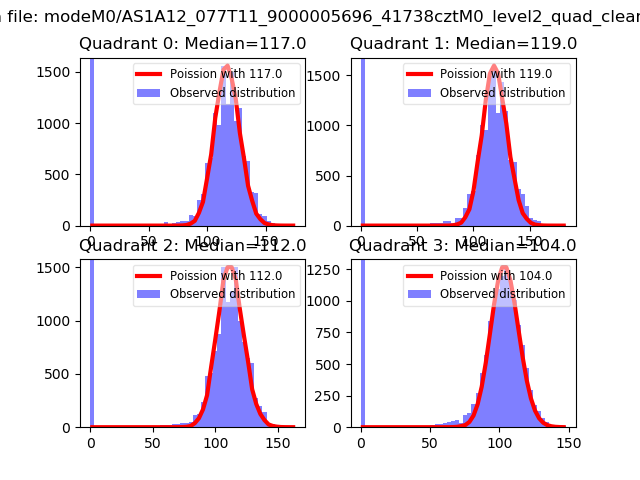 |
 |
| Quadrant-wise count rates Data is divided into 100 sec bins |
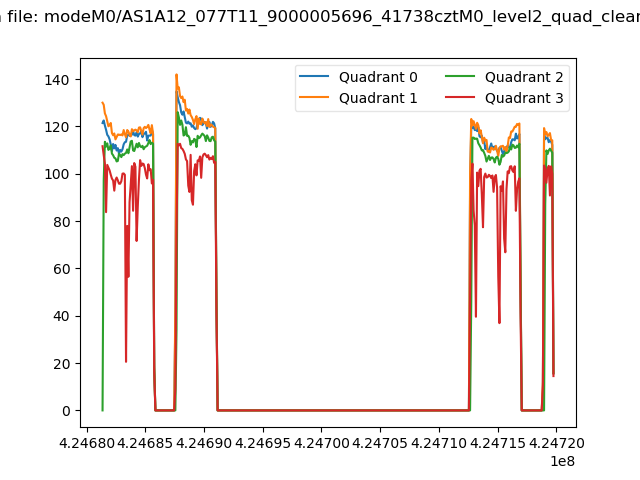 |
|
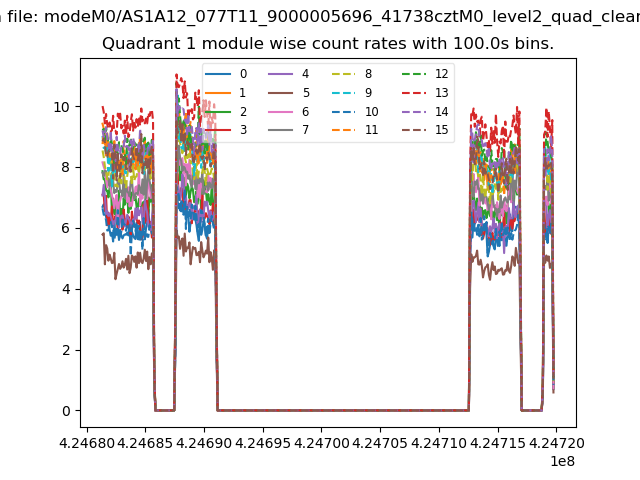
| Module-wise count rates for Quadrant A Data is divided into 100 sec bins |
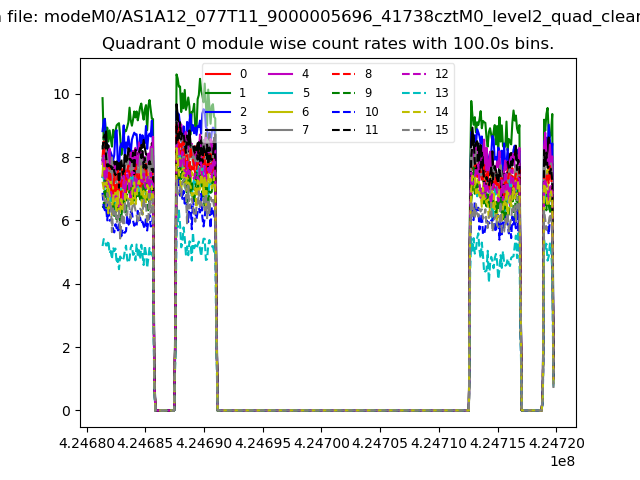 |
 |
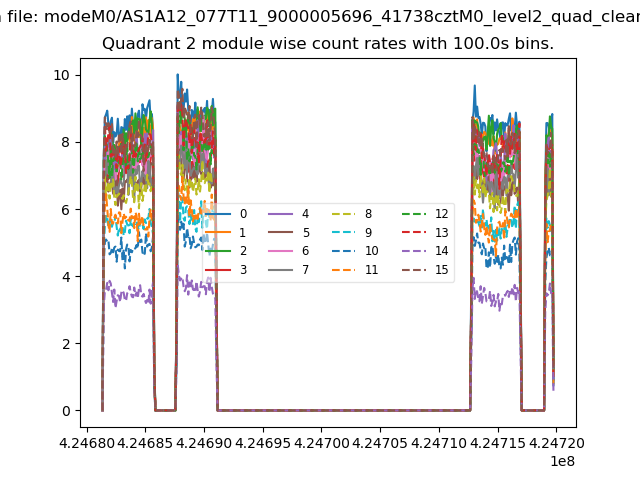
| Module-wise count rates for Quadrant B Data is divided into 100 sec bins |
 |
 |
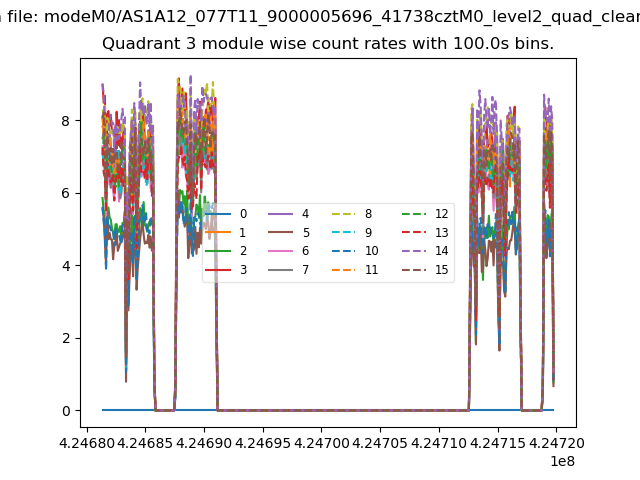
| Module-wise count rates for Quadrant C Data is divided into 100 sec bins |
 |
 |
| Module-wise count rates for Quadrant D Data is divided into 100 sec bins |
 |
 |
| Parameter | Plot |
|---|---|
| CZT HV Monitor | 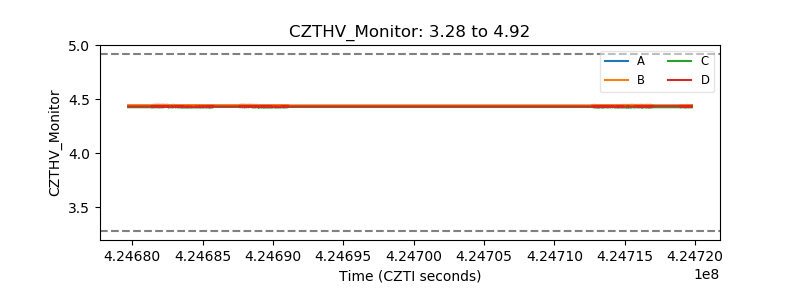 |
| D_VDD | 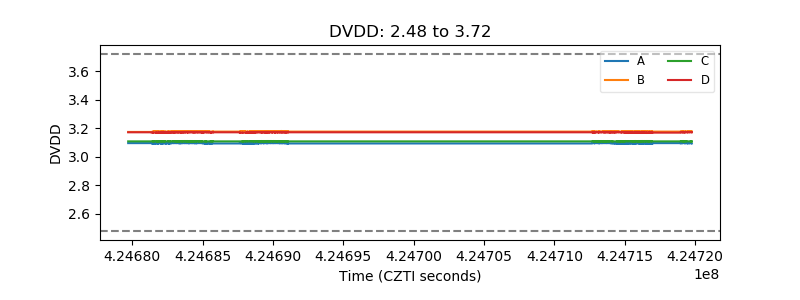 |
| Temperature 1 | 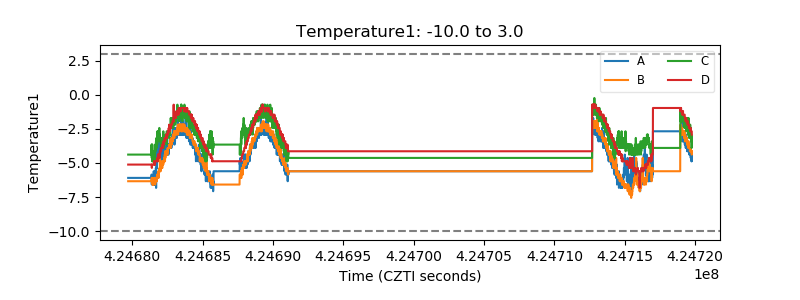 |
| Veto HV Monitor | 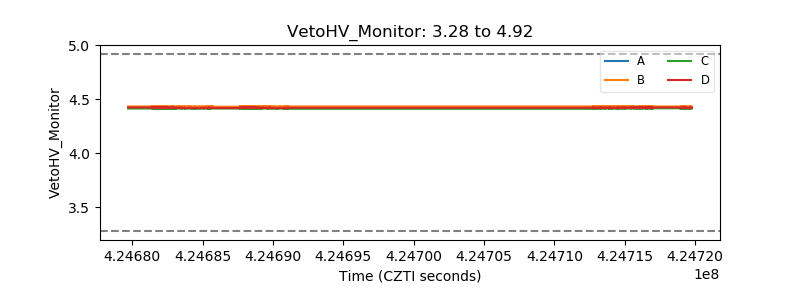 |
| Veto LLD | 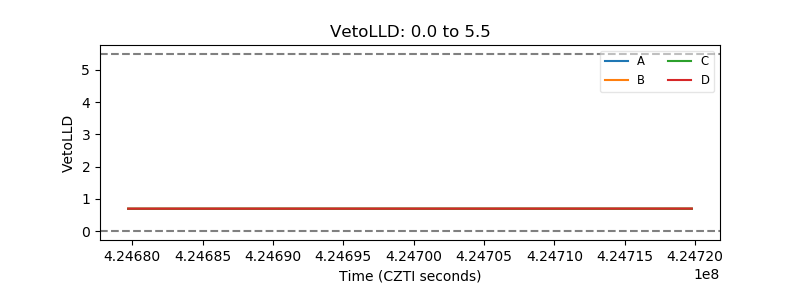 |
| Alpha Counter | 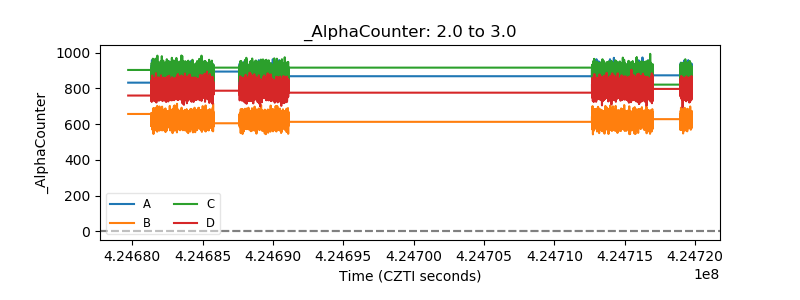 |
| _CPM_Rate | 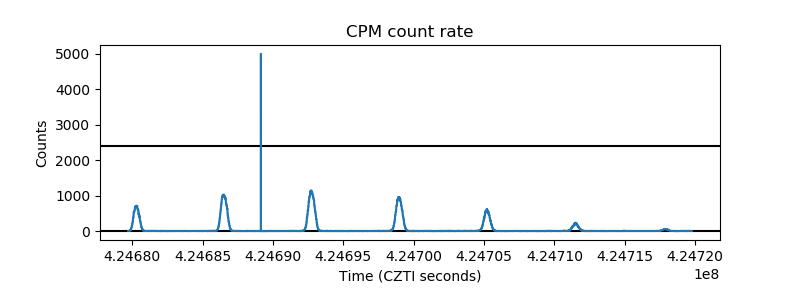 |
| CZT Counter | 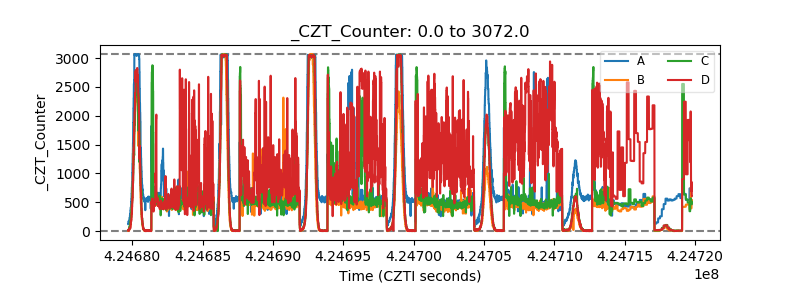 |
| +2.5 Volts monitor | 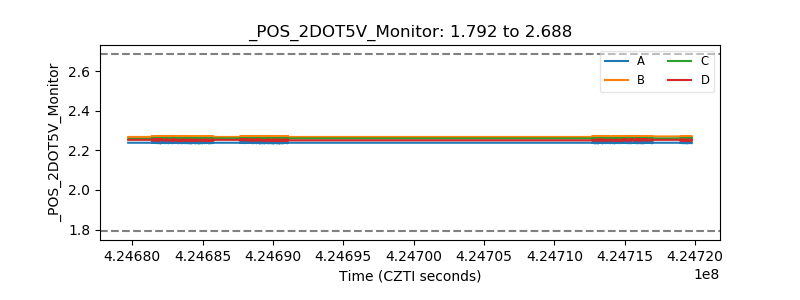 |
| +5 Volts monitor | 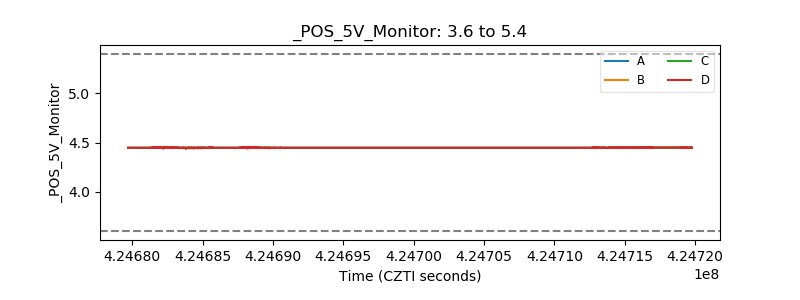 |
| _ROLL_ROT | 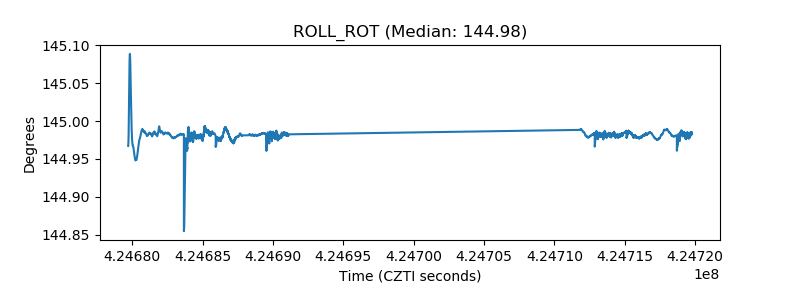 |
| _Roll_DEC | 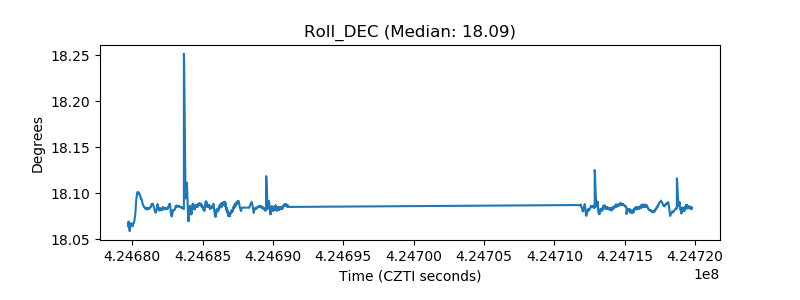 |
| _Roll_RA | 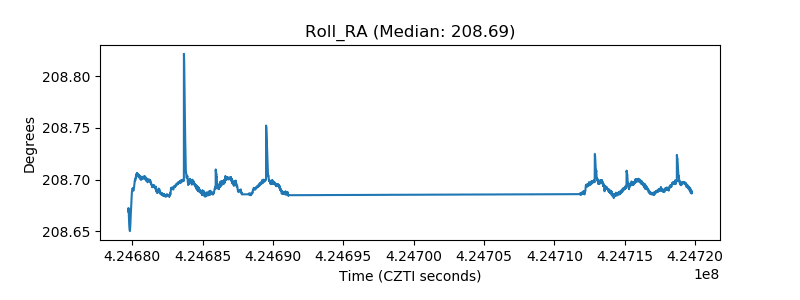 |
| Veto Counter | 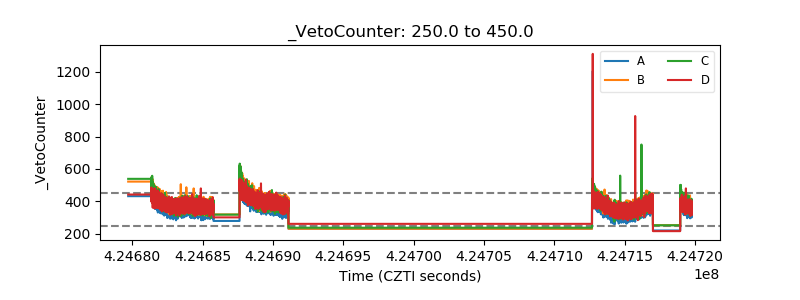 |