| Param | Original file | Final file |
|---|---|---|
| Filename | modeM0/AS1A12_077T11_9000005696_41739cztM0_level2.fits | modeM0/AS1A12_077T11_9000005696_41739cztM0_level2_quad_clean.evt |
| Size (bytes) | 440,458,560 | 88,807,680 |
| Size | 420.1 MB | 84.7 MB |
| Events in quadrant A | 2,887,385 | 608,744 |
| Events in quadrant B | 2,483,038 | 620,569 |
| Events in quadrant C | 3,416,685 | 560,367 |
| Events in quadrant D | 7,090,241 | 514,403 |
| Mode M9 | |||
|---|---|---|---|
| Quadrant | BADHDUFLAG | Total packets | Discarded packets |
| A | 0 | 25 | 0 |
| B | 0 | 25 | 0 |
| C | 0 | 26 | 0 |
| D | 0 | 26 | 0 |
| Mode M0 | |||
|---|---|---|---|
| Quadrant | BADHDUFLAG | Total packets | Discarded packets |
| A | 0 | 11951 | 2 |
| B | 0 | 11314 | 2 |
| C | 0 | 13462 | 2 |
| D | 0 | 24984 | 4 |
| Mode SS | |||
|---|---|---|---|
| Quadrant | BADHDUFLAG | Total packets | Discarded packets |
| A | 0 | 112 | 0 |
| B | 0 | 112 | 0 |
| C | 0 | 112 | 0 |
| D | 0 | 112 | 0 |
| Quadrant | Total seconds | Saturated seconds | Saturation percentage |
|---|---|---|---|
| A | 5499 | 14 | 0.254592% |
| B | 5499 | 22 | 0.400073% |
| C | 5499 | 275 | 5.000909% |
| D | 5498 | 538 | 9.785377% |
Noise dominated data is calculated using 1-second bins in cleaned event files. If a bin has >2000 counts, and if more than 50% of those come from <1% of pixels, then it is considered to be noise-dominated and hence unusable.
| Quadrant | # 1 sec bins | Bins with >0 counts | Bins with >2000 counts | High rate bins dominated by noise | Noise dominated (total time) | Noise dominated (detector-on time) | Marked lightcurve |
|---|---|---|---|---|---|---|---|
| A | 7080 | 5499 | 4 | 4 | 0.06% | 0.07% | 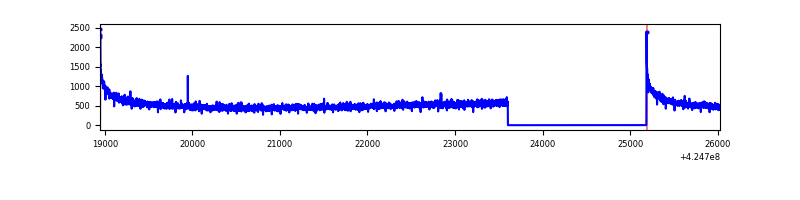 |
| B | 7080 | 5498 | 8 | 8 | 0.11% | 0.15% | 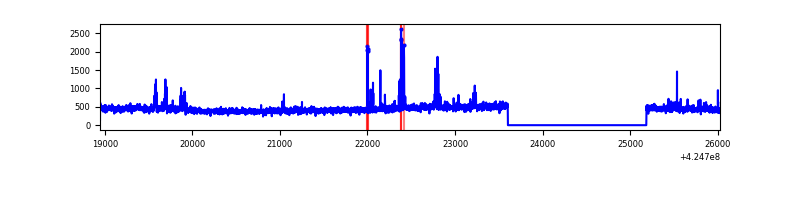 |
| C | 7080 | 5498 | 268 | 268 | 3.79% | 4.87% | 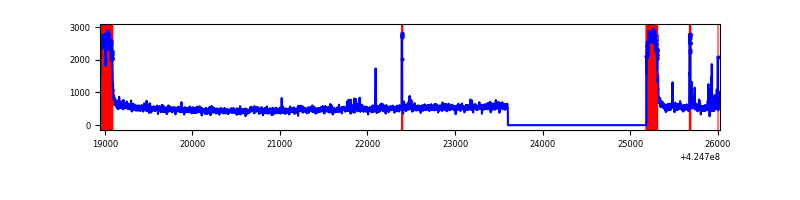 |
| D | 7079 | 5497 | 756 | 756 | 10.68% | 13.75% | 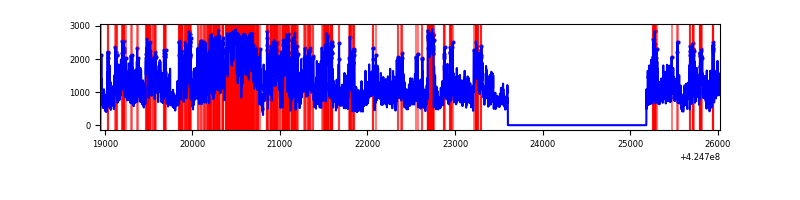 |
Top three noisy pixels from each quadrant. If the there are fewer than three noisy pixels in the level2.evt file, extra rows are filled as -1
| Pixel properties | Quadrant properties | ||||||
|---|---|---|---|---|---|---|---|
| Quadrant | DetID | PixID | Counts | Sigma | Mean | Median | Sigma |
| A | 10 | 83 | 549957 | 4439.98 | 602 | 589 | 123.7 |
| A | 13 | 254 | 7953 | 59.52 | 602 | 589 | 123.7 |
| A | 3 | 137 | 6654 | 49.02 | 602 | 589 | 123.7 |
| B | 5 | 255 | 75157 | 638.98 | 594 | 578 | 116.7 |
| B | 0 | 245 | 42421 | 358.5 | 594 | 578 | 116.7 |
| B | 12 | 111 | 14749 | 121.41 | 594 | 578 | 116.7 |
| C | 0 | 10 | 913933 | 6875.52 | 562 | 564 | 132.8 |
| C | 15 | 214 | 217749 | 1634.89 | 562 | 564 | 132.8 |
| C | 14 | 254 | 79128 | 591.4 | 562 | 564 | 132.8 |
| D | 12 | 79 | 4348824 | 30956.8 | 568 | 553 | 140.5 |
| D | 2 | 249 | 399513 | 2840.33 | 568 | 553 | 140.5 |
| D | 1 | 47 | 39540 | 277.56 | 568 | 553 | 140.5 |
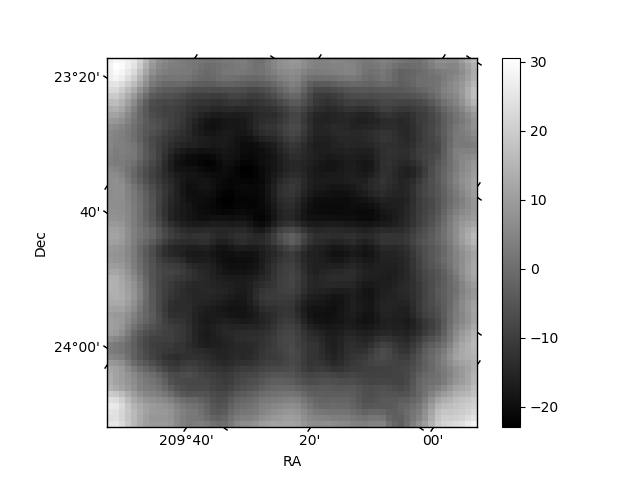
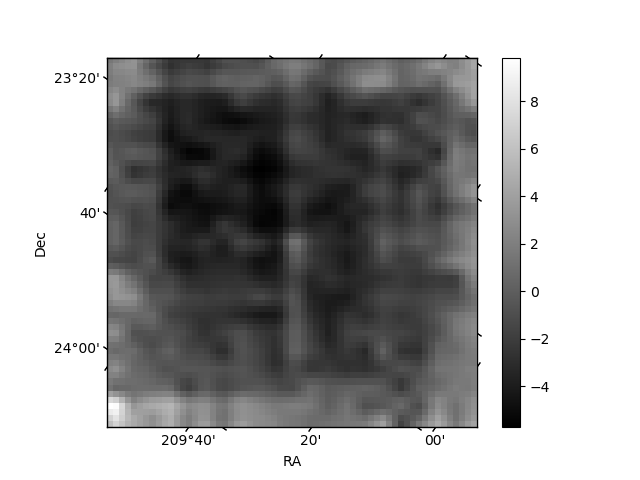
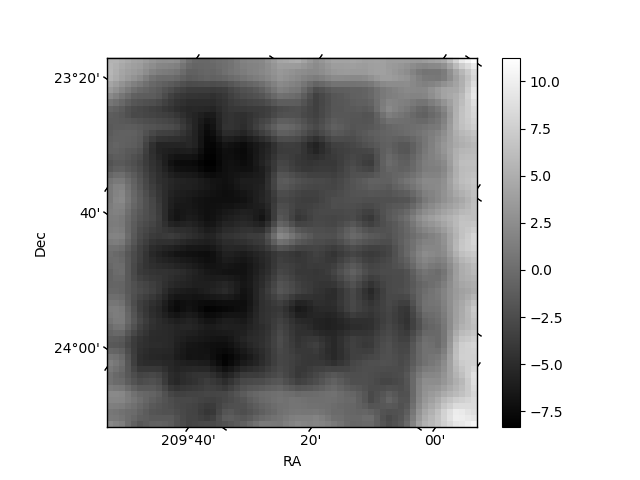
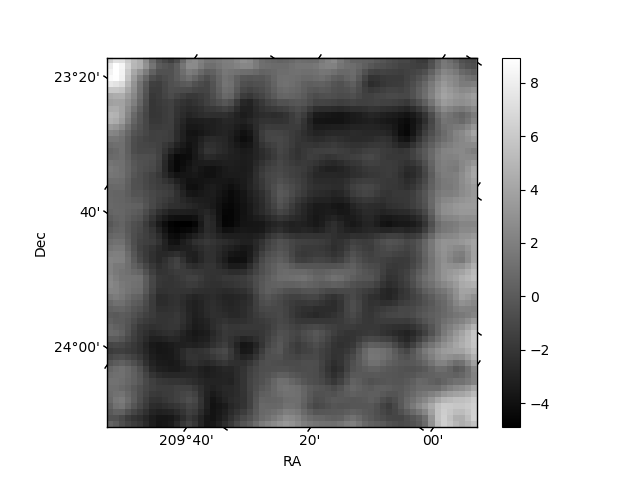
Histogram calculated using DETX and DETY for each event in the final _common_clean file
| Quadrant A | 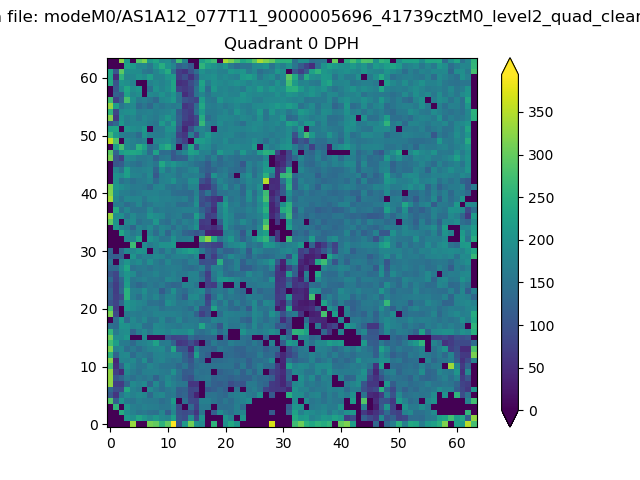 |
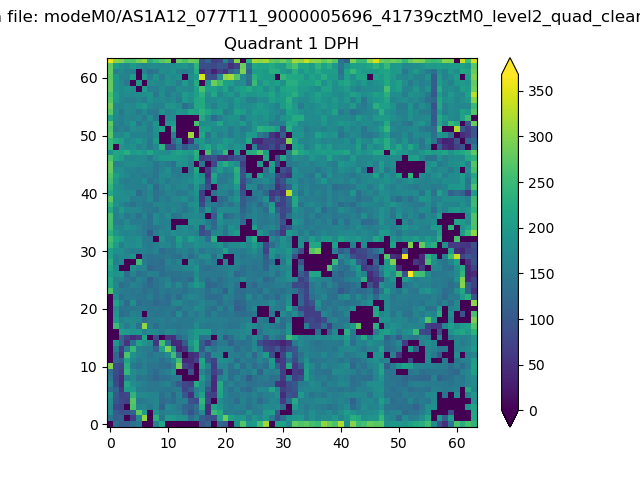 |
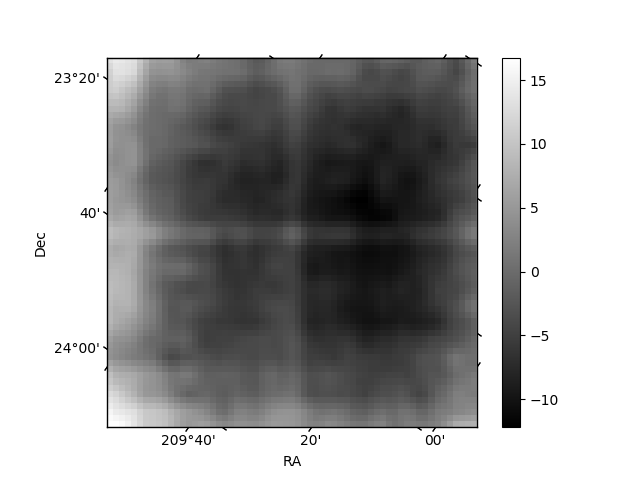
Quadrant B |
|---|---|---|---|
| Quadrant D | 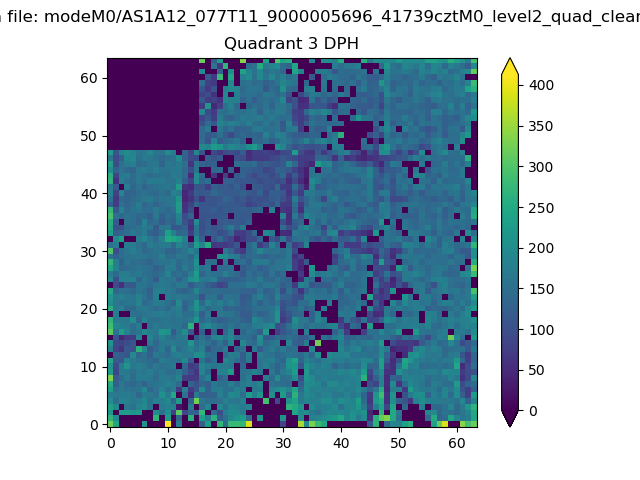 |
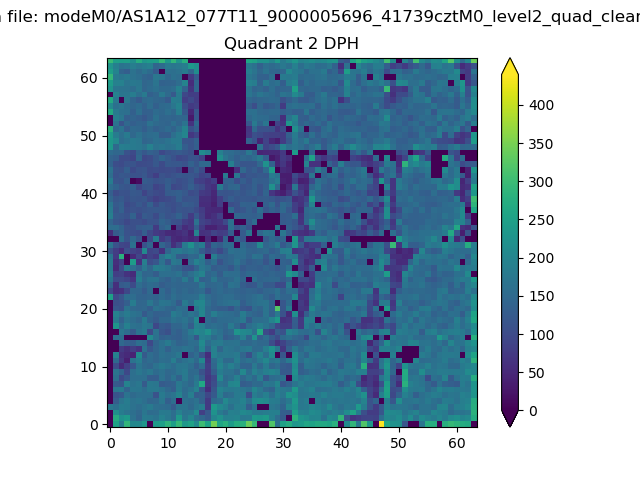 |
Quadrant C |
| Plot type | Count rate plots | Images |
|---|---|---|
| Comparison with Poisson distribution Blue bars denote a histogram of data divided into 1 sec bins. Red curve is a Poisson curve with rate = median count rate of data. |
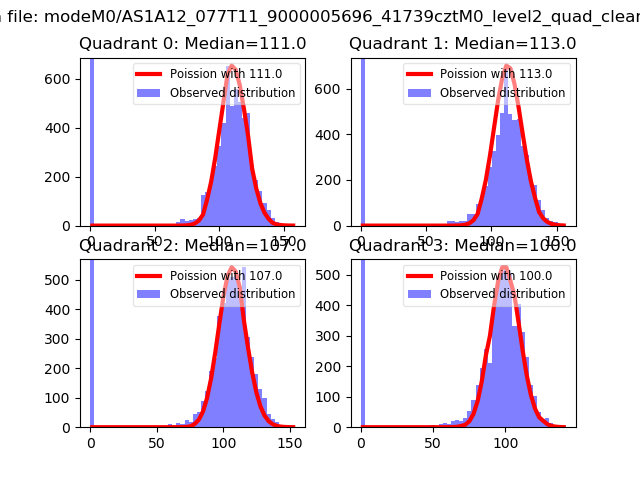 |
 |
| Quadrant-wise count rates Data is divided into 100 sec bins |
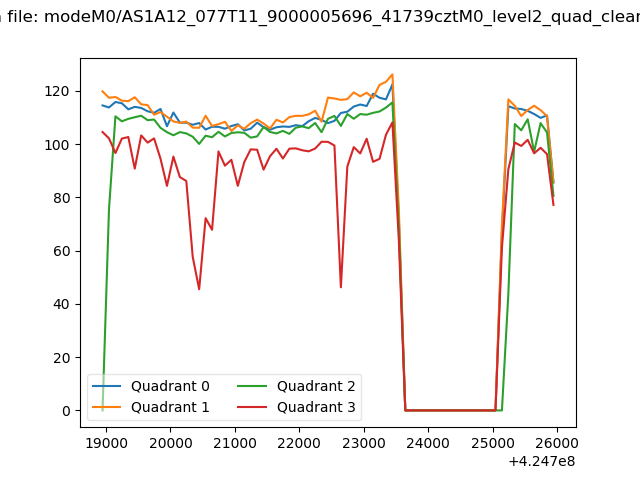 |
|
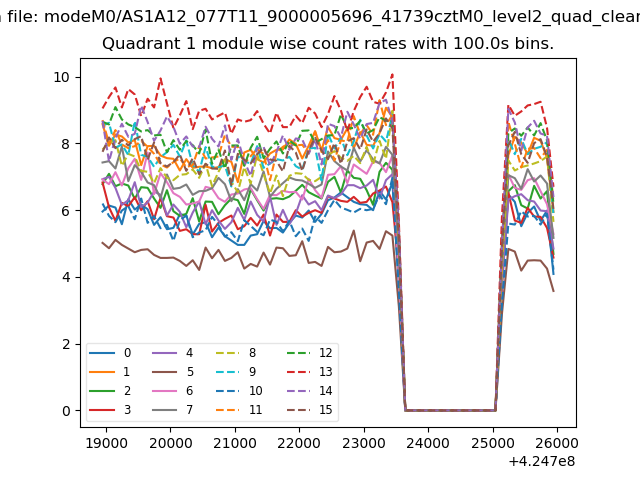
| Module-wise count rates for Quadrant A Data is divided into 100 sec bins |
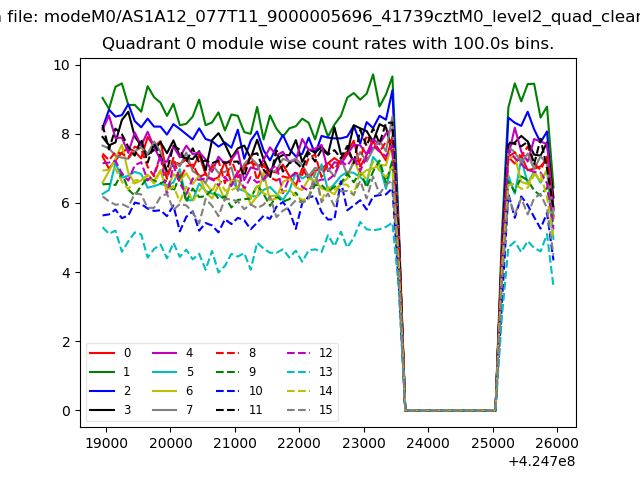 |
 |
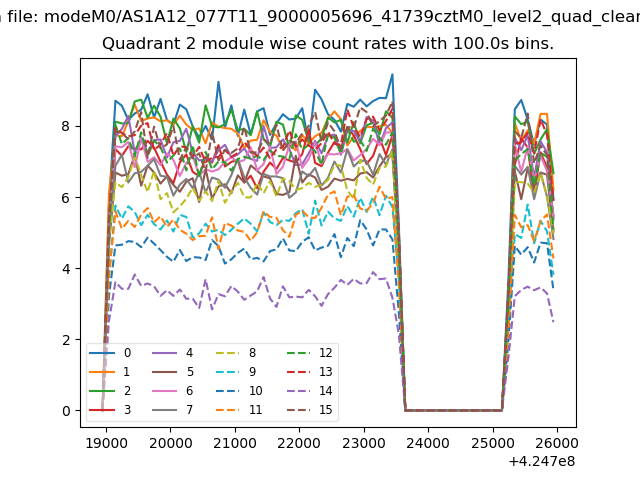
| Module-wise count rates for Quadrant B Data is divided into 100 sec bins |
 |
 |
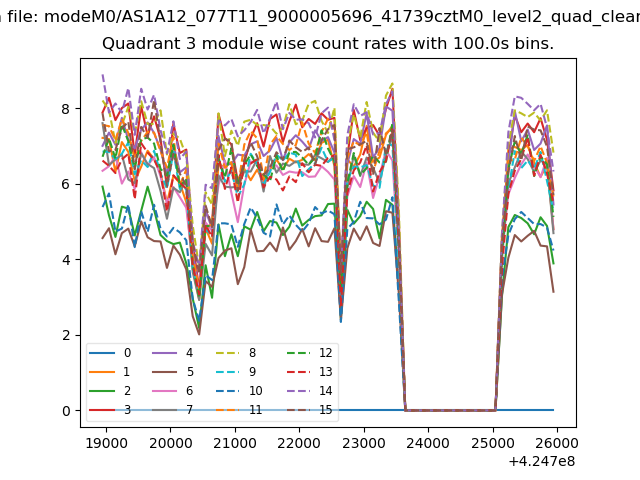
| Module-wise count rates for Quadrant C Data is divided into 100 sec bins |
 |
 |
| Module-wise count rates for Quadrant D Data is divided into 100 sec bins |
 |
 |
| Parameter | Plot |
|---|---|
| CZT HV Monitor | 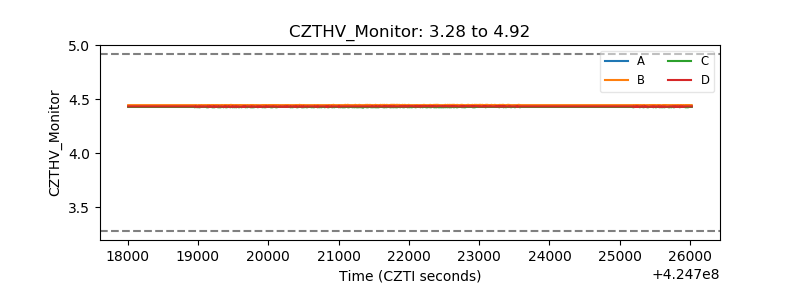 |
| D_VDD | 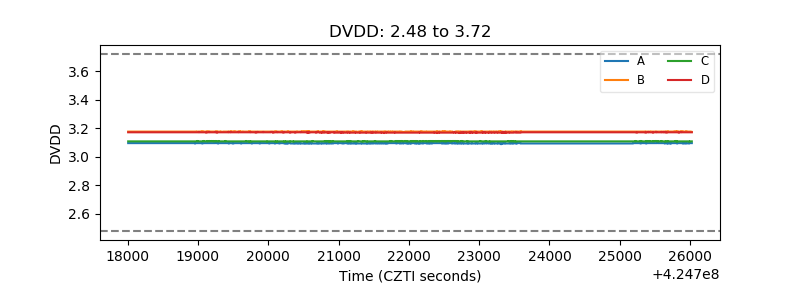 |
| Temperature 1 | 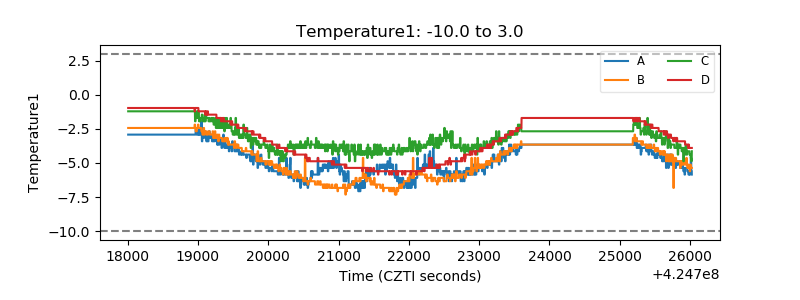 |
| Veto HV Monitor | 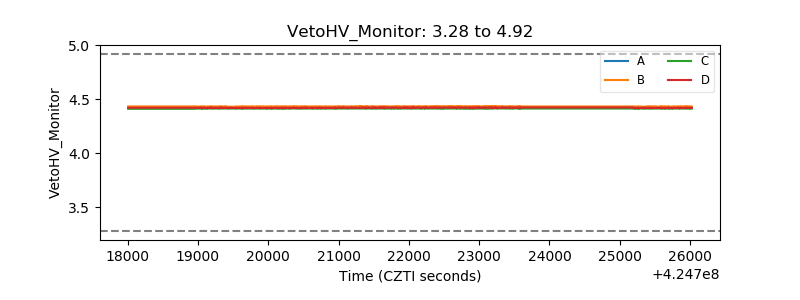 |
| Veto LLD | 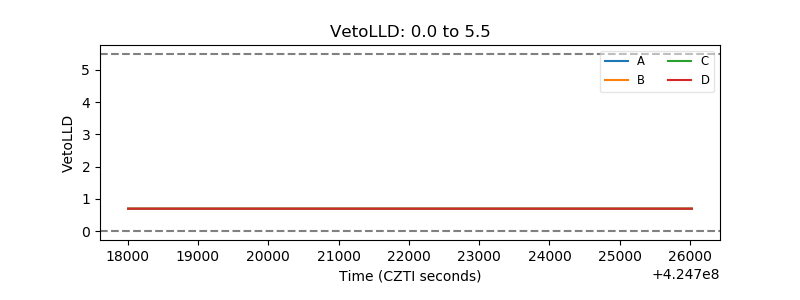 |
| Alpha Counter | 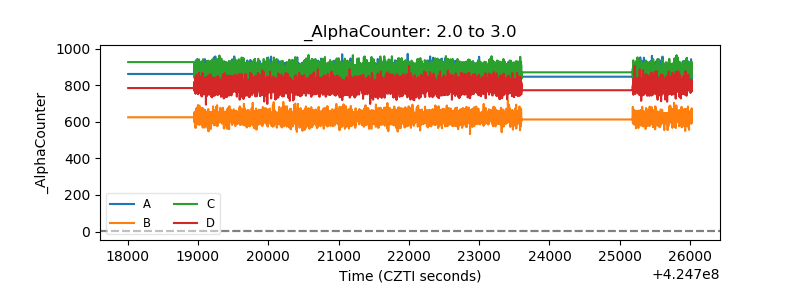 |
| _CPM_Rate | 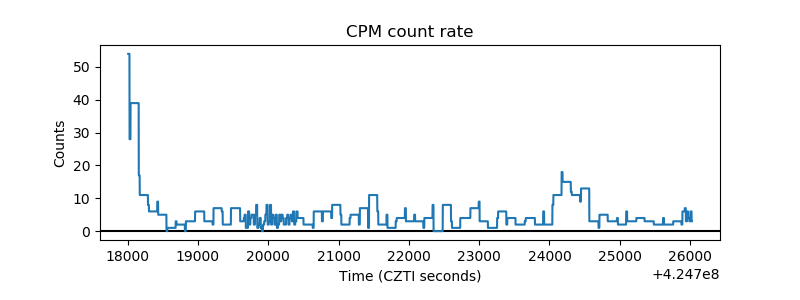 |
| CZT Counter | 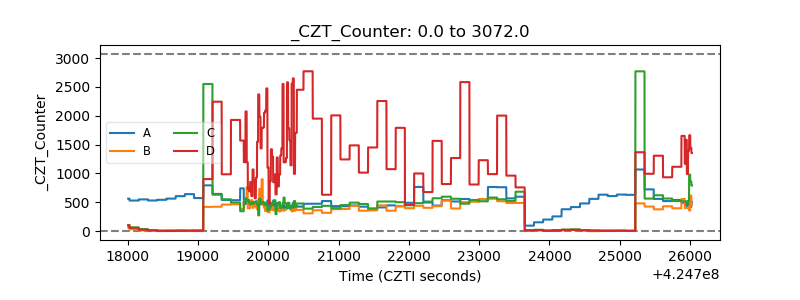 |
| +2.5 Volts monitor | 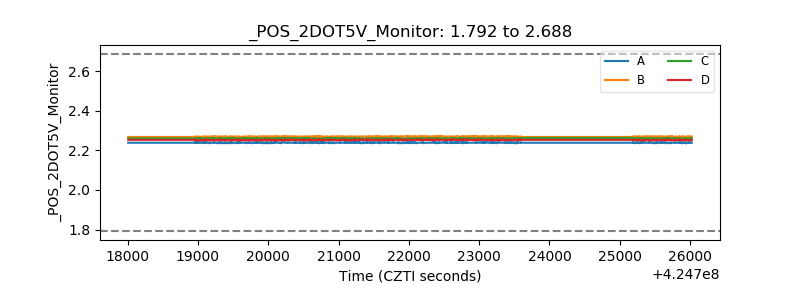 |
| +5 Volts monitor | 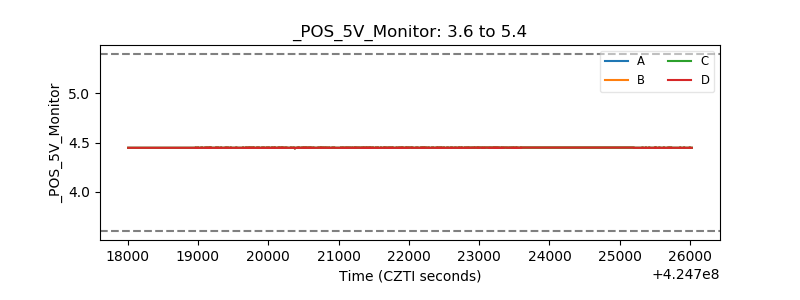 |
| _ROLL_ROT | 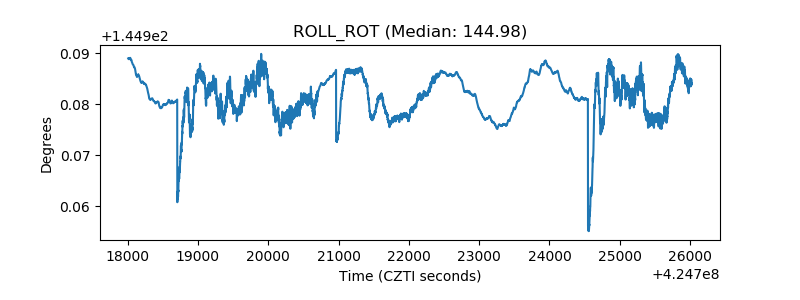 |
| _Roll_DEC | 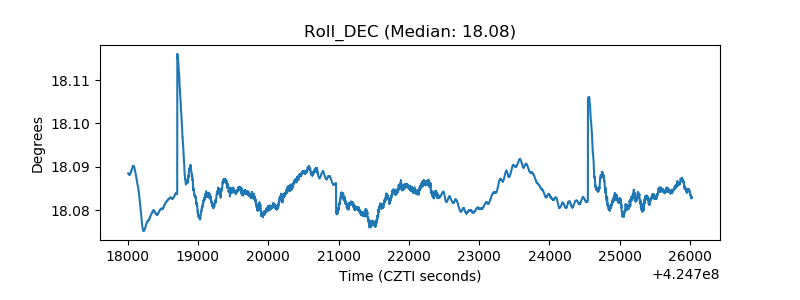 |
| _Roll_RA | 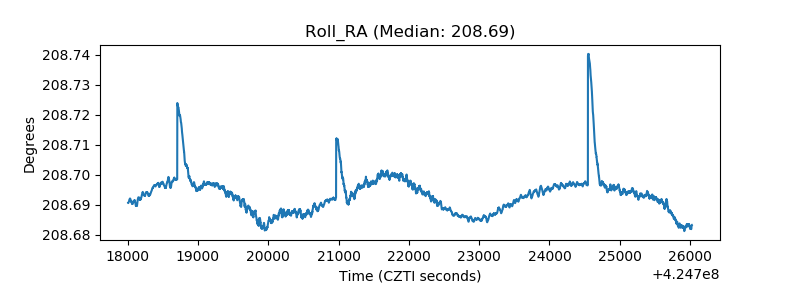 |
| Veto Counter | 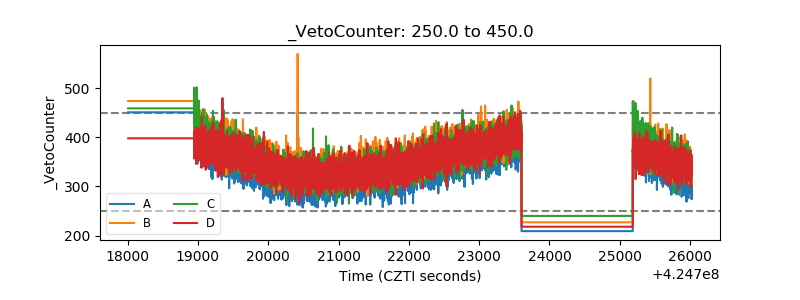 |