| Param | Original file | Final file |
|---|---|---|
| Filename | modeM0/AS1A12_077T11_9000005696_41740cztM0_level2.fits | modeM0/AS1A12_077T11_9000005696_41740cztM0_level2_quad_clean.evt |
| Size (bytes) | 395,565,120 | 92,819,520 |
| Size | 377.2 MB | 88.5 MB |
| Events in quadrant A | 3,197,574 | 623,697 |
| Events in quadrant B | 2,713,832 | 638,187 |
| Events in quadrant C | 3,769,947 | 583,664 |
| Events in quadrant D | 4,512,313 | 561,236 |
| Mode M9 | |||
|---|---|---|---|
| Quadrant | BADHDUFLAG | Total packets | Discarded packets |
| A | 0 | 24 | 0 |
| B | 0 | 25 | 0 |
| C | 0 | 25 | 0 |
| D | 0 | 25 | 0 |
| Mode M0 | |||
|---|---|---|---|
| Quadrant | BADHDUFLAG | Total packets | Discarded packets |
| A | 0 | 13043 | 2 |
| B | 0 | 12092 | 2 |
| C | 0 | 14763 | 2 |
| D | 0 | 17473 | 2 |
| Mode SS | |||
|---|---|---|---|
| Quadrant | BADHDUFLAG | Total packets | Discarded packets |
| A | 0 | 118 | 0 |
| B | 0 | 118 | 0 |
| C | 0 | 118 | 0 |
| D | 0 | 118 | 0 |
| Quadrant | Total seconds | Saturated seconds | Saturation percentage |
|---|---|---|---|
| A | 5775 | 83 | 1.437229% |
| B | 5775 | 39 | 0.675325% |
| C | 5774 | 288 | 4.987877% |
| D | 5774 | 113 | 1.957049% |
Noise dominated data is calculated using 1-second bins in cleaned event files. If a bin has >2000 counts, and if more than 50% of those come from <1% of pixels, then it is considered to be noise-dominated and hence unusable.
| Quadrant | # 1 sec bins | Bins with >0 counts | Bins with >2000 counts | High rate bins dominated by noise | Noise dominated (total time) | Noise dominated (detector-on time) | Marked lightcurve |
|---|---|---|---|---|---|---|---|
| A | 7117 | 5776 | 79 | 79 | 1.11% | 1.37% | 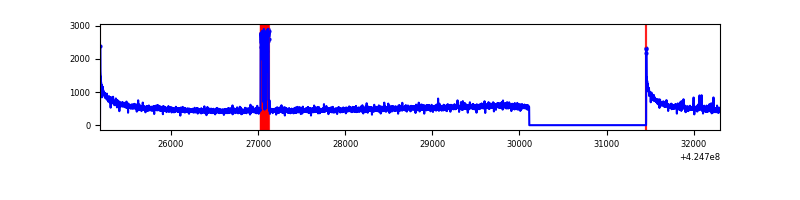 |
| B | 7116 | 5774 | 25 | 25 | 0.35% | 0.43% | 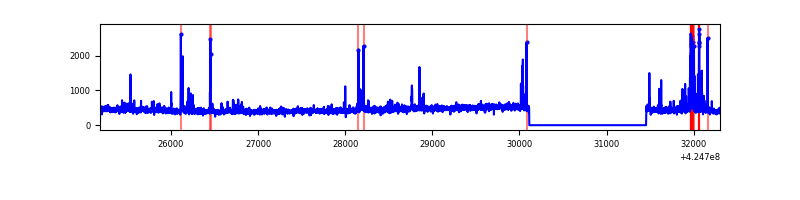 |
| C | 7115 | 5773 | 287 | 287 | 4.03% | 4.97% | 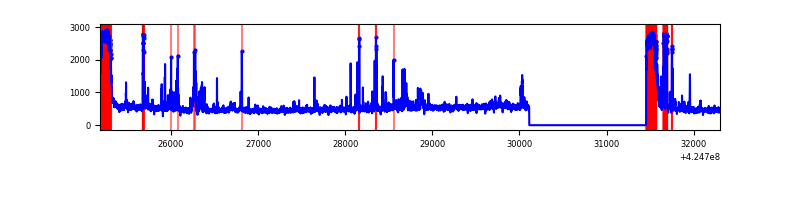 |
| D | 7115 | 5773 | 161 | 161 | 2.26% | 2.79% | 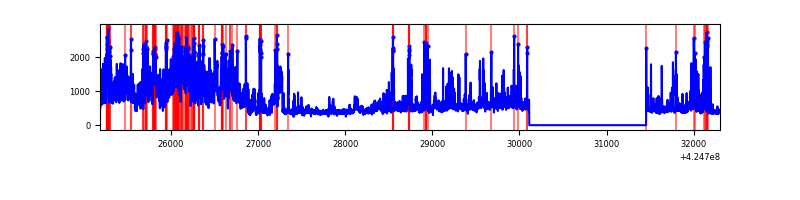 |
Top three noisy pixels from each quadrant. If the there are fewer than three noisy pixels in the level2.evt file, extra rows are filled as -1
| Pixel properties | Quadrant properties | ||||||
|---|---|---|---|---|---|---|---|
| Quadrant | DetID | PixID | Counts | Sigma | Mean | Median | Sigma |
| A | 10 | 83 | 552744 | 4250.25 | 626 | 613 | 129.9 |
| A | 15 | 223 | 209674 | 1609.33 | 626 | 613 | 129.9 |
| A | 13 | 6 | 8806 | 63.07 | 626 | 613 | 129.9 |
| B | 5 | 255 | 169804 | 1368.94 | 626 | 608 | 123.6 |
| B | 0 | 245 | 42098 | 335.69 | 626 | 608 | 123.6 |
| B | 12 | 111 | 15734 | 122.38 | 626 | 608 | 123.6 |
| C | 0 | 10 | 814856 | 5858.73 | 592 | 597 | 139.0 |
| C | 14 | 254 | 383073 | 2751.98 | 592 | 597 | 139.0 |
| C | 15 | 214 | 229499 | 1646.99 | 592 | 597 | 139.0 |
| D | 12 | 79 | 1588729 | 10512.76 | 609 | 594 | 151.1 |
| D | 2 | 249 | 403110 | 2664.48 | 609 | 594 | 151.1 |
| D | 1 | 47 | 45327 | 296.11 | 609 | 594 | 151.1 |
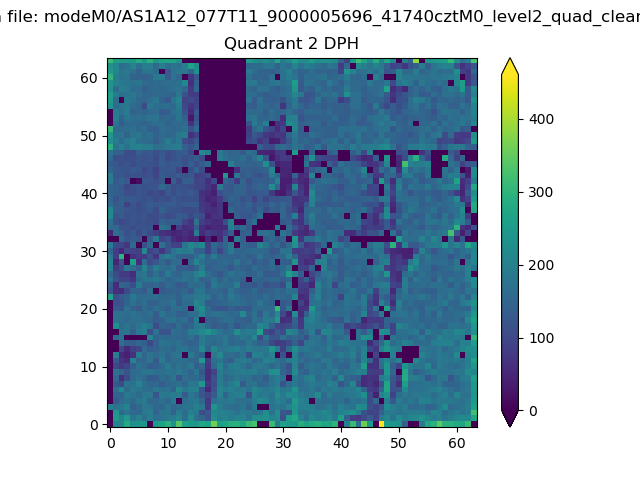
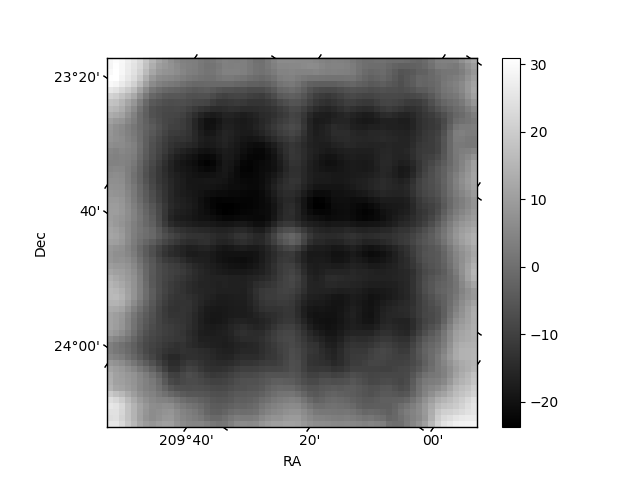
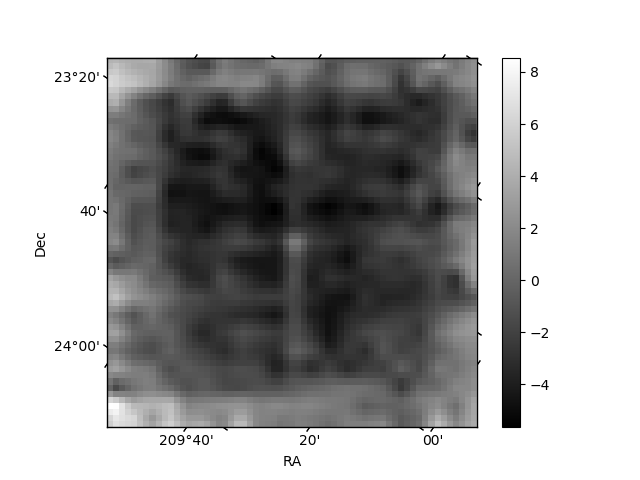
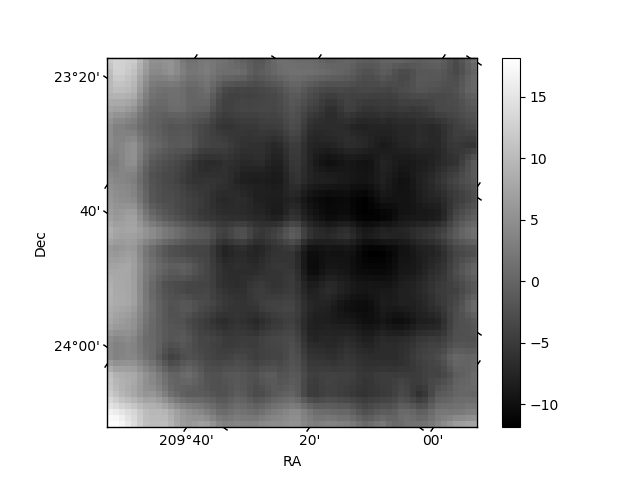
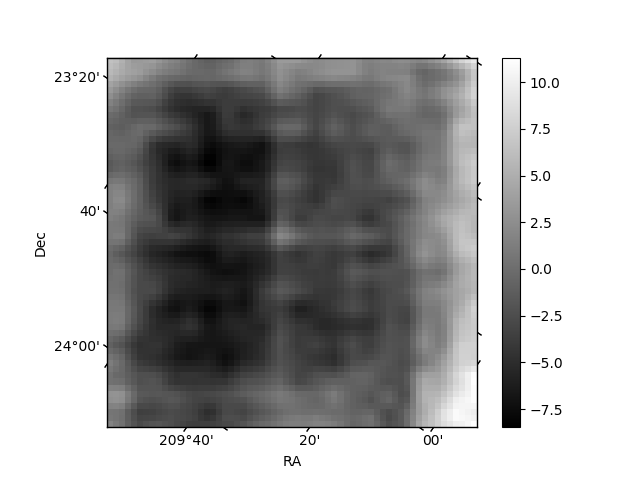
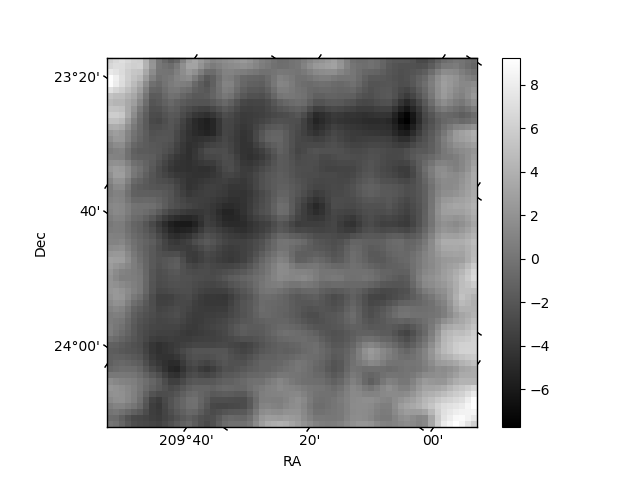
Histogram calculated using DETX and DETY for each event in the final _common_clean file
| Quadrant A | 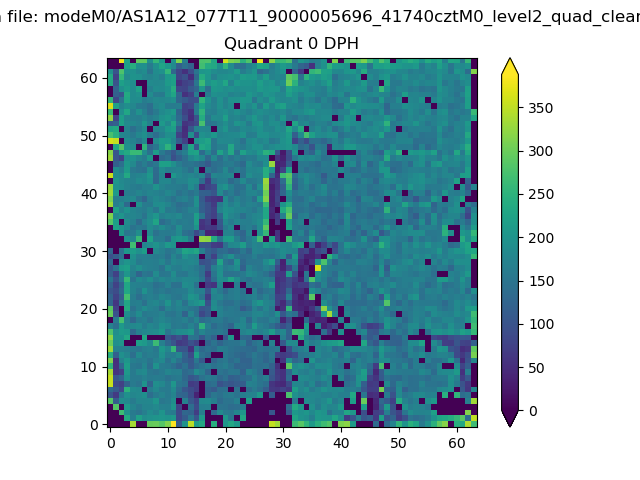 |
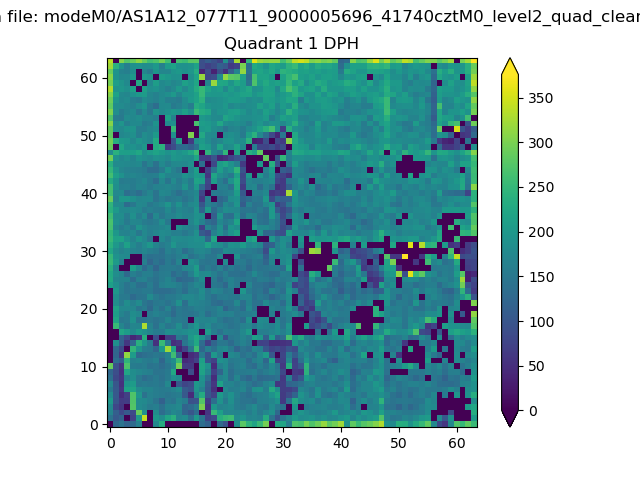 |
Quadrant B |
|---|---|---|---|
| Quadrant D | 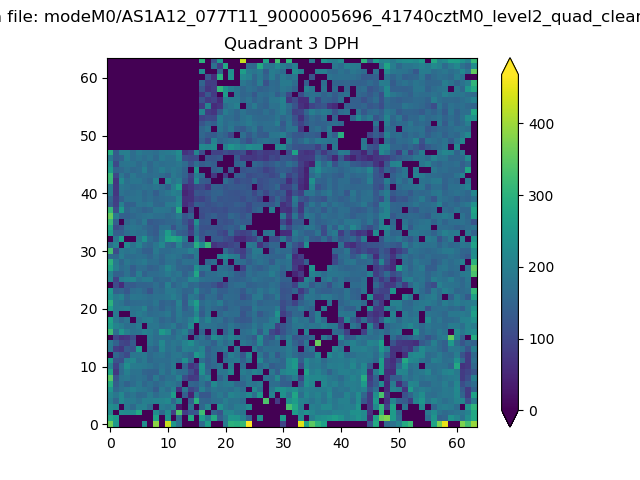 |
 |
Quadrant C |
| Plot type | Count rate plots | Images |
|---|---|---|
| Comparison with Poisson distribution Blue bars denote a histogram of data divided into 1 sec bins. Red curve is a Poisson curve with rate = median count rate of data. |
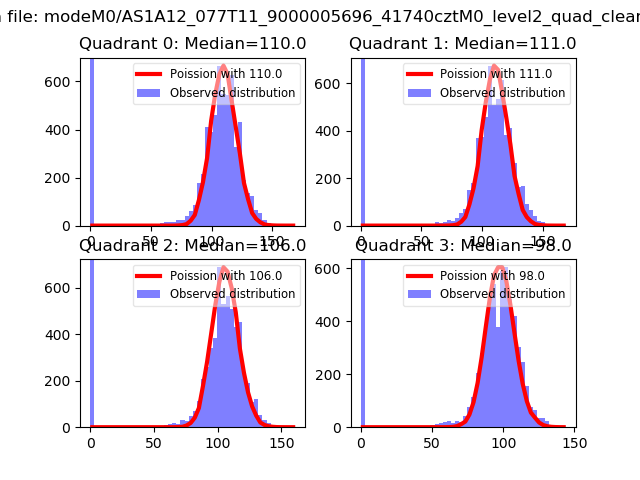 |
 |
| Quadrant-wise count rates Data is divided into 100 sec bins |
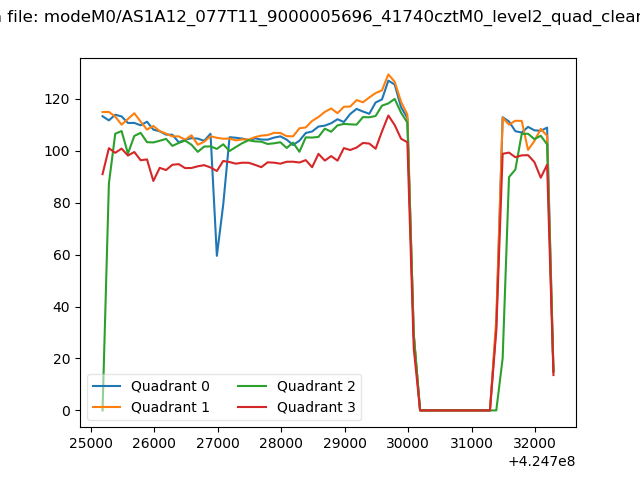 |
|
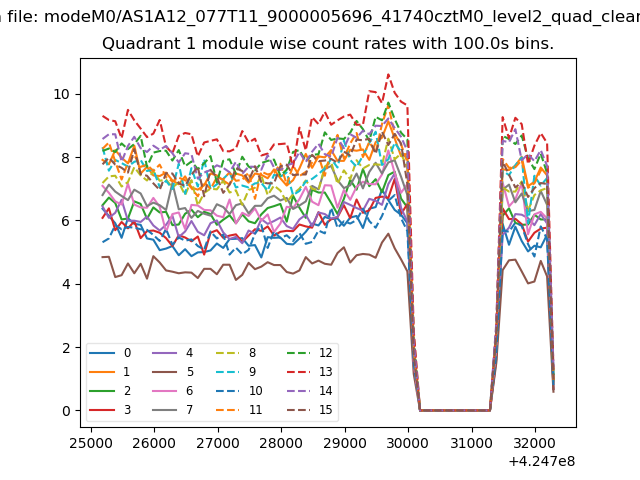
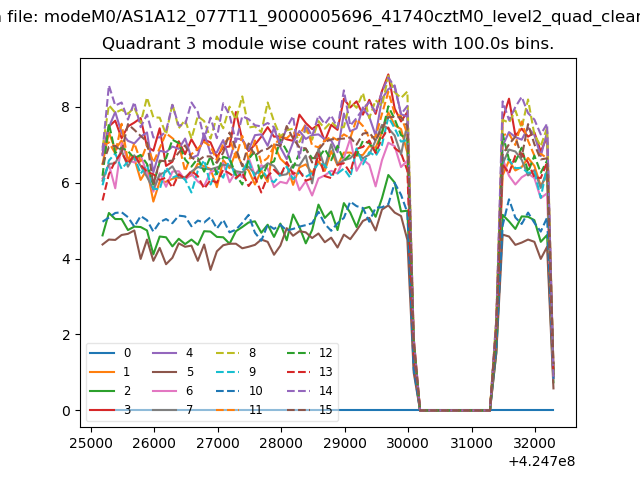
| Module-wise count rates for Quadrant A Data is divided into 100 sec bins |
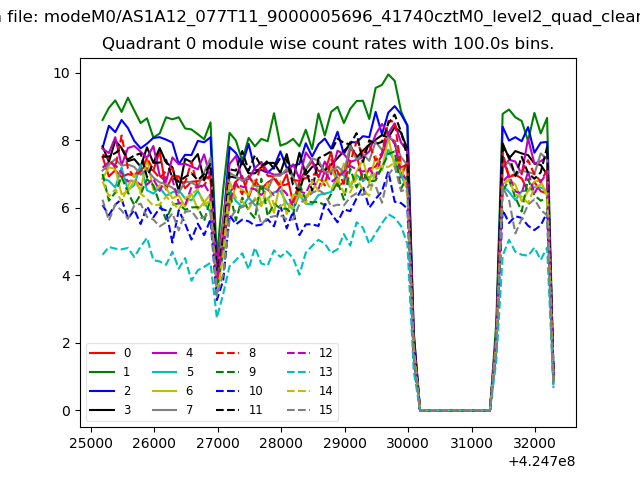 |
 |
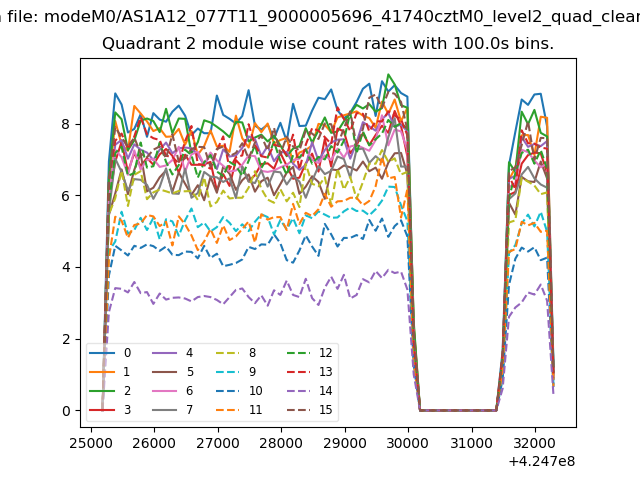
| Module-wise count rates for Quadrant B Data is divided into 100 sec bins |
 |
 |
| Module-wise count rates for Quadrant C Data is divided into 100 sec bins |
 |
 |
| Module-wise count rates for Quadrant D Data is divided into 100 sec bins |
 |
 |
| Parameter | Plot |
|---|---|
| CZT HV Monitor | 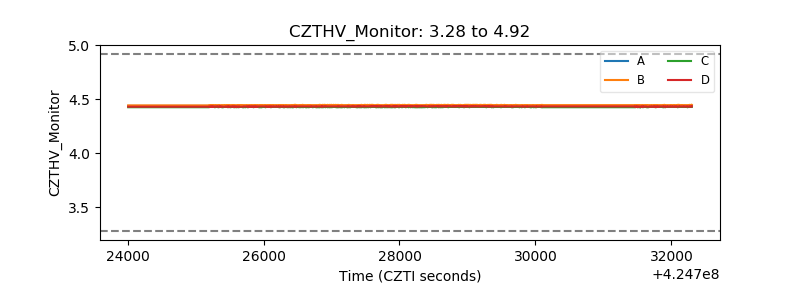 |
| D_VDD | 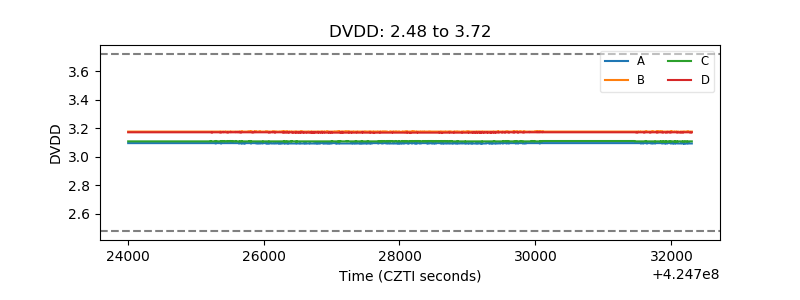 |
| Temperature 1 | 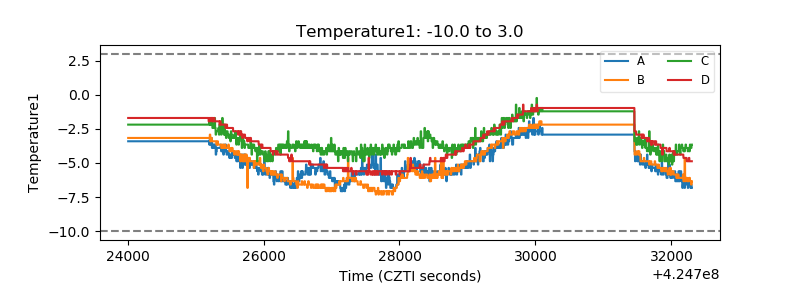 |
| Veto HV Monitor | 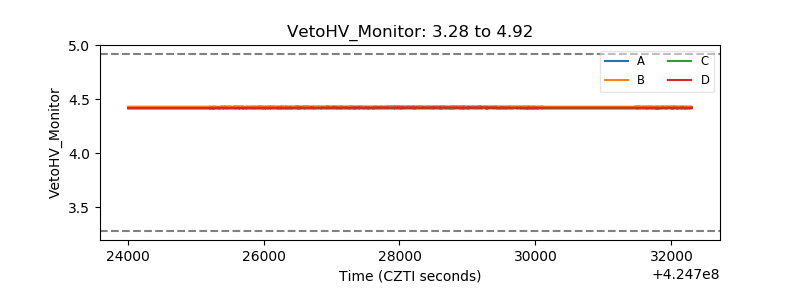 |
| Veto LLD | 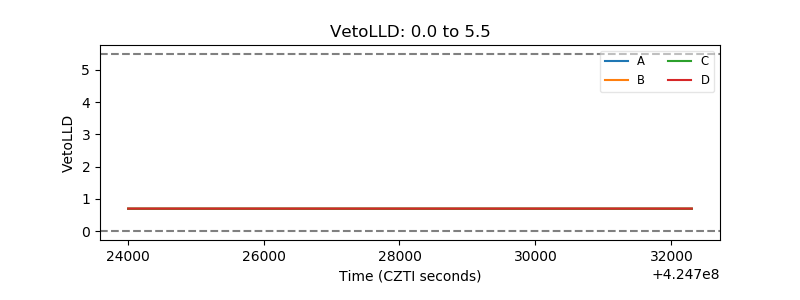 |
| Alpha Counter | 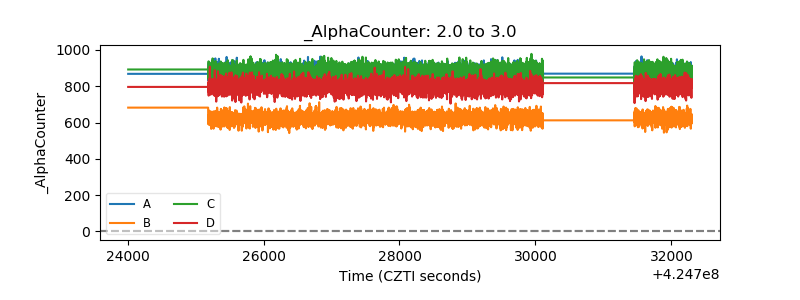 |
| _CPM_Rate | 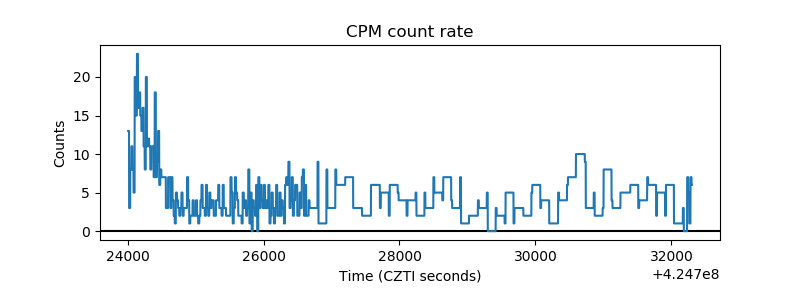 |
| CZT Counter | 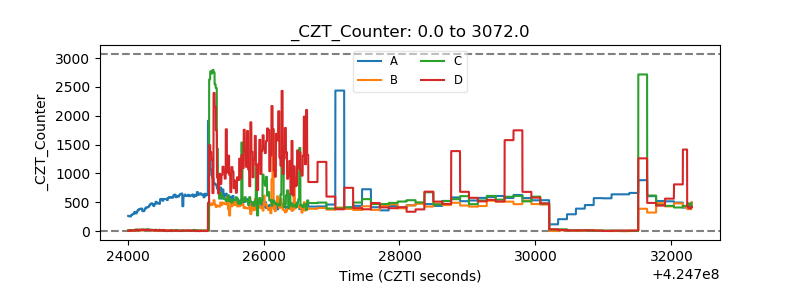 |
| +2.5 Volts monitor | 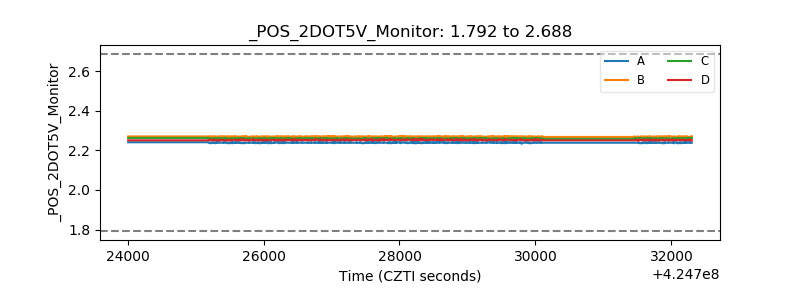 |
| +5 Volts monitor | 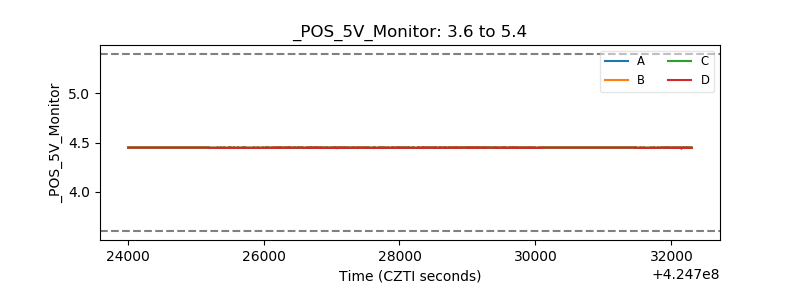 |
| _ROLL_ROT | 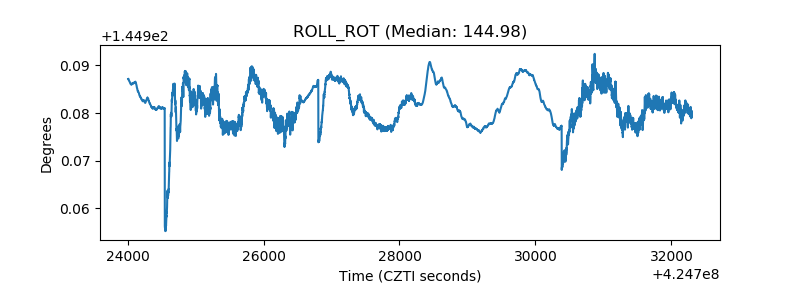 |
| _Roll_DEC | 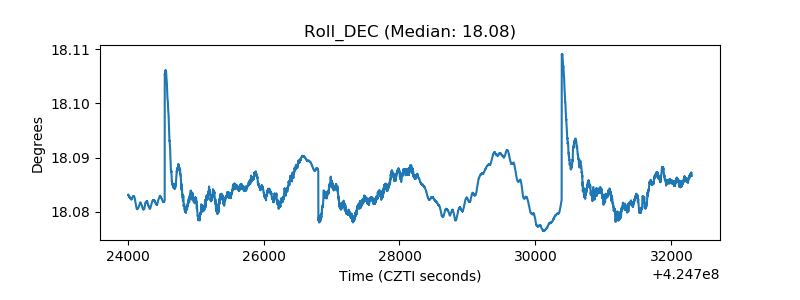 |
| _Roll_RA | 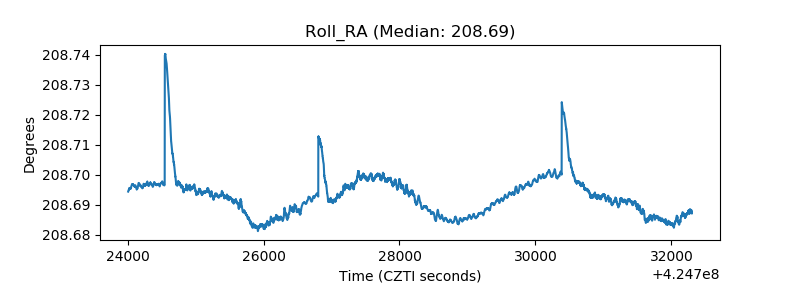 |
| Veto Counter |  |