| Param | Original file | Final file |
|---|---|---|
| Filename | modeM0/AS1A12_077T11_9000005696_41745cztM0_level2.fits | modeM0/AS1A12_077T11_9000005696_41745cztM0_level2_quad_clean.evt |
| Size (bytes) | 449,035,200 | 95,336,640 |
| Size | 428.2 MB | 90.9 MB |
| Events in quadrant A | 3,262,502 | 649,740 |
| Events in quadrant B | 2,782,648 | 669,966 |
| Events in quadrant C | 3,854,163 | 605,013 |
| Events in quadrant D | 6,262,657 | 547,872 |
| Mode M9 | |||
|---|---|---|---|
| Quadrant | BADHDUFLAG | Total packets | Discarded packets |
| A | 0 | 32 | 0 |
| B | 0 | 32 | 0 |
| C | 0 | 32 | 0 |
| D | 0 | 32 | 0 |
| Mode M0 | |||
|---|---|---|---|
| Quadrant | BADHDUFLAG | Total packets | Discarded packets |
| A | 0 | 13061 | 2 |
| B | 0 | 12242 | 2 |
| C | 0 | 15125 | 2 |
| D | 0 | 22835 | 6 |
| Mode SS | |||
|---|---|---|---|
| Quadrant | BADHDUFLAG | Total packets | Discarded packets |
| A | 0 | 124 | 0 |
| B | 0 | 124 | 0 |
| C | 0 | 124 | 0 |
| D | 0 | 124 | 0 |
| Quadrant | Total seconds | Saturated seconds | Saturation percentage |
|---|---|---|---|
| A | 5922 | 15 | 0.253293% |
| B | 5922 | 23 | 0.388382% |
| C | 5923 | 271 | 4.575384% |
| D | 5922 | 517 | 8.730159% |
Noise dominated data is calculated using 1-second bins in cleaned event files. If a bin has >2000 counts, and if more than 50% of those come from <1% of pixels, then it is considered to be noise-dominated and hence unusable.
| Quadrant | # 1 sec bins | Bins with >0 counts | Bins with >2000 counts | High rate bins dominated by noise | Noise dominated (total time) | Noise dominated (detector-on time) | Marked lightcurve |
|---|---|---|---|---|---|---|---|
| A | 9118 | 5924 | 5 | 5 | 0.05% | 0.08% |  |
| B | 9118 | 5922 | 12 | 12 | 0.13% | 0.20% |  |
| C | 9119 | 5923 | 254 | 254 | 2.79% | 4.29% |  |
| D | 9118 | 5922 | 528 | 528 | 5.79% | 8.92% | 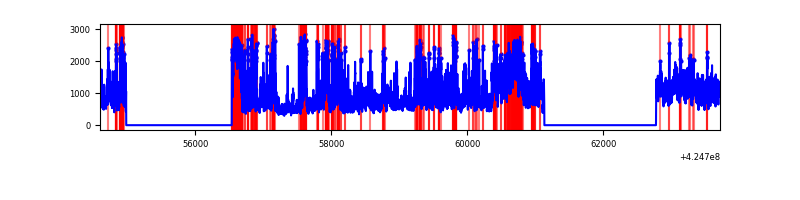 |
Top three noisy pixels from each quadrant. If the there are fewer than three noisy pixels in the level2.evt file, extra rows are filled as -1
| Pixel properties | Quadrant properties | ||||||
|---|---|---|---|---|---|---|---|
| Quadrant | DetID | PixID | Counts | Sigma | Mean | Median | Sigma |
| A | 10 | 83 | 580628 | 4190.58 | 668 | 654 | 138.4 |
| A | 15 | 223 | 41787 | 297.21 | 668 | 654 | 138.4 |
| A | 2 | 79 | 21187 | 148.36 | 668 | 654 | 138.4 |
| B | 5 | 255 | 85238 | 650.62 | 660 | 640 | 130.0 |
| B | 0 | 245 | 81821 | 624.34 | 660 | 640 | 130.0 |
| B | 12 | 111 | 16974 | 125.62 | 660 | 640 | 130.0 |
| C | 0 | 10 | 1070636 | 7265.13 | 629 | 632 | 147.3 |
| C | 15 | 214 | 251978 | 1706.59 | 629 | 632 | 147.3 |
| C | 14 | 254 | 71251 | 479.49 | 629 | 632 | 147.3 |
| D | 12 | 79 | 2395222 | 15387.67 | 628 | 610 | 155.6 |
| D | 12 | 6 | 442602 | 2840.22 | 628 | 610 | 155.6 |
| D | 13 | 249 | 359849 | 2308.45 | 628 | 610 | 155.6 |
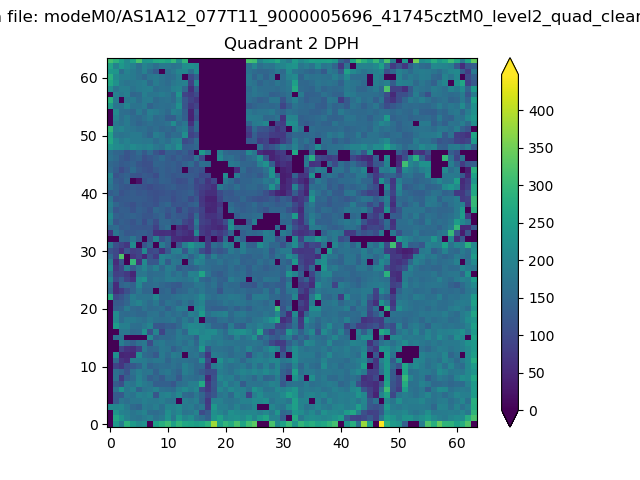
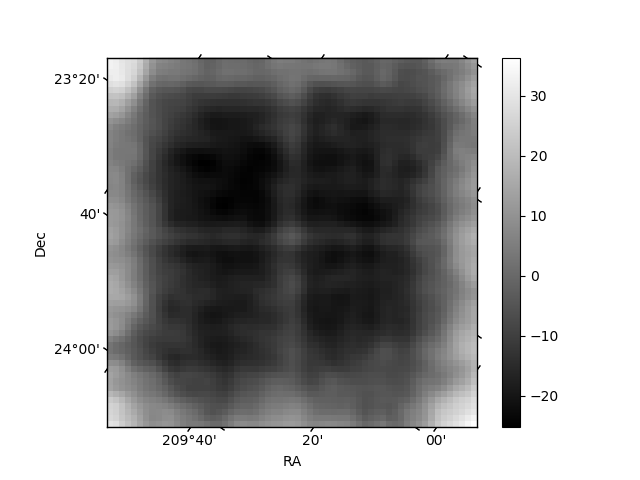
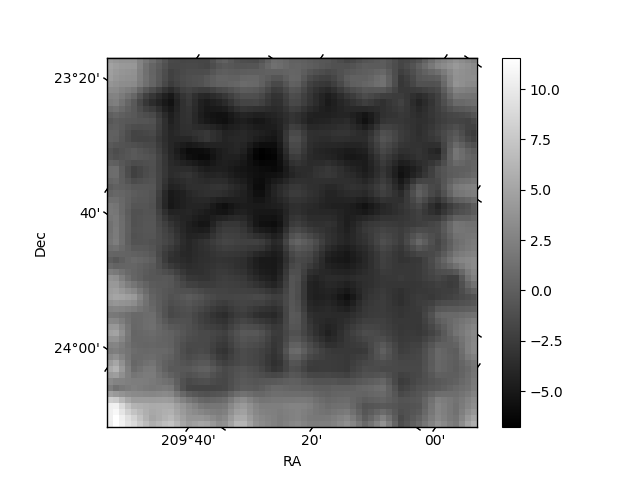
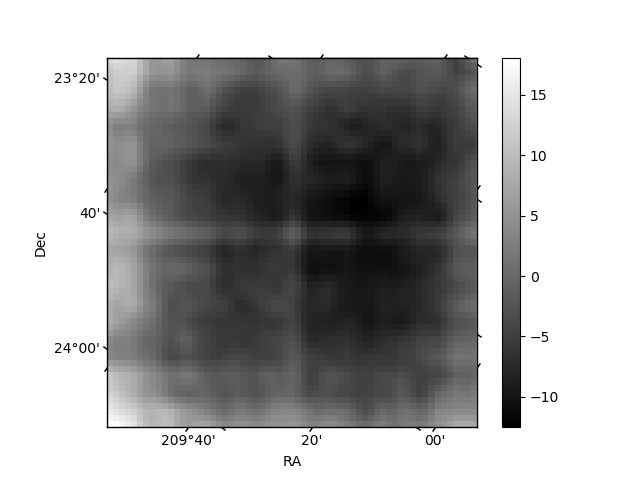
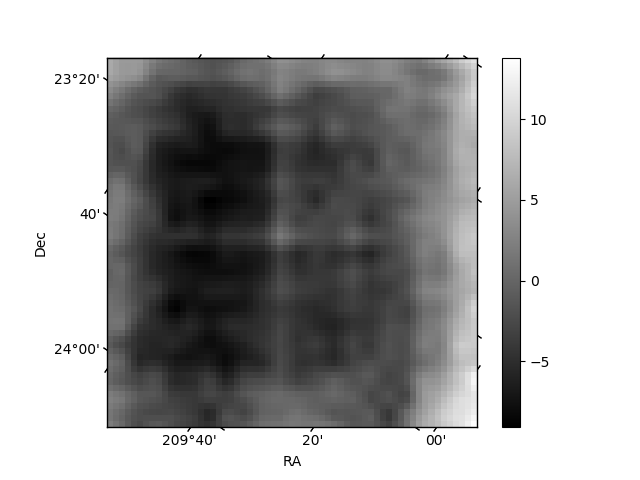
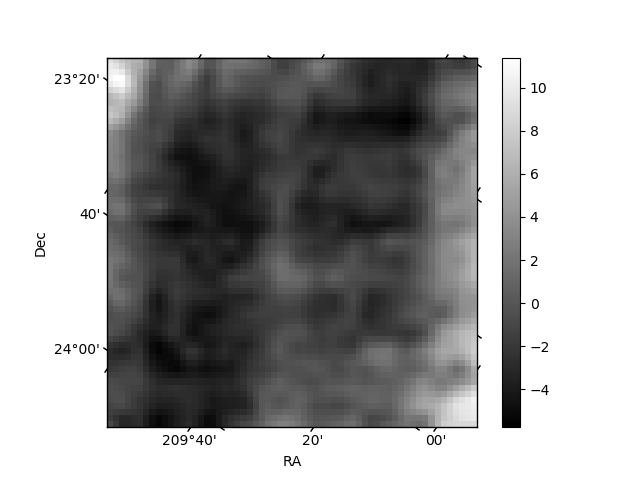
Histogram calculated using DETX and DETY for each event in the final _common_clean file
| Quadrant A | 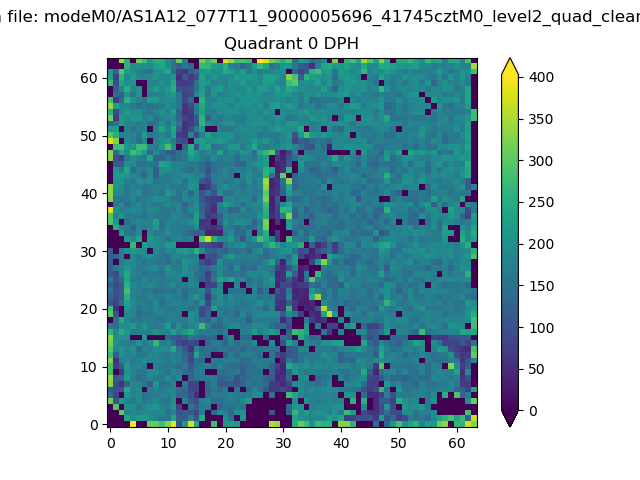 |
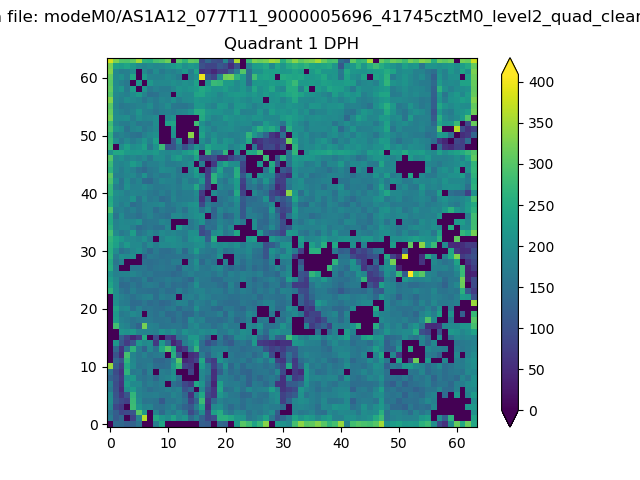 |
Quadrant B |
|---|---|---|---|
| Quadrant D | 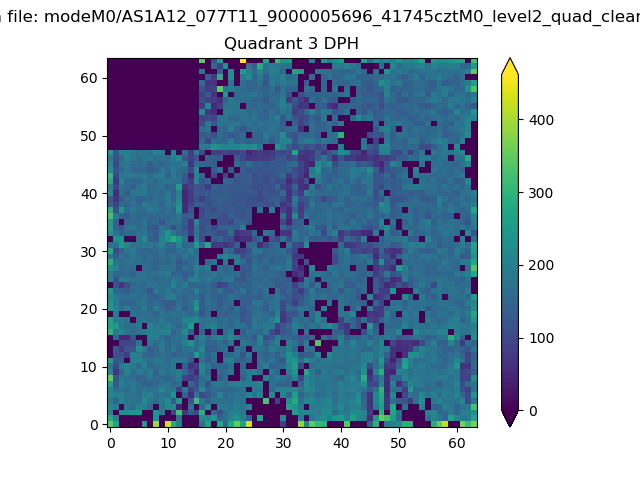 |
 |
Quadrant C |
| Plot type | Count rate plots | Images |
|---|---|---|
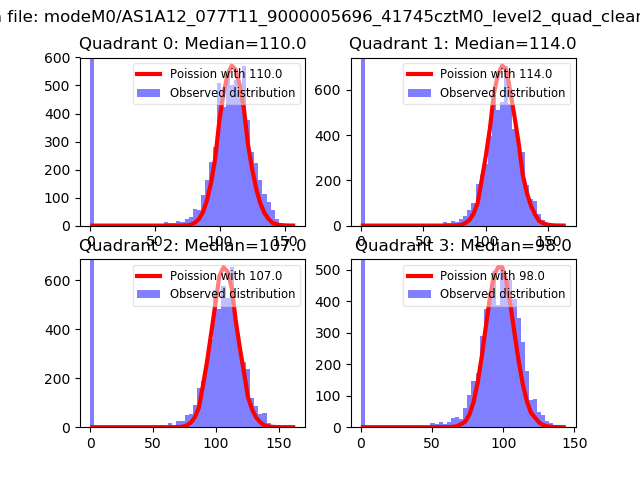
| Comparison with Poisson distribution Blue bars denote a histogram of data divided into 1 sec bins. Red curve is a Poisson curve with rate = median count rate of data. |
 |
 |
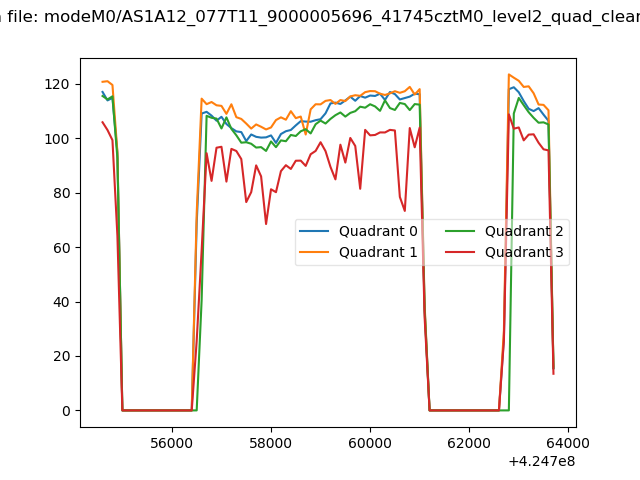
| Quadrant-wise count rates Data is divided into 100 sec bins |
 |
|
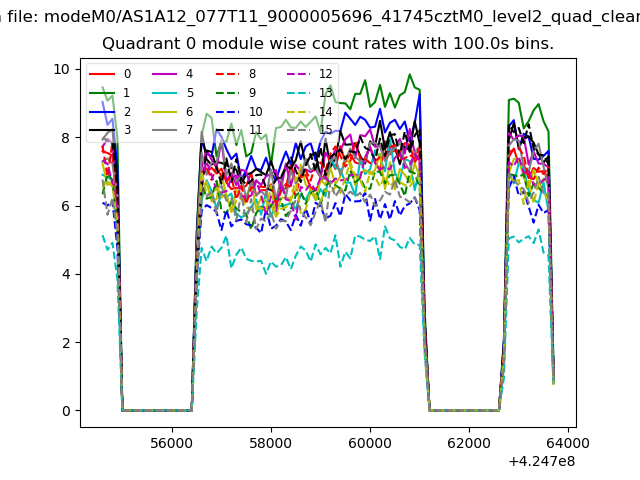
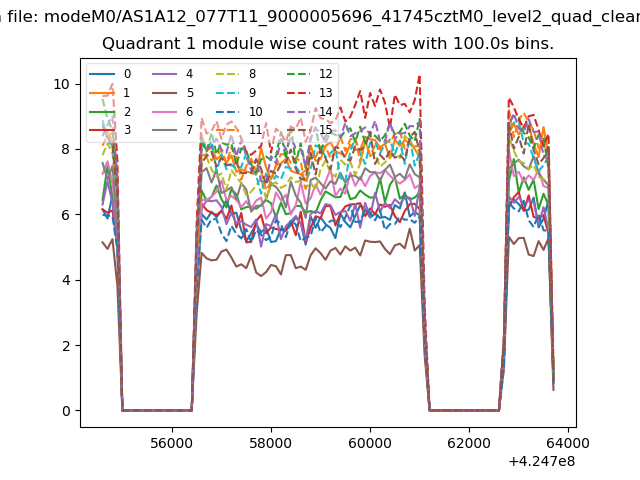
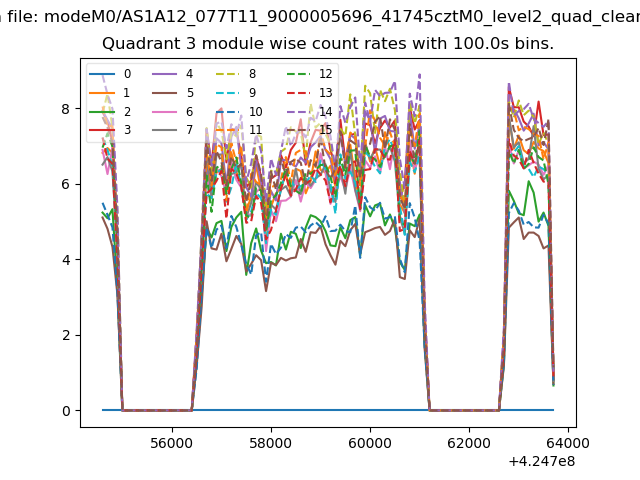
| Module-wise count rates for Quadrant A Data is divided into 100 sec bins |
 |
 |
| Module-wise count rates for Quadrant B Data is divided into 100 sec bins |
 |
 |
| Module-wise count rates for Quadrant C Data is divided into 100 sec bins |
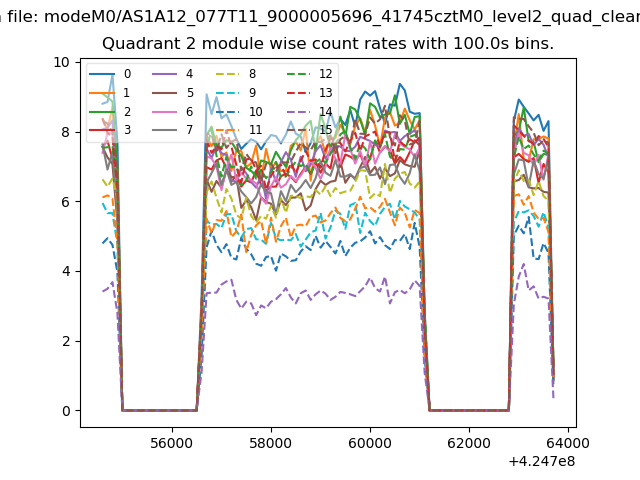 |
 |
| Module-wise count rates for Quadrant D Data is divided into 100 sec bins |
 |
 |
| Parameter | Plot |
|---|---|
| CZT HV Monitor | 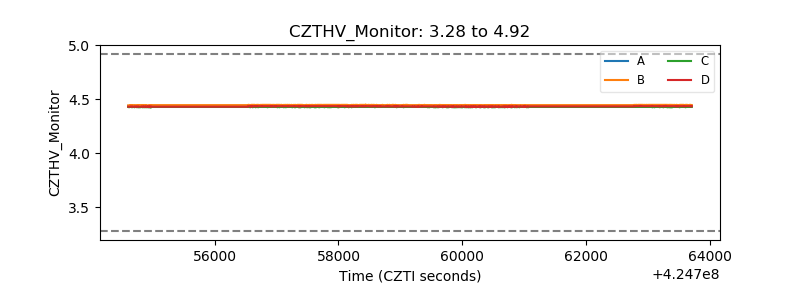 |
| D_VDD | 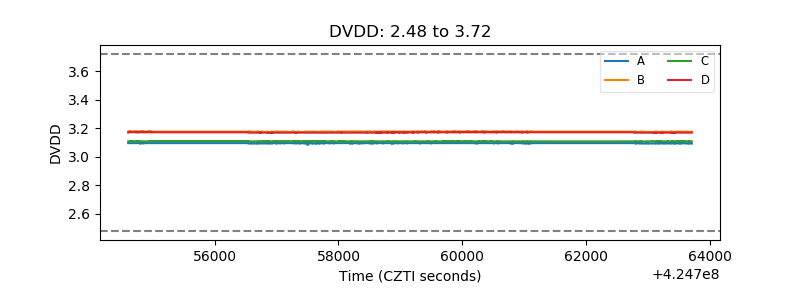 |
| Temperature 1 | 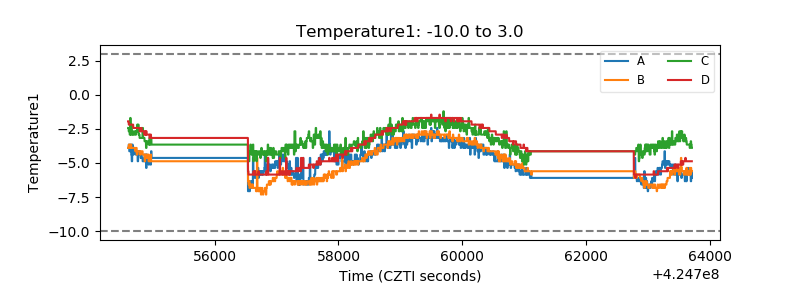 |
| Veto HV Monitor | 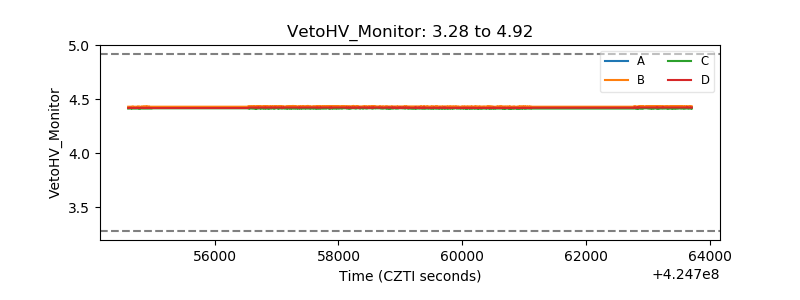 |
| Veto LLD | 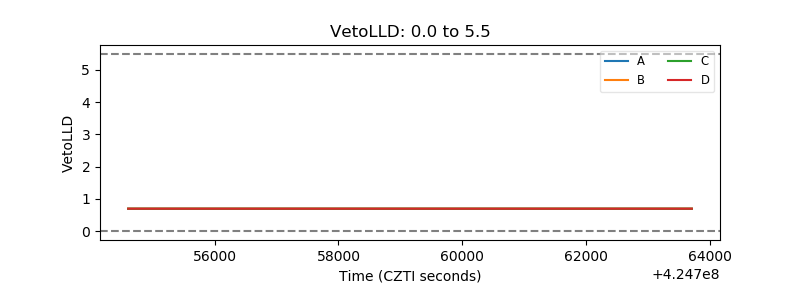 |
| Alpha Counter | 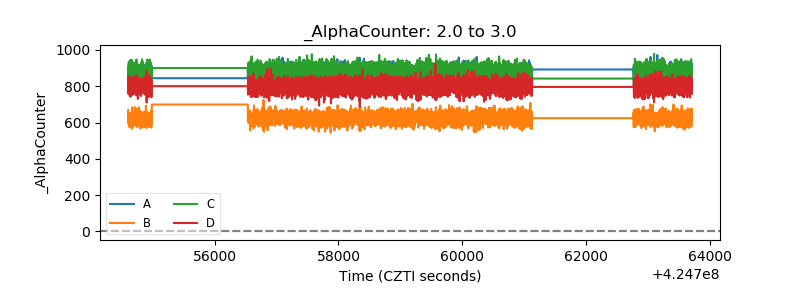 |
| _CPM_Rate | 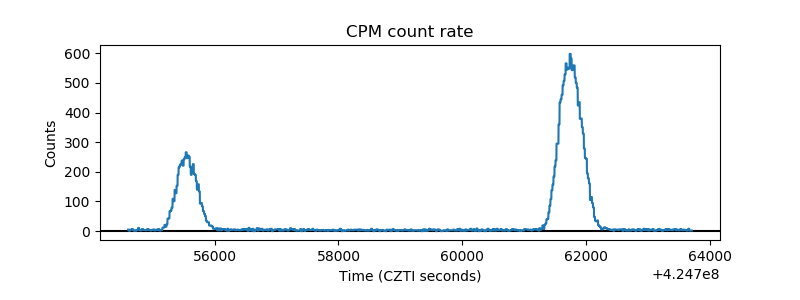 |
| CZT Counter | 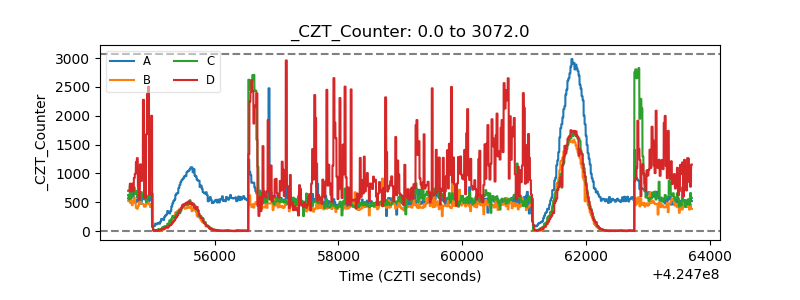 |
| +2.5 Volts monitor |  |
| +5 Volts monitor | 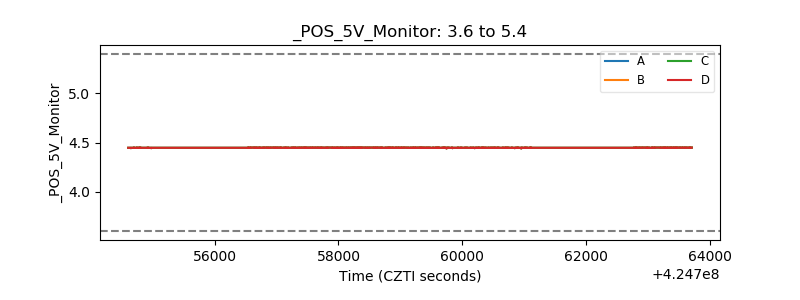 |
| _ROLL_ROT | 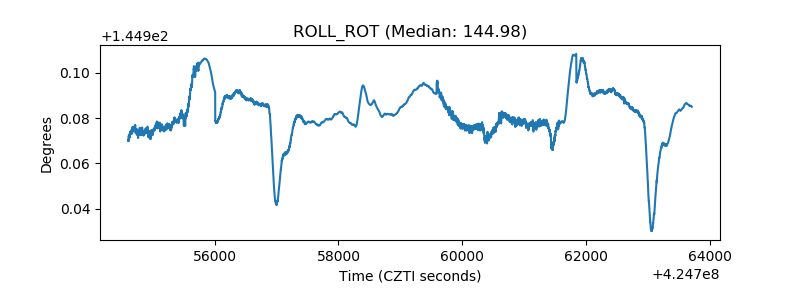 |
| _Roll_DEC | 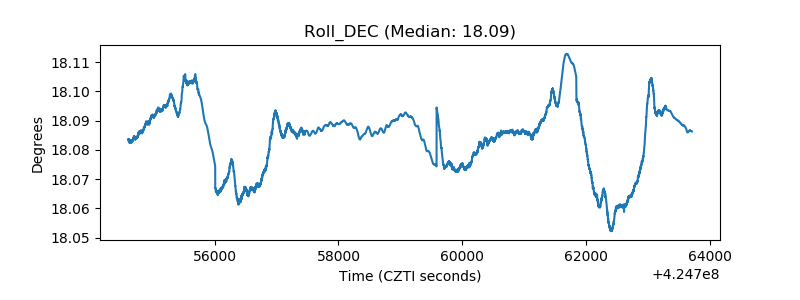 |
| _Roll_RA | 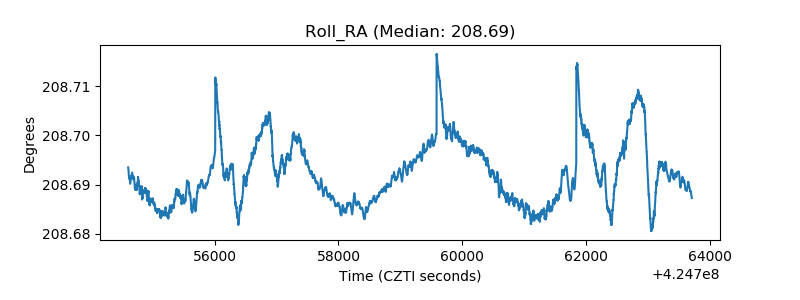 |
| Veto Counter | 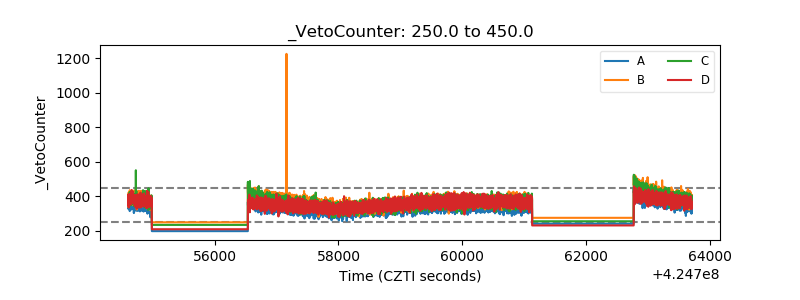 |