| Param | Original file | Final file |
|---|---|---|
| Filename | modeM0/AS1A12_077T11_9000005696_41747cztM0_level2.fits | modeM0/AS1A12_077T11_9000005696_41747cztM0_level2_quad_clean.evt |
| Size (bytes) | 448,188,480 | 93,337,920 |
| Size | 427.4 MB | 89.0 MB |
| Events in quadrant A | 3,112,786 | 653,395 |
| Events in quadrant B | 2,680,254 | 673,130 |
| Events in quadrant C | 3,626,388 | 599,496 |
| Events in quadrant D | 6,729,889 | 503,189 |
| Mode M9 | |||
|---|---|---|---|
| Quadrant | BADHDUFLAG | Total packets | Discarded packets |
| A | 0 | 34 | 0 |
| B | 0 | 34 | 0 |
| C | 0 | 34 | 0 |
| D | 0 | 34 | 0 |
| Mode M0 | |||
|---|---|---|---|
| Quadrant | BADHDUFLAG | Total packets | Discarded packets |
| A | 0 | 12516 | 2 |
| B | 0 | 11590 | 2 |
| C | 0 | 14022 | 2 |
| D | 0 | 23930 | 2 |
| Mode SS | |||
|---|---|---|---|
| Quadrant | BADHDUFLAG | Total packets | Discarded packets |
| A | 0 | 118 | 0 |
| B | 0 | 118 | 0 |
| C | 0 | 118 | 0 |
| D | 0 | 118 | 0 |
| Quadrant | Total seconds | Saturated seconds | Saturation percentage |
|---|---|---|---|
| A | 5677 | 13 | 0.228994% |
| B | 5678 | 23 | 0.405072% |
| C | 5677 | 253 | 4.456579% |
| D | 5677 | 901 | 15.871059% |
Noise dominated data is calculated using 1-second bins in cleaned event files. If a bin has >2000 counts, and if more than 50% of those come from <1% of pixels, then it is considered to be noise-dominated and hence unusable.
| Quadrant | # 1 sec bins | Bins with >0 counts | Bins with >2000 counts | High rate bins dominated by noise | Noise dominated (total time) | Noise dominated (detector-on time) | Marked lightcurve |
|---|---|---|---|---|---|---|---|
| A | 9114 | 5679 | 4 | 4 | 0.04% | 0.07% |  |
| B | 9115 | 5678 | 12 | 12 | 0.13% | 0.21% |  |
| C | 9113 | 5676 | 241 | 241 | 2.64% | 4.25% |  |
| D | 9114 | 5677 | 922 | 922 | 10.12% | 16.24% |  |
Top three noisy pixels from each quadrant. If the there are fewer than three noisy pixels in the level2.evt file, extra rows are filled as -1
| Pixel properties | Quadrant properties | ||||||
|---|---|---|---|---|---|---|---|
| Quadrant | DetID | PixID | Counts | Sigma | Mean | Median | Sigma |
| A | 10 | 83 | 546624 | 4048.63 | 654 | 643 | 134.9 |
| A | 2 | 79 | 18175 | 130.01 | 654 | 643 | 134.9 |
| A | 13 | 254 | 8862 | 60.95 | 654 | 643 | 134.9 |
| B | 0 | 245 | 51315 | 400.25 | 648 | 631 | 126.6 |
| B | 5 | 255 | 27952 | 215.75 | 648 | 631 | 126.6 |
| B | 0 | 183 | 21092 | 161.58 | 648 | 631 | 126.6 |
| C | 0 | 10 | 951206 | 6645.36 | 613 | 616 | 143.0 |
| C | 15 | 214 | 246053 | 1715.79 | 613 | 616 | 143.0 |
| C | 14 | 254 | 32760 | 224.71 | 613 | 616 | 143.0 |
| D | 12 | 79 | 3062316 | 20676.3 | 599 | 582 | 148.1 |
| D | 2 | 249 | 1093434 | 7380.18 | 599 | 582 | 148.1 |
| D | 2 | 120 | 103176 | 692.83 | 599 | 582 | 148.1 |
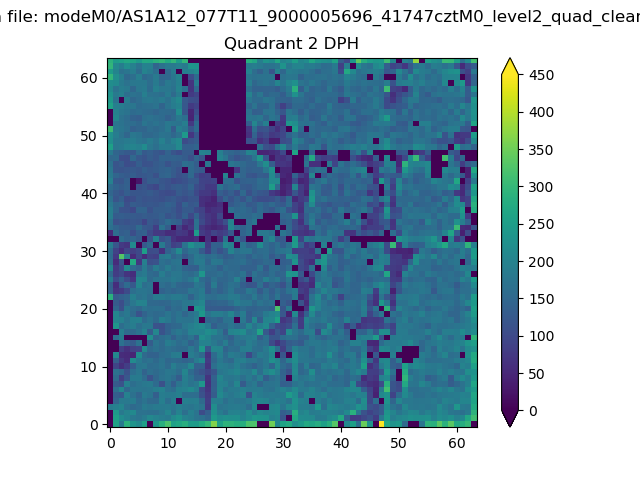
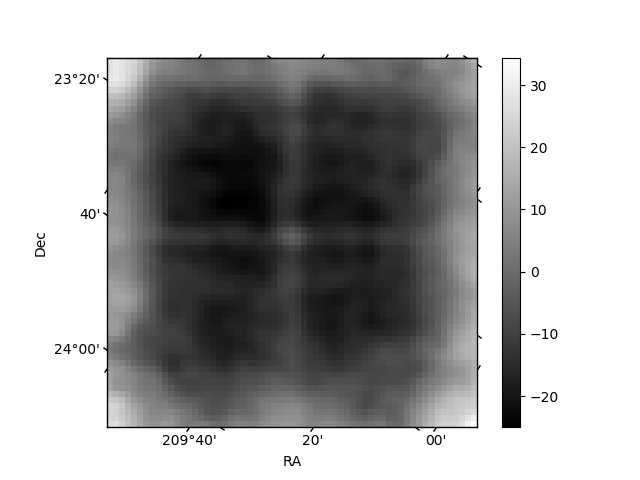
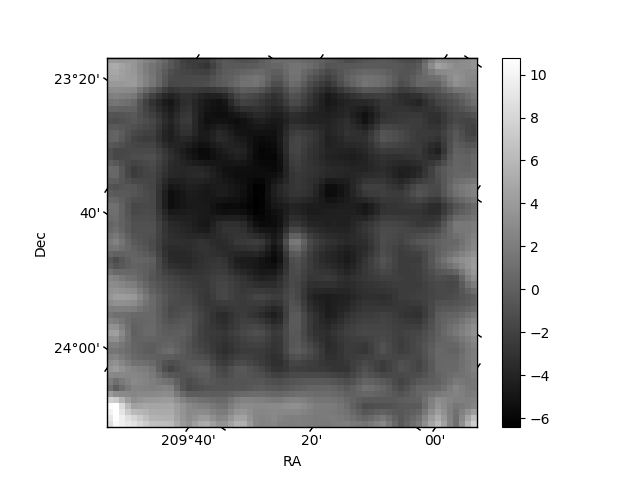
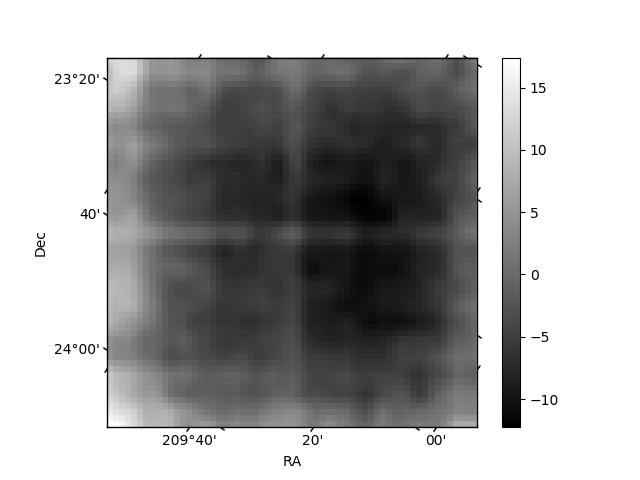
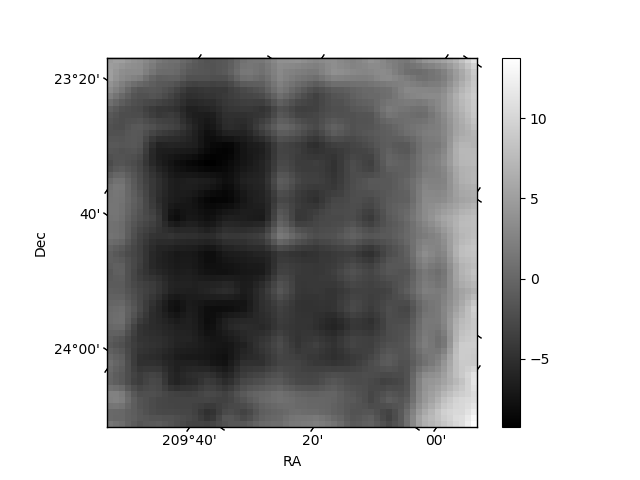
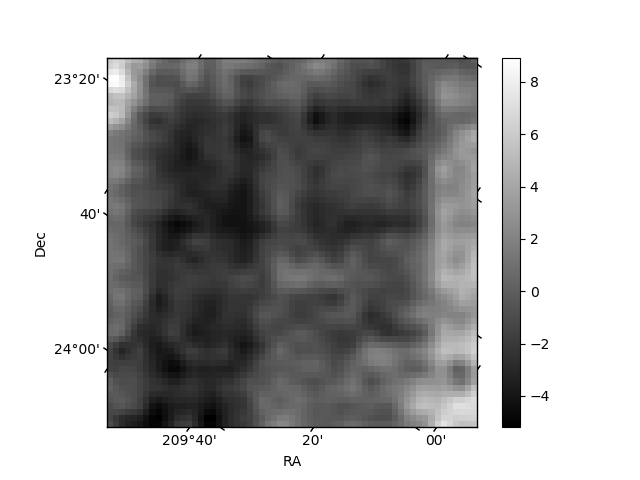
Histogram calculated using DETX and DETY for each event in the final _common_clean file
| Quadrant A | 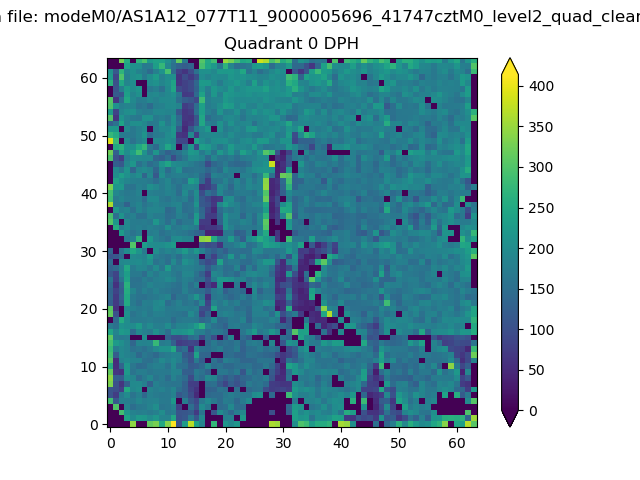 |
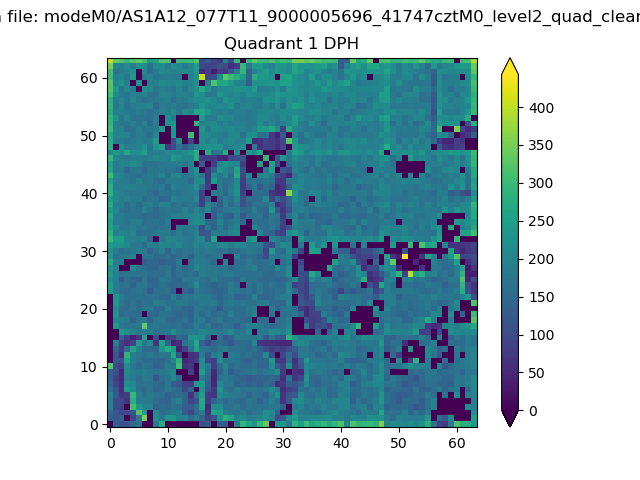 |
Quadrant B |
|---|---|---|---|
| Quadrant D | 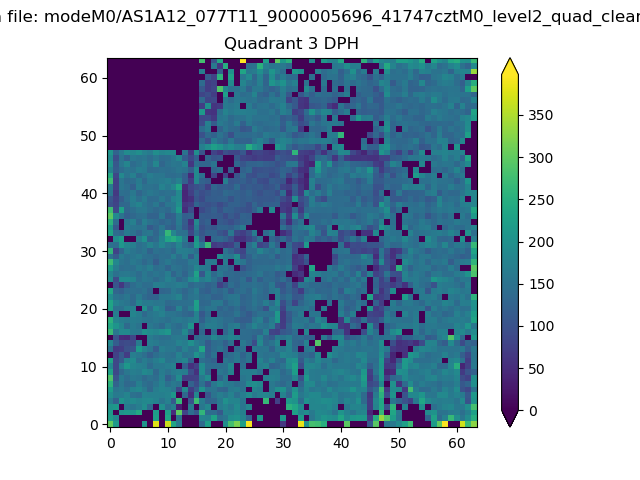 |
 |
Quadrant C |
| Plot type | Count rate plots | Images |
|---|---|---|
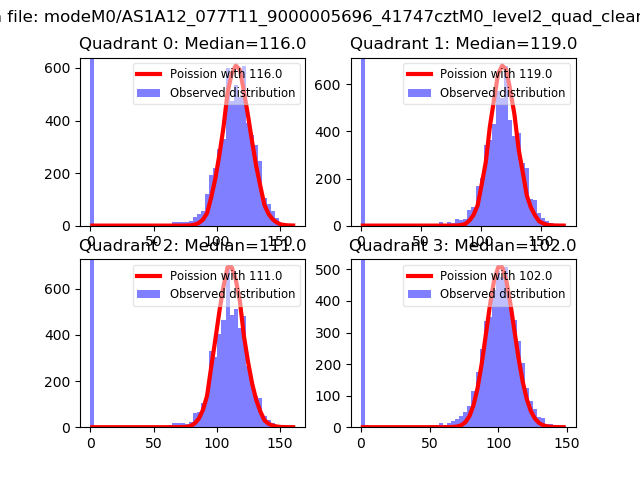
| Comparison with Poisson distribution Blue bars denote a histogram of data divided into 1 sec bins. Red curve is a Poisson curve with rate = median count rate of data. |
 |
 |
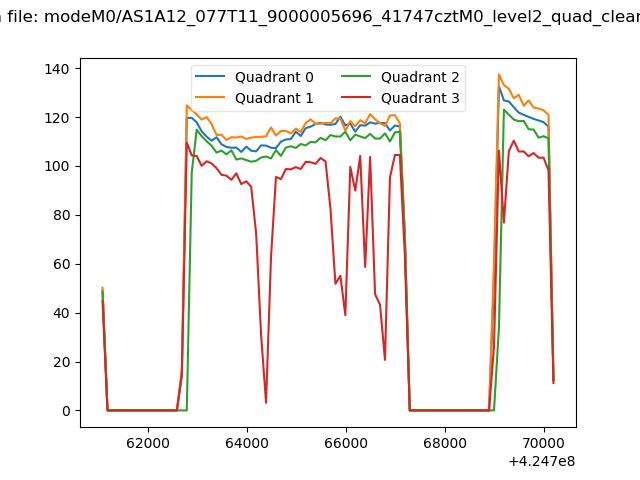
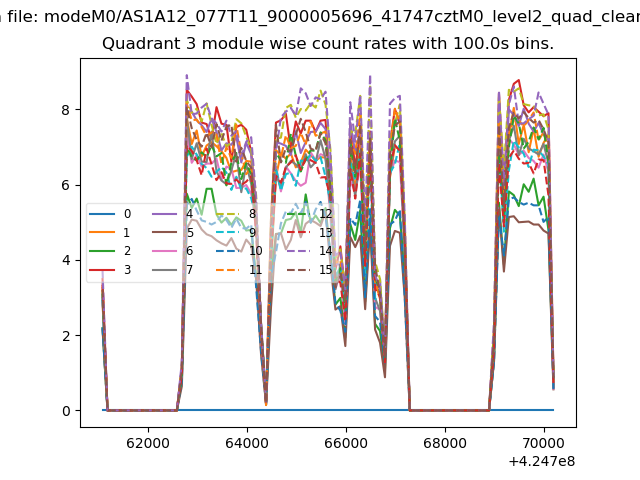
| Quadrant-wise count rates Data is divided into 100 sec bins |
 |
|
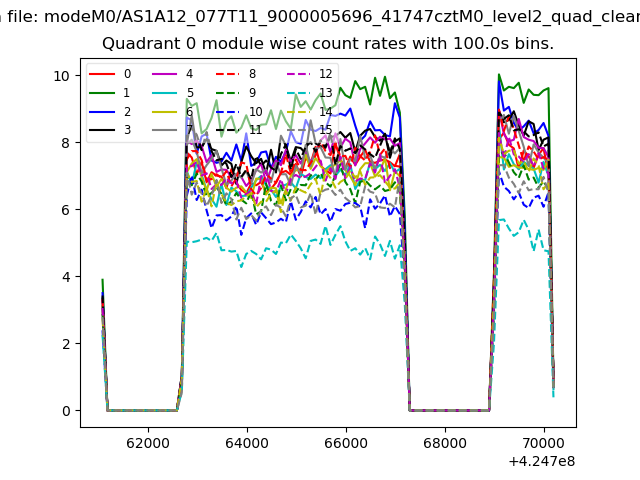
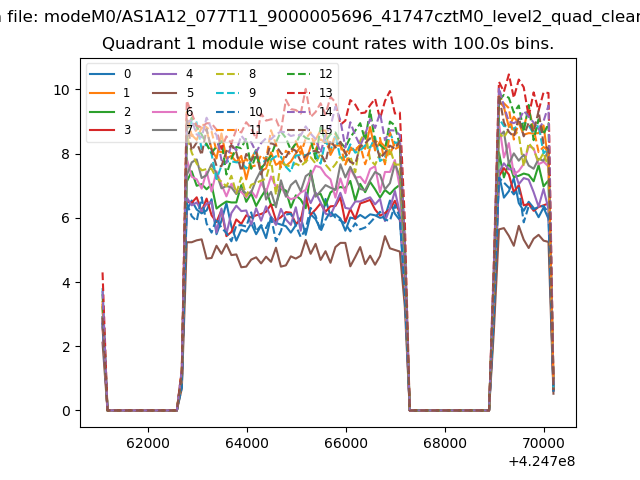
| Module-wise count rates for Quadrant A Data is divided into 100 sec bins |
 |
 |
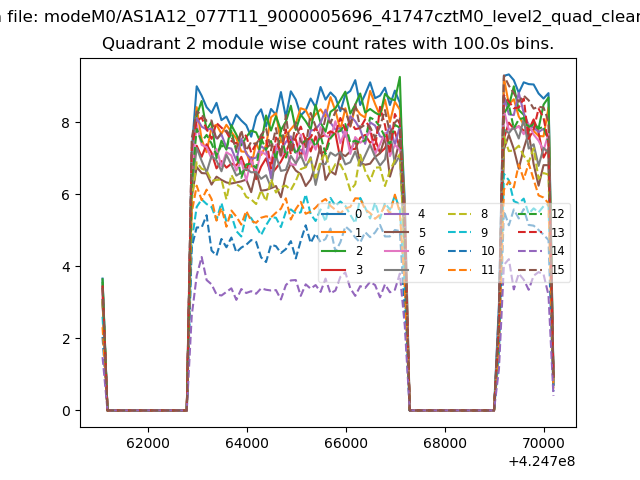
| Module-wise count rates for Quadrant B Data is divided into 100 sec bins |
 |
 |
| Module-wise count rates for Quadrant C Data is divided into 100 sec bins |
 |
 |
| Module-wise count rates for Quadrant D Data is divided into 100 sec bins |
 |
 |
| Parameter | Plot |
|---|---|
| CZT HV Monitor | 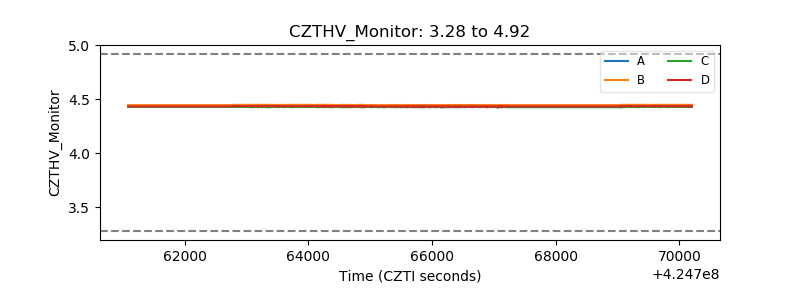 |
| D_VDD | 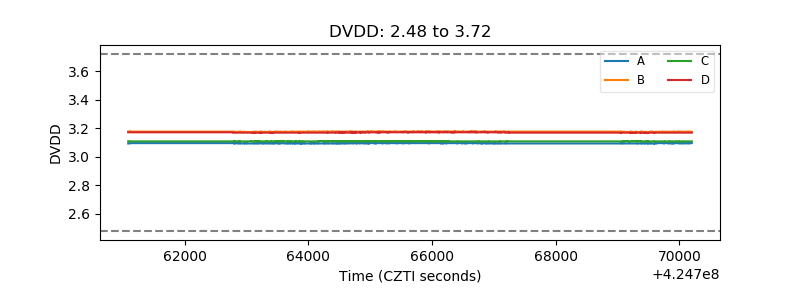 |
| Temperature 1 | 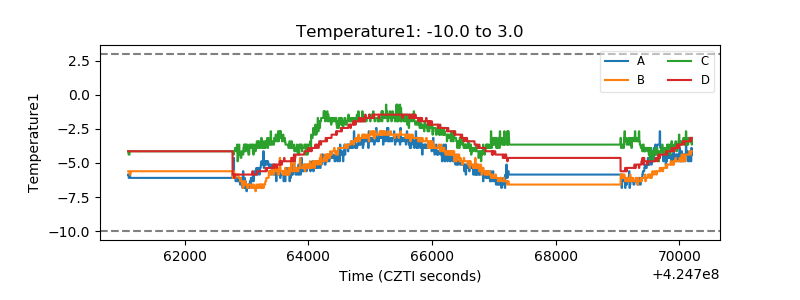 |
| Veto HV Monitor |  |
| Veto LLD | 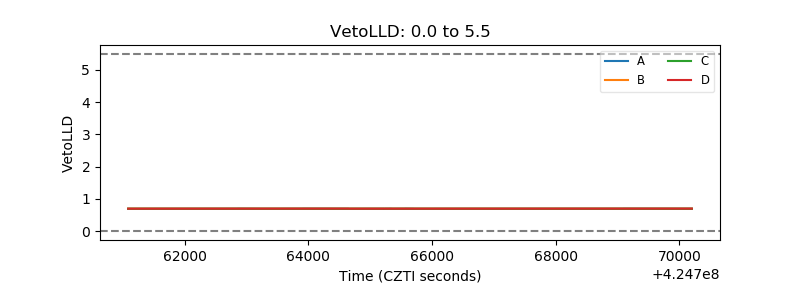 |
| Alpha Counter | 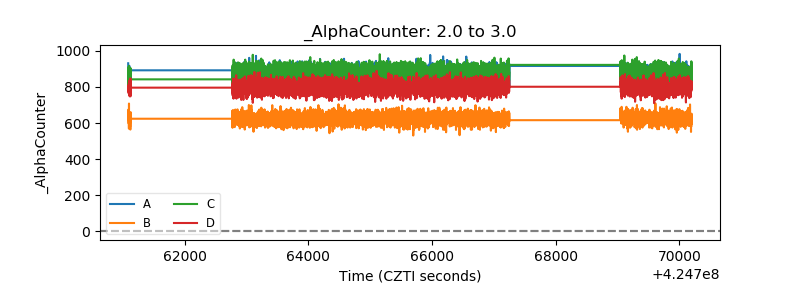 |
| _CPM_Rate | 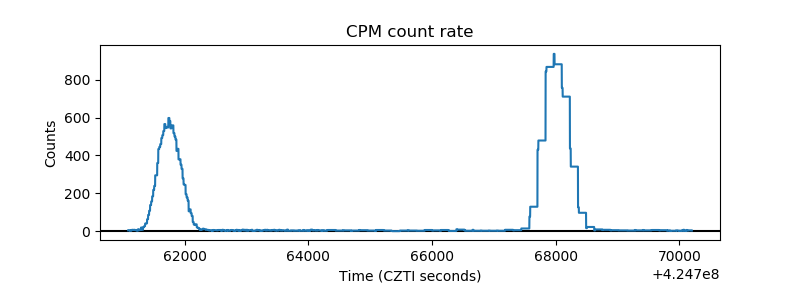 |
| CZT Counter | 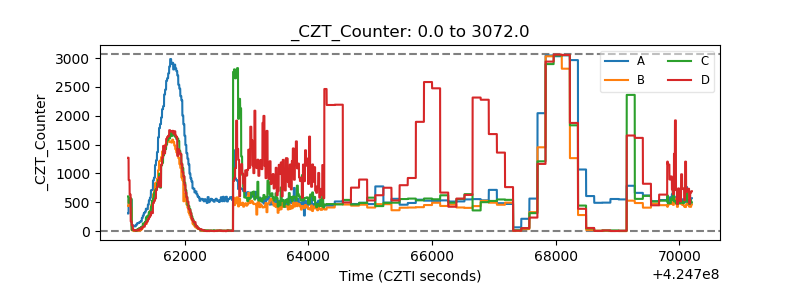 |
| +2.5 Volts monitor | 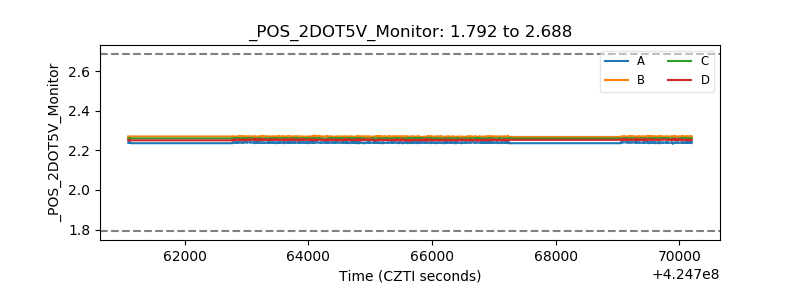 |
| +5 Volts monitor | 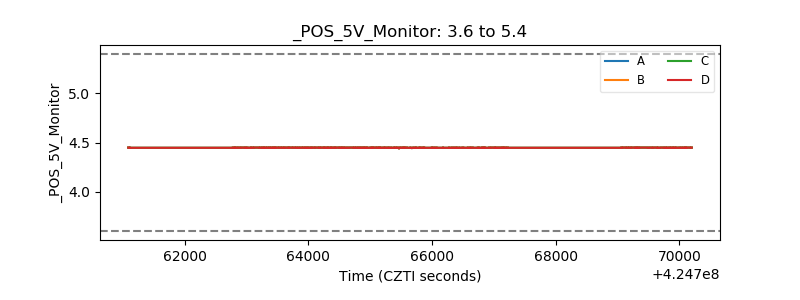 |
| _ROLL_ROT | 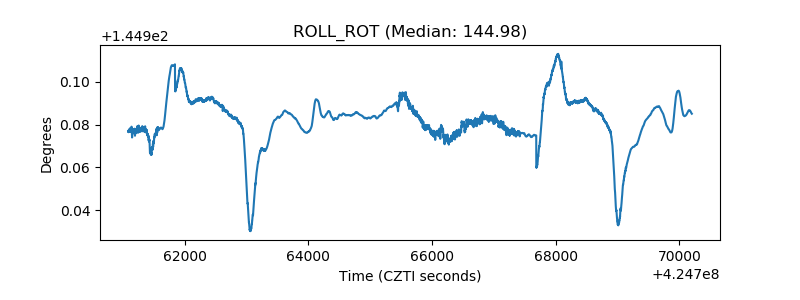 |
| _Roll_DEC | 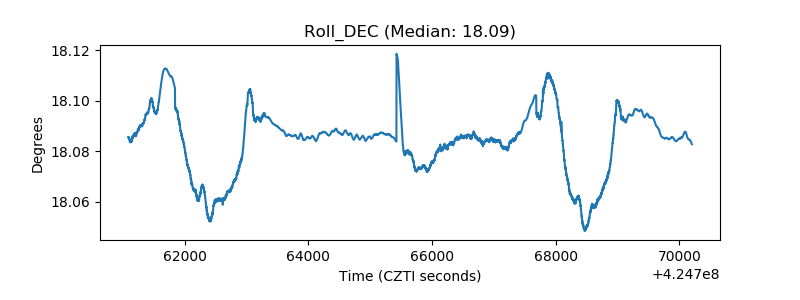 |
| _Roll_RA | 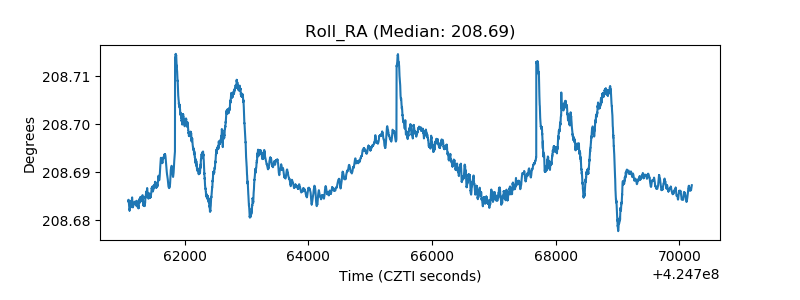 |
| Veto Counter | 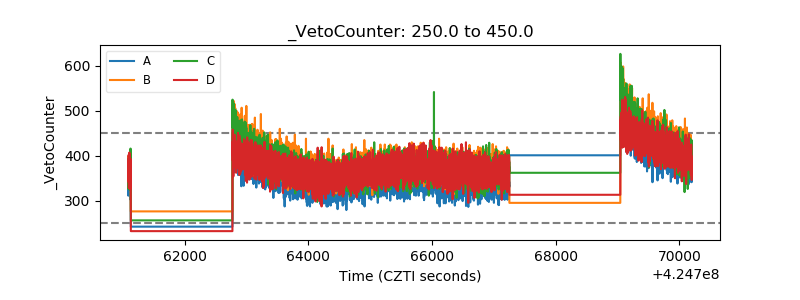 |