| Param | Original file | Final file |
|---|---|---|
| Filename | modeM0/AS1A12_077T11_9000005696_41748cztM0_level2.fits | modeM0/AS1A12_077T11_9000005696_41748cztM0_level2_quad_clean.evt |
| Size (bytes) | 2,145,830,400 | 467,331,840 |
| Size | 2.0 GB | 445.7 MB |
| Events in quadrant A | 15,512,459 | 3,222,318 |
| Events in quadrant B | 13,722,851 | 3,305,190 |
| Events in quadrant C | 18,324,966 | 3,012,446 |
| Events in quadrant D | 29,643,013 | 2,625,625 |
| Mode M9 | |||
|---|---|---|---|
| Quadrant | BADHDUFLAG | Total packets | Discarded packets |
| A | 0 | 104 | 0 |
| B | 0 | 105 | 0 |
| C | 0 | 105 | 0 |
| D | 0 | 105 | 0 |
| Mode M0 | |||
|---|---|---|---|
| Quadrant | BADHDUFLAG | Total packets | Discarded packets |
| A | 0 | 62844 | 8 |
| B | 0 | 60090 | 7 |
| C | 0 | 72717 | 7 |
| D | 0 | 108228 | 7 |
| Mode SS | |||
|---|---|---|---|
| Quadrant | BADHDUFLAG | Total packets | Discarded packets |
| A | 0 | 588 | 0 |
| B | 0 | 588 | 0 |
| C | 0 | 588 | 0 |
| D | 0 | 588 | 0 |
| Quadrant | Total seconds | Saturated seconds | Saturation percentage |
|---|---|---|---|
| A | 28868 | 61 | 0.211307% |
| B | 28868 | 73 | 0.252875% |
| C | 28868 | 993 | 3.439795% |
| D | 28868 | 3294 | 11.410558% |
Noise dominated data is calculated using 1-second bins in cleaned event files. If a bin has >2000 counts, and if more than 50% of those come from <1% of pixels, then it is considered to be noise-dominated and hence unusable.
| Quadrant | # 1 sec bins | Bins with >0 counts | Bins with >2000 counts | High rate bins dominated by noise | Noise dominated (total time) | Noise dominated (detector-on time) | Marked lightcurve |
|---|---|---|---|---|---|---|---|
| A | 38546 | 28873 | 18 | 18 | 0.05% | 0.06% | 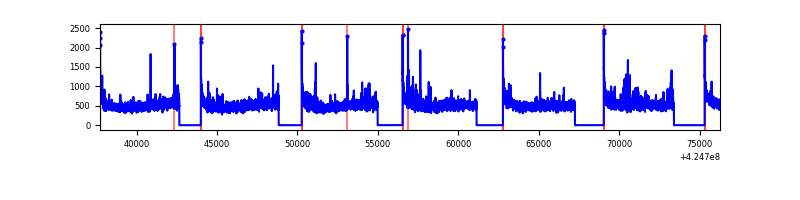 |
| B | 38545 | 28867 | 37 | 37 | 0.10% | 0.13% | 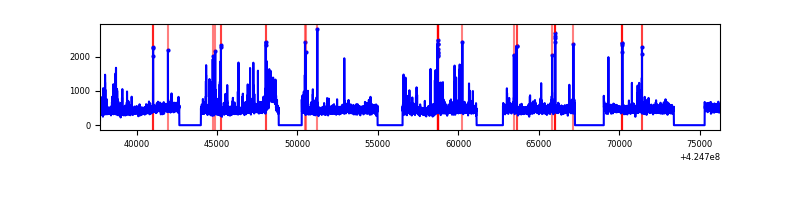 |
| C | 38545 | 28867 | 935 | 935 | 2.43% | 3.24% | 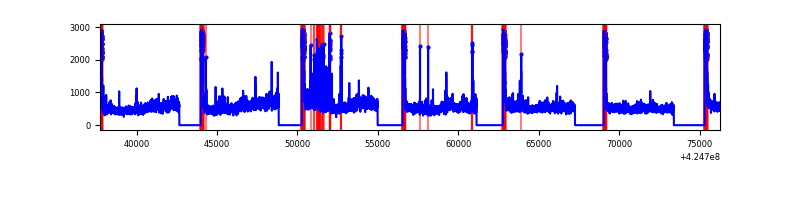 |
| D | 38545 | 28867 | 3564 | 3564 | 9.25% | 12.35% | 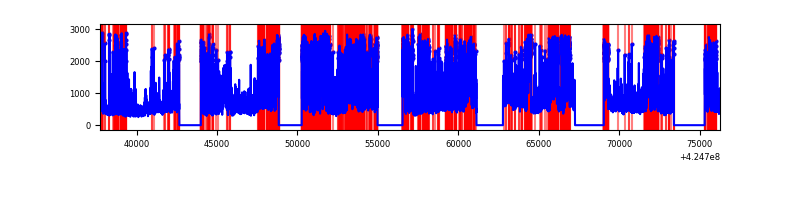 |
Top three noisy pixels from each quadrant. If the there are fewer than three noisy pixels in the level2.evt file, extra rows are filled as -1
| Pixel properties | Quadrant properties | ||||||
|---|---|---|---|---|---|---|---|
| Quadrant | DetID | PixID | Counts | Sigma | Mean | Median | Sigma |
| A | 10 | 83 | 2507815 | 3774.49 | 3268 | 3206 | 663.6 |
| A | 2 | 79 | 183188 | 271.24 | 3268 | 3206 | 663.6 |
| A | 3 | 1 | 62835 | 89.86 | 3268 | 3206 | 663.6 |
| B | 5 | 255 | 346738 | 549.92 | 3228 | 3133 | 624.8 |
| B | 0 | 245 | 274127 | 433.71 | 3228 | 3133 | 624.8 |
| B | 0 | 186 | 270697 | 428.22 | 3228 | 3133 | 624.8 |
| C | 0 | 10 | 4506463 | 6296.38 | 3090 | 3108 | 715.2 |
| C | 15 | 214 | 1209383 | 1686.56 | 3090 | 3108 | 715.2 |
| C | 14 | 254 | 536149 | 745.27 | 3090 | 3108 | 715.2 |
| D | 12 | 79 | 11634872 | 15655.38 | 3046 | 2962 | 743.0 |
| D | 2 | 249 | 2560643 | 3442.38 | 3046 | 2962 | 743.0 |
| D | 13 | 249 | 1295063 | 1739.04 | 3046 | 2962 | 743.0 |
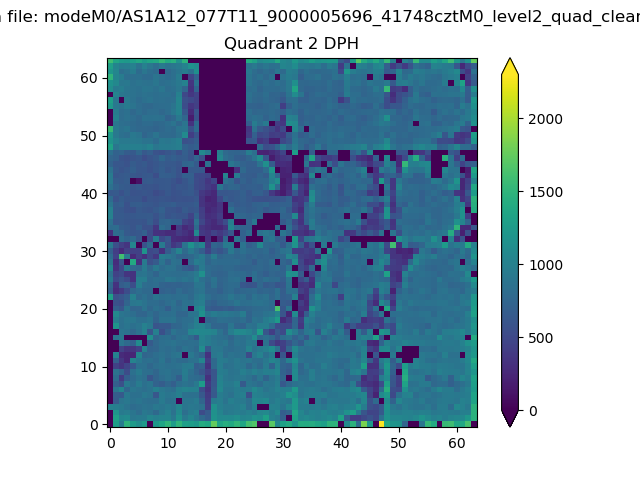
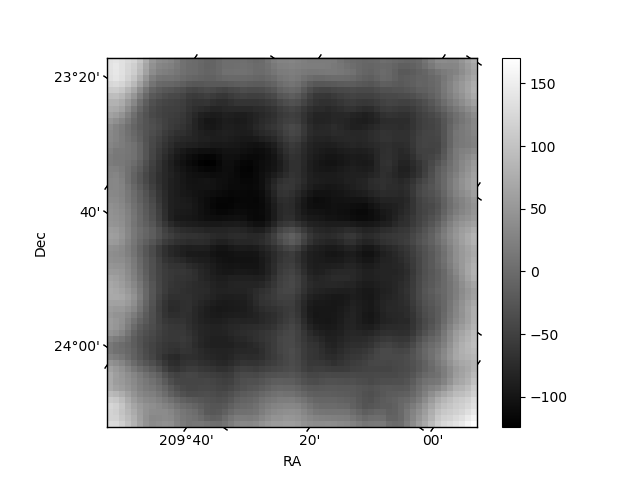
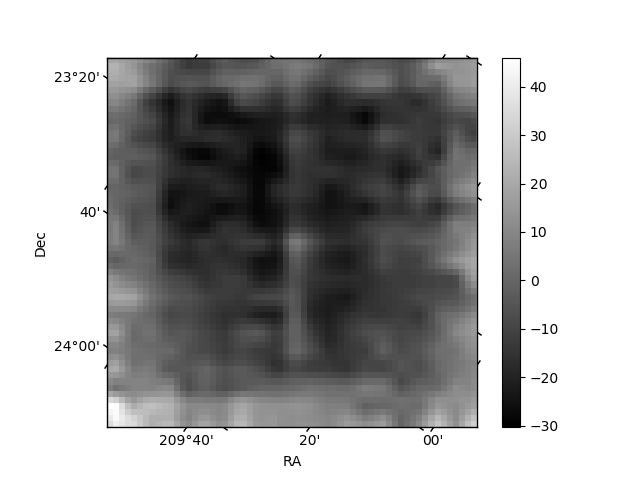
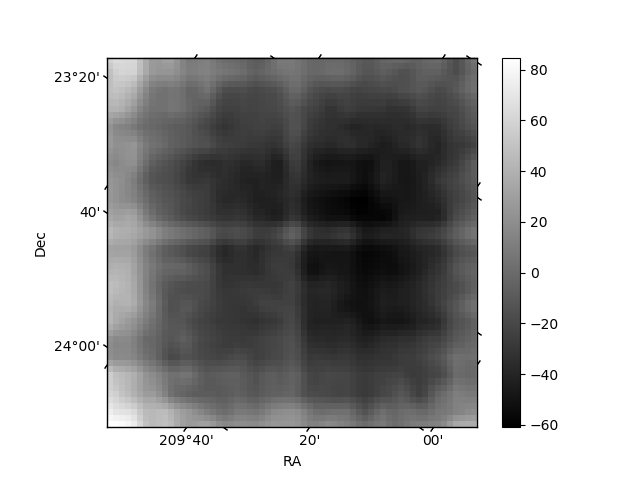
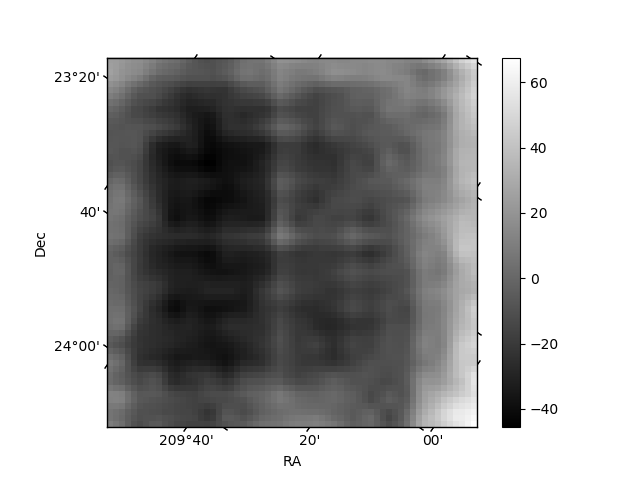
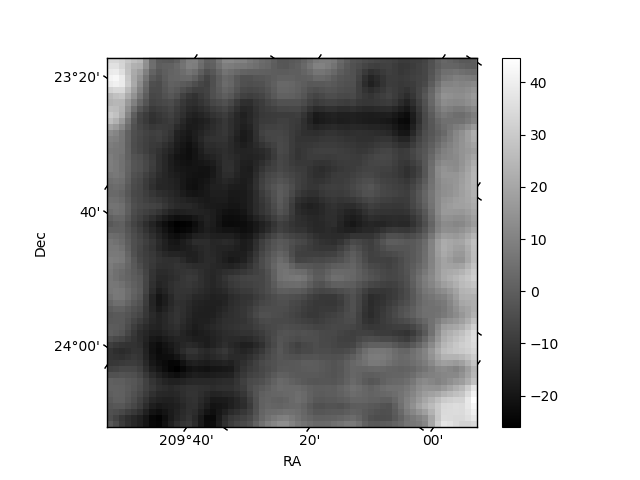
Histogram calculated using DETX and DETY for each event in the final _common_clean file
| Quadrant A | 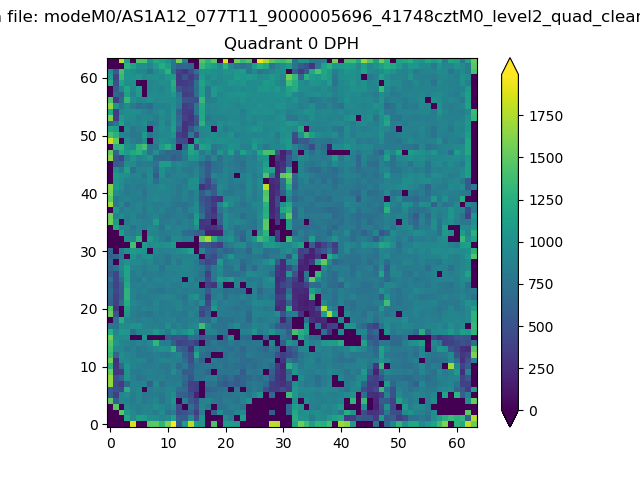 |
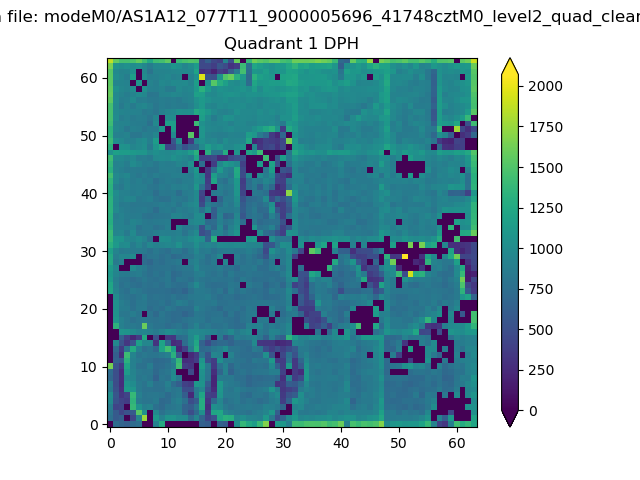 |
Quadrant B |
|---|---|---|---|
| Quadrant D | 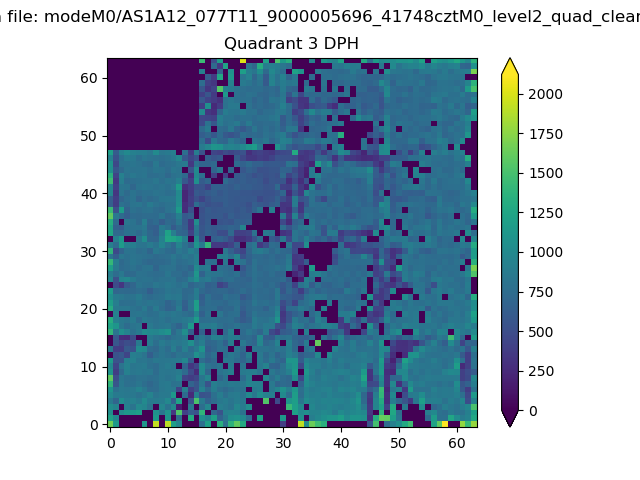 |
 |
Quadrant C |
| Plot type | Count rate plots | Images |
|---|---|---|
| Comparison with Poisson distribution Blue bars denote a histogram of data divided into 1 sec bins. Red curve is a Poisson curve with rate = median count rate of data. |
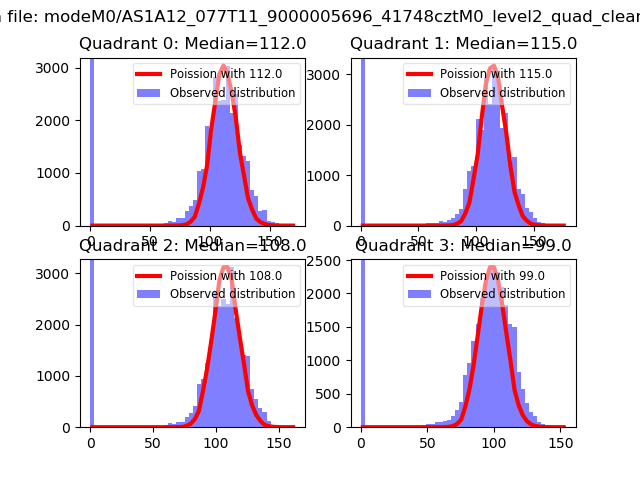 |
 |
| Quadrant-wise count rates Data is divided into 100 sec bins |
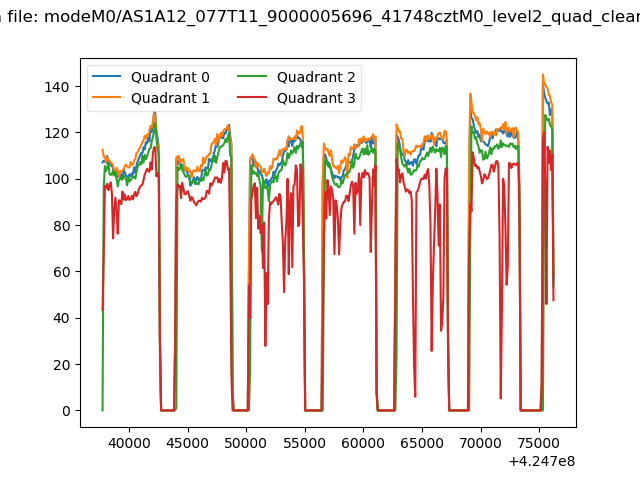 |
|
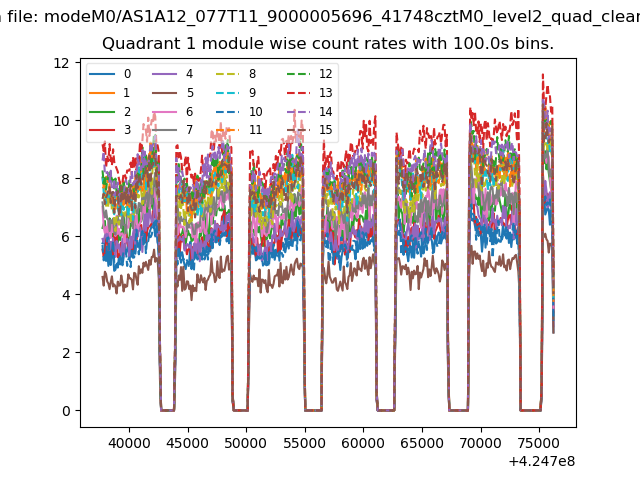
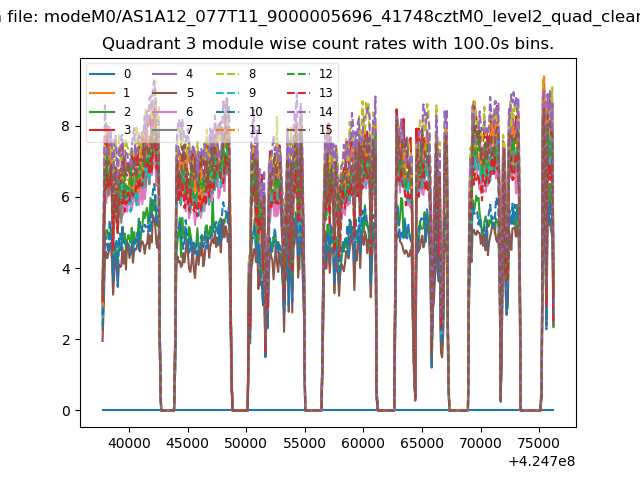
| Module-wise count rates for Quadrant A Data is divided into 100 sec bins |
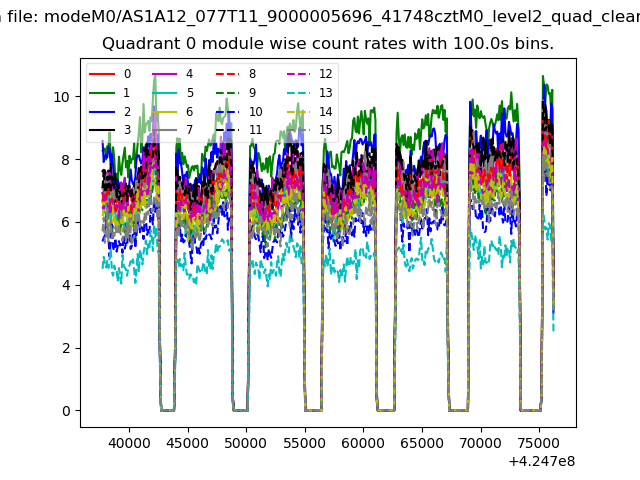 |
 |
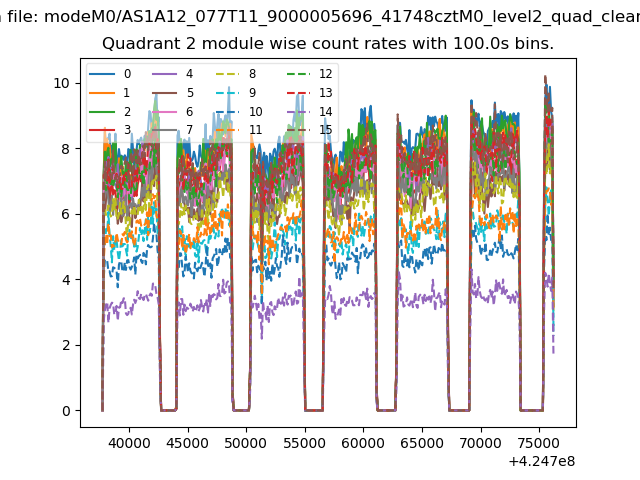
| Module-wise count rates for Quadrant B Data is divided into 100 sec bins |
 |
 |
| Module-wise count rates for Quadrant C Data is divided into 100 sec bins |
 |
 |
| Module-wise count rates for Quadrant D Data is divided into 100 sec bins |
 |
 |
| Parameter | Plot |
|---|---|
| CZT HV Monitor | 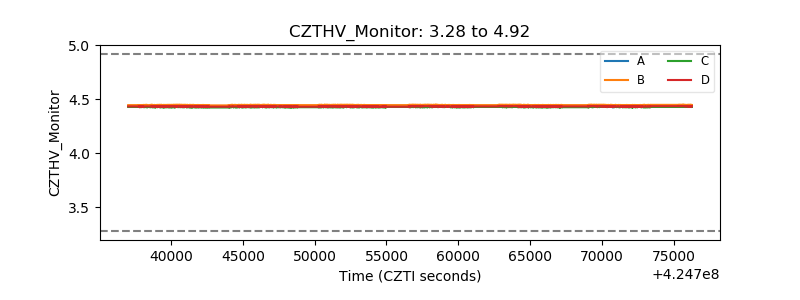 |
| D_VDD | 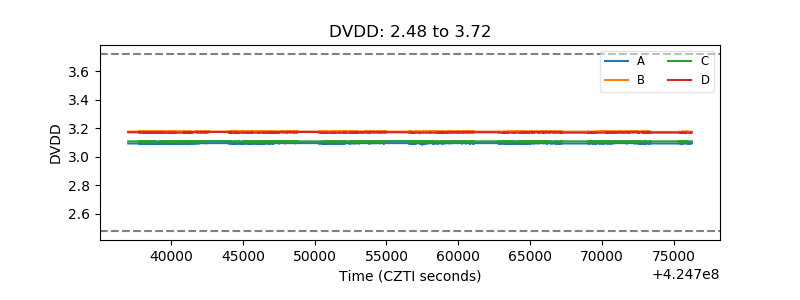 |
| Temperature 1 | 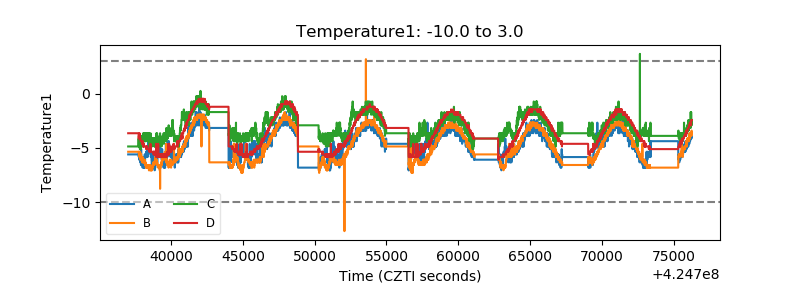 |
| Veto HV Monitor | 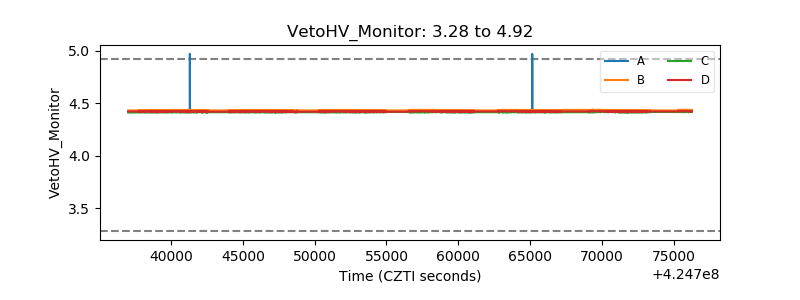 |
| Veto LLD | 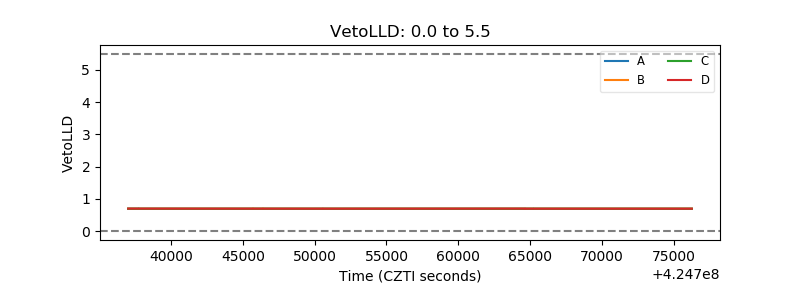 |
| Alpha Counter | 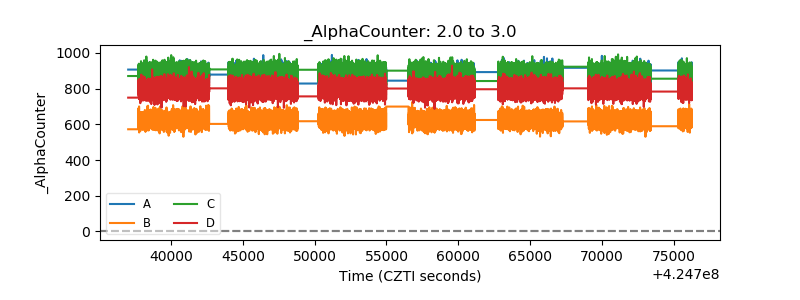 |
| _CPM_Rate | 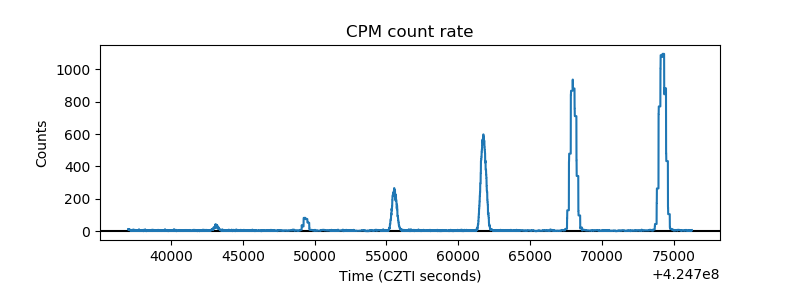 |
| CZT Counter | 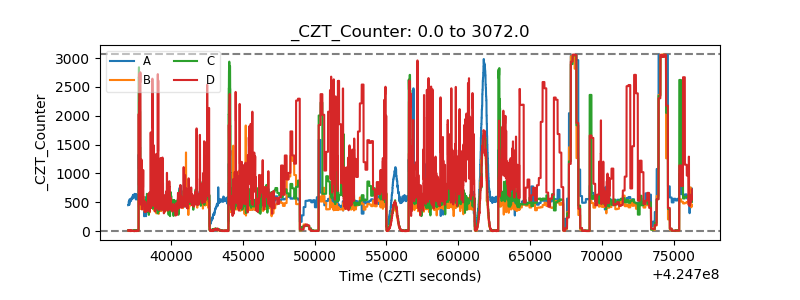 |
| +2.5 Volts monitor | 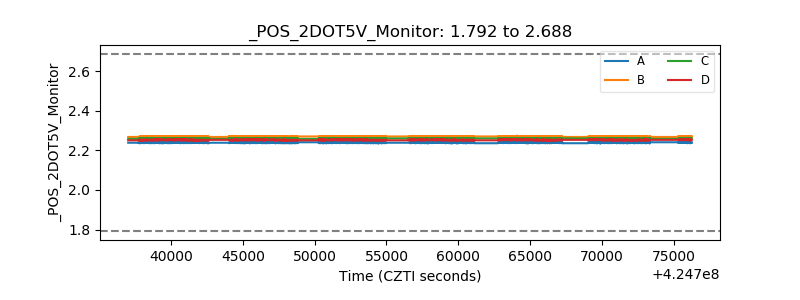 |
| +5 Volts monitor | 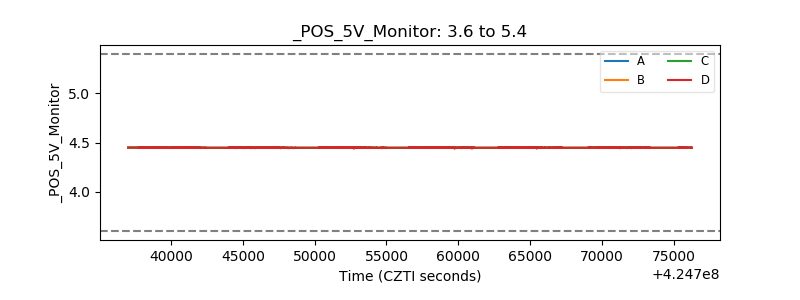 |
| _ROLL_ROT | 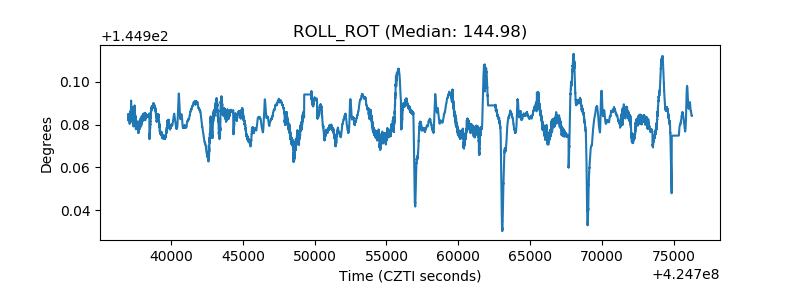 |
| _Roll_DEC | 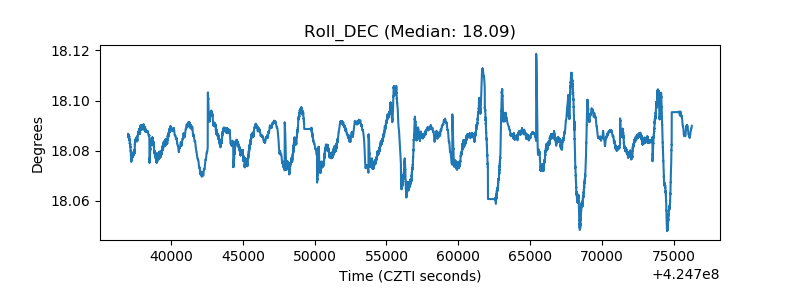 |
| _Roll_RA | 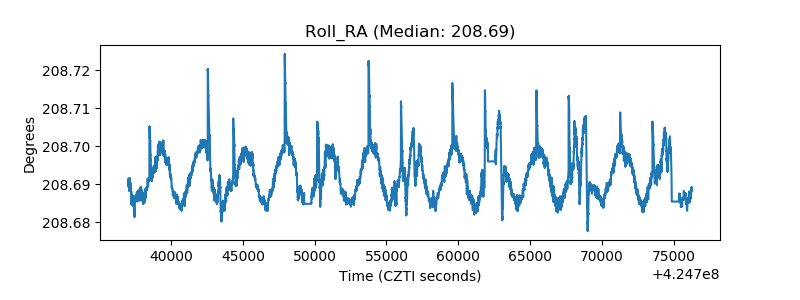 |
| Veto Counter | 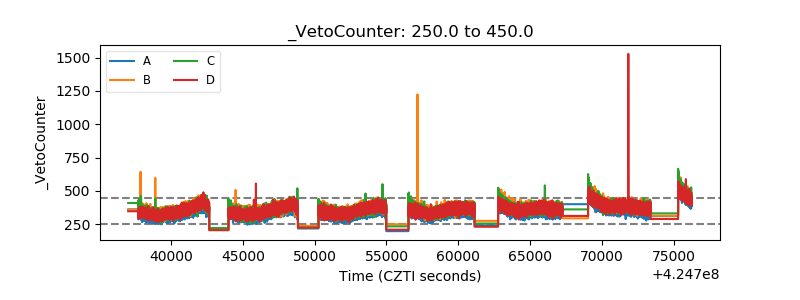 |