| Param | Original file | Final file |
|---|---|---|
| Filename | modeM0/AS1A12_077T11_9000005696_41749cztM0_level2.fits | modeM0/AS1A12_077T11_9000005696_41749cztM0_level2_quad_clean.evt |
| Size (bytes) | 346,711,680 | 91,396,800 |
| Size | 330.7 MB | 87.2 MB |
| Events in quadrant A | 2,969,899 | 637,688 |
| Events in quadrant B | 2,513,388 | 653,746 |
| Events in quadrant C | 3,536,172 | 571,535 |
| Events in quadrant D | 3,421,813 | 551,346 |
| Mode M9 | |||
|---|---|---|---|
| Quadrant | BADHDUFLAG | Total packets | Discarded packets |
| A | 0 | 34 | 0 |
| B | 0 | 35 | 0 |
| C | 0 | 35 | 0 |
| D | 0 | 35 | 0 |
| Mode M0 | |||
|---|---|---|---|
| Quadrant | BADHDUFLAG | Total packets | Discarded packets |
| A | 0 | 11841 | 2 |
| B | 0 | 10418 | 2 |
| C | 0 | 13636 | 2 |
| D | 0 | 13440 | 2 |
| Mode SS | |||
|---|---|---|---|
| Quadrant | BADHDUFLAG | Total packets | Discarded packets |
| A | 0 | 102 | 0 |
| B | 0 | 102 | 0 |
| C | 0 | 102 | 0 |
| D | 0 | 102 | 0 |
| Quadrant | Total seconds | Saturated seconds | Saturation percentage |
|---|---|---|---|
| A | 5046 | 17 | 0.336901% |
| B | 5046 | 10 | 0.198177% |
| C | 5046 | 285 | 5.648038% |
| D | 5046 | 163 | 3.230281% |
Noise dominated data is calculated using 1-second bins in cleaned event files. If a bin has >2000 counts, and if more than 50% of those come from <1% of pixels, then it is considered to be noise-dominated and hence unusable.
| Quadrant | # 1 sec bins | Bins with >0 counts | Bins with >2000 counts | High rate bins dominated by noise | Noise dominated (total time) | Noise dominated (detector-on time) | Marked lightcurve |
|---|---|---|---|---|---|---|---|
| A | 7080 | 5048 | 4 | 4 | 0.06% | 0.08% | 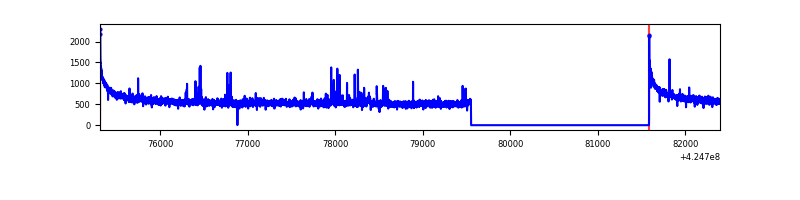 |
| B | 7079 | 5046 | 3 | 3 | 0.04% | 0.06% | 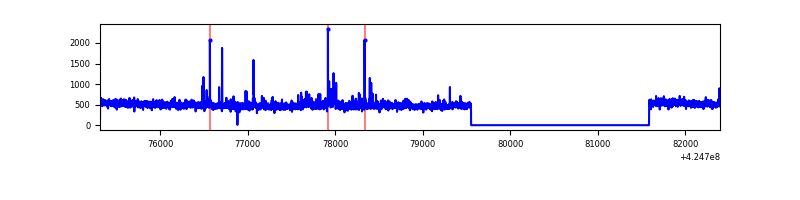 |
| C | 7079 | 5046 | 277 | 277 | 3.91% | 5.49% | 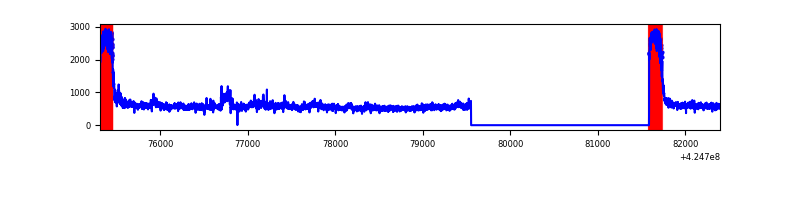 |
| D | 7079 | 5046 | 167 | 167 | 2.36% | 3.31% | 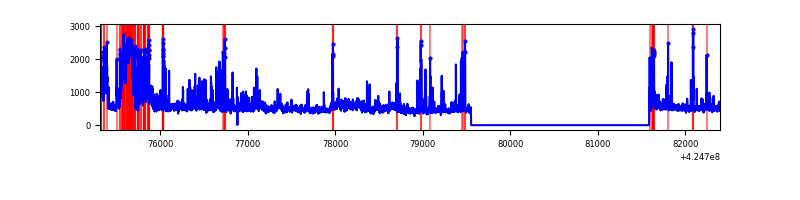 |
Top three noisy pixels from each quadrant. If the there are fewer than three noisy pixels in the level2.evt file, extra rows are filled as -1
| Pixel properties | Quadrant properties | ||||||
|---|---|---|---|---|---|---|---|
| Quadrant | DetID | PixID | Counts | Sigma | Mean | Median | Sigma |
| A | 10 | 83 | 506636 | 4083.54 | 614 | 604 | 123.9 |
| A | 2 | 79 | 48214 | 384.2 | 614 | 604 | 123.9 |
| A | 13 | 248 | 14871 | 115.13 | 614 | 604 | 123.9 |
| B | 0 | 245 | 84090 | 715.17 | 604 | 591 | 116.8 |
| B | 5 | 255 | 22445 | 187.18 | 604 | 591 | 116.8 |
| B | 0 | 183 | 20200 | 167.95 | 604 | 591 | 116.8 |
| C | 0 | 10 | 1123288 | 8503.03 | 563 | 567 | 132.0 |
| C | 15 | 214 | 216630 | 1636.37 | 563 | 567 | 132.0 |
| C | 13 | 61 | 3612 | 23.06 | 563 | 567 | 132.0 |
| D | 12 | 79 | 659966 | 4579.14 | 587 | 572 | 144.0 |
| D | 2 | 120 | 199404 | 1380.78 | 587 | 572 | 144.0 |
| D | 2 | 249 | 188015 | 1301.69 | 587 | 572 | 144.0 |
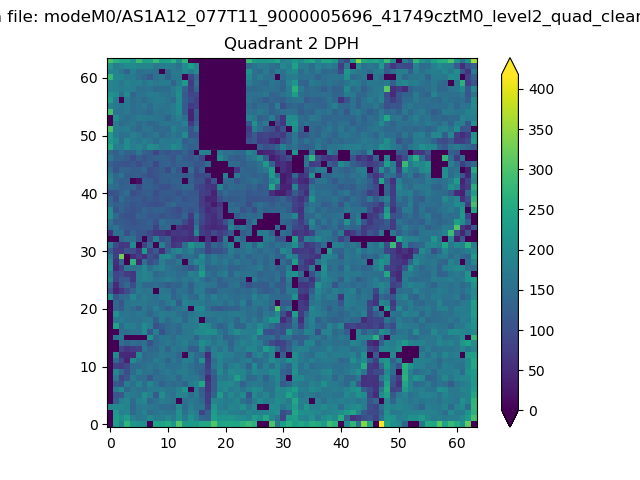
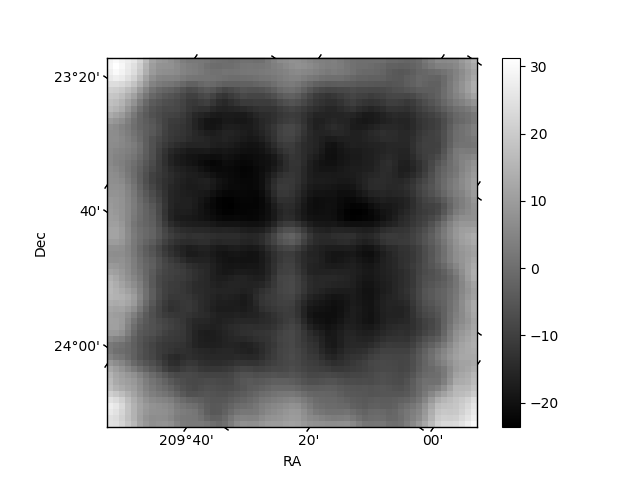
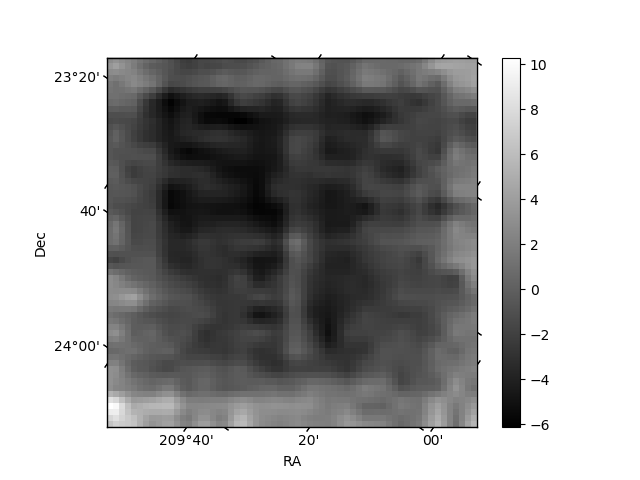
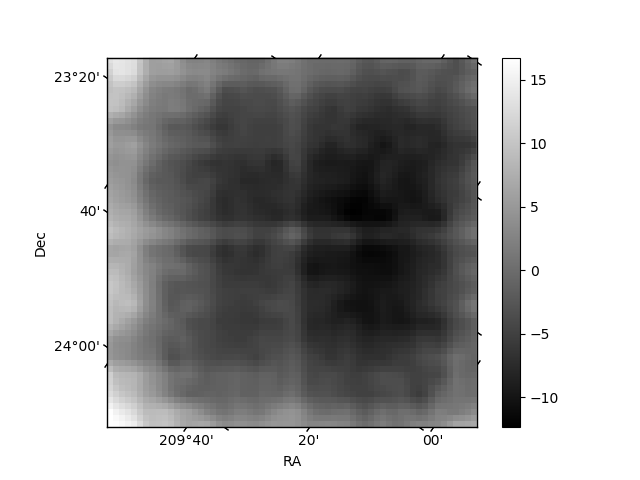
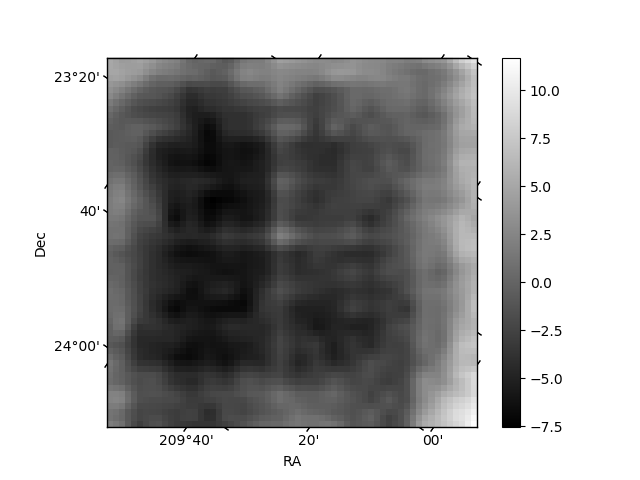
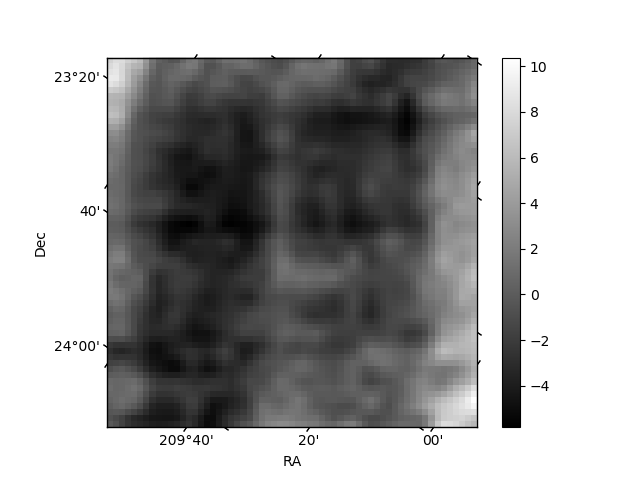
Histogram calculated using DETX and DETY for each event in the final _common_clean file
| Quadrant A | 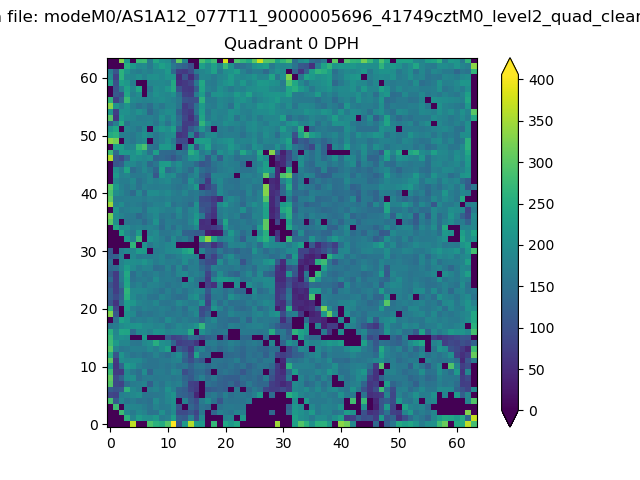 |
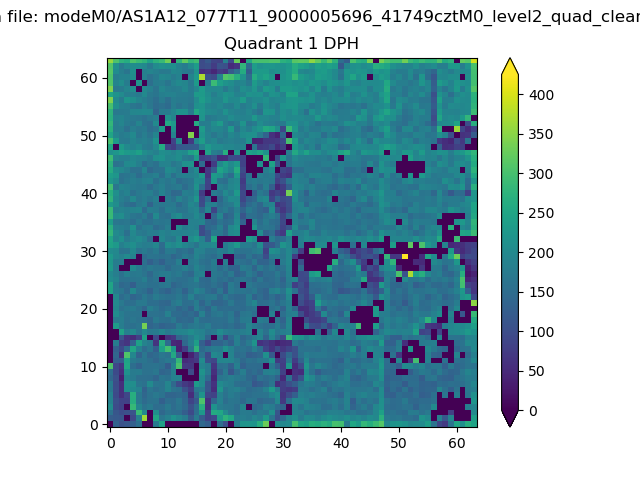 |
Quadrant B |
|---|---|---|---|
| Quadrant D | 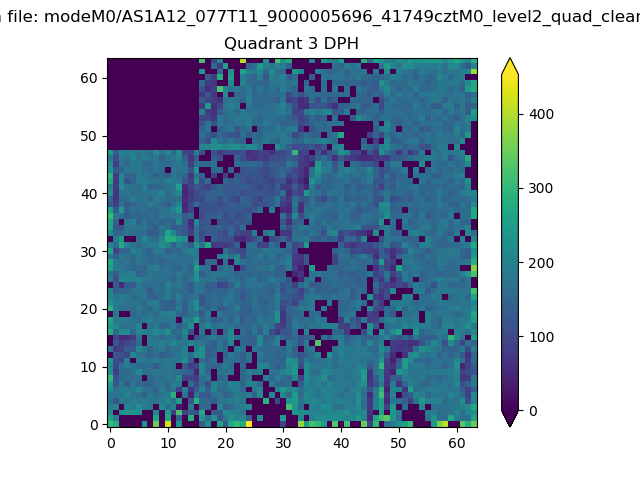 |
 |
Quadrant C |
| Plot type | Count rate plots | Images |
|---|---|---|
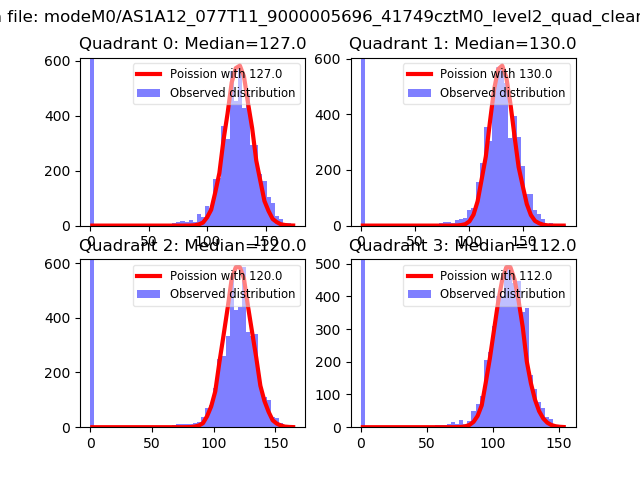
| Comparison with Poisson distribution Blue bars denote a histogram of data divided into 1 sec bins. Red curve is a Poisson curve with rate = median count rate of data. |
 |
 |
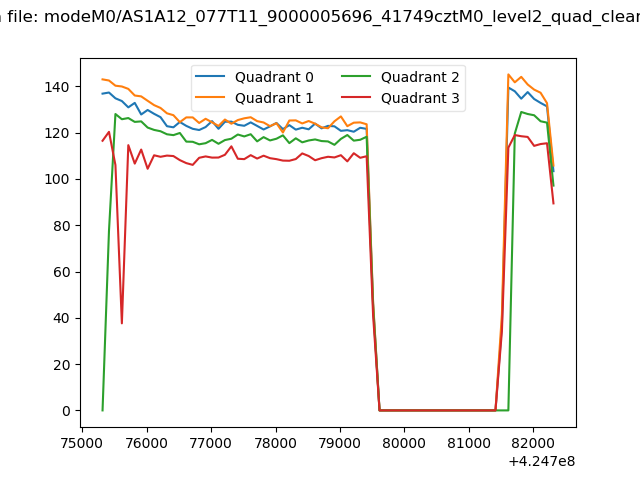
| Quadrant-wise count rates Data is divided into 100 sec bins |
 |
|
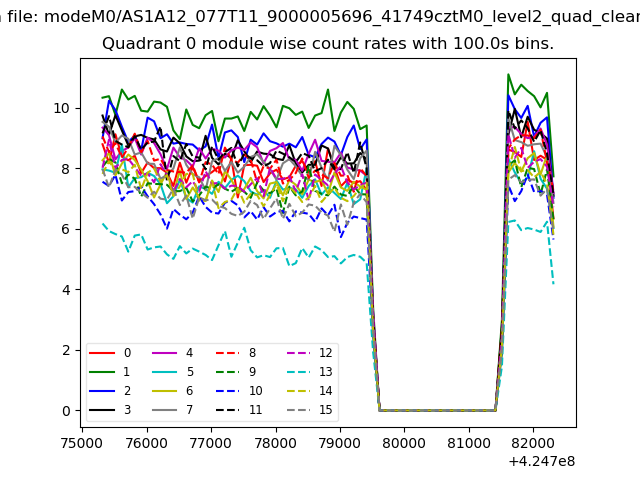
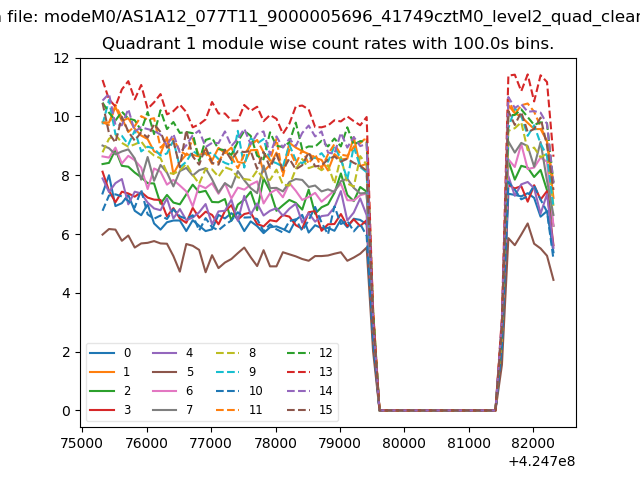
| Module-wise count rates for Quadrant A Data is divided into 100 sec bins |
 |
 |
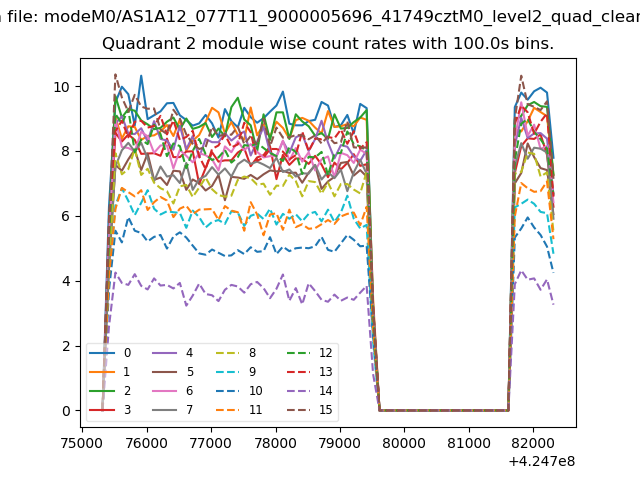
| Module-wise count rates for Quadrant B Data is divided into 100 sec bins |
 |
 |
| Module-wise count rates for Quadrant C Data is divided into 100 sec bins |
 |
 |
| Module-wise count rates for Quadrant D Data is divided into 100 sec bins |
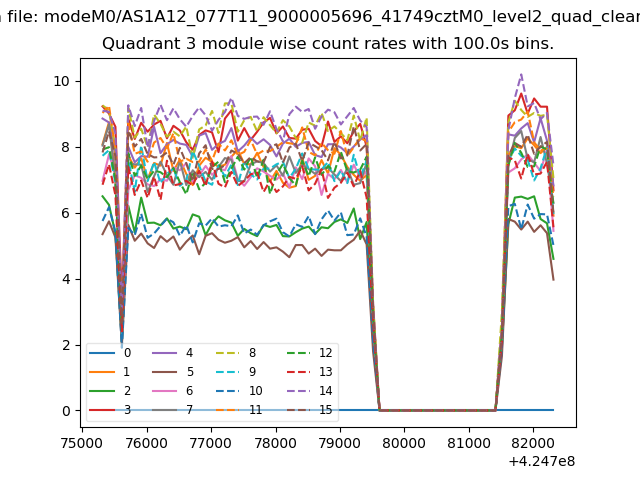 |
 |
| Parameter | Plot |
|---|---|
| CZT HV Monitor | 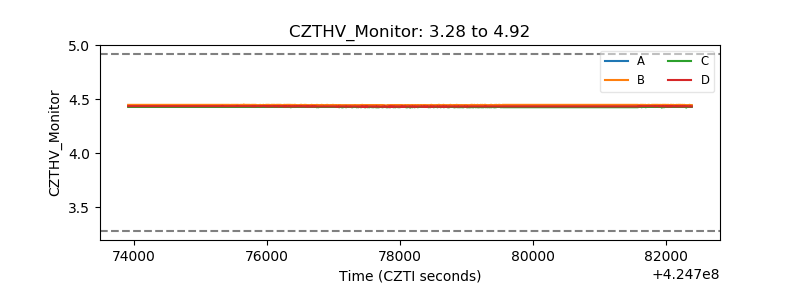 |
| D_VDD | 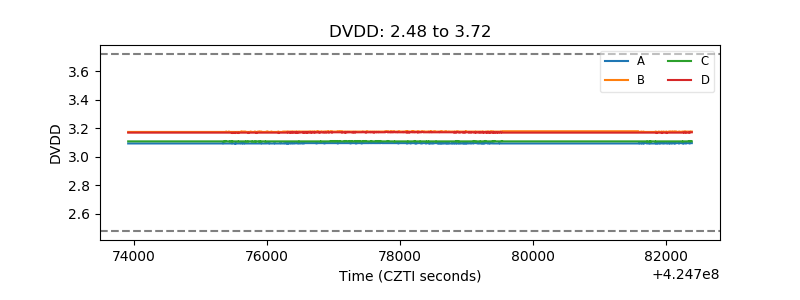 |
| Temperature 1 | 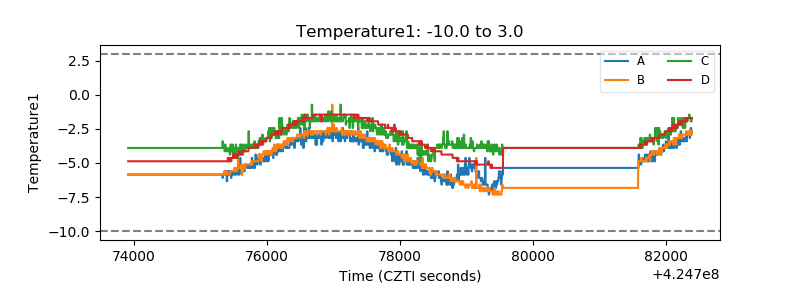 |
| Veto HV Monitor |  |
| Veto LLD | 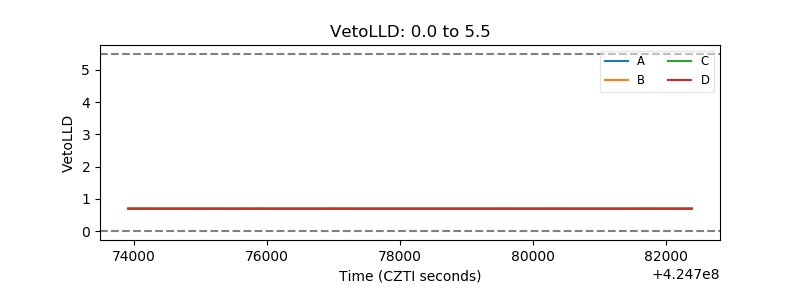 |
| Alpha Counter | 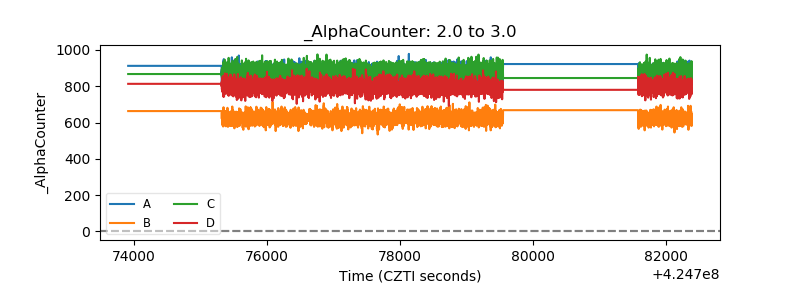 |
| _CPM_Rate | 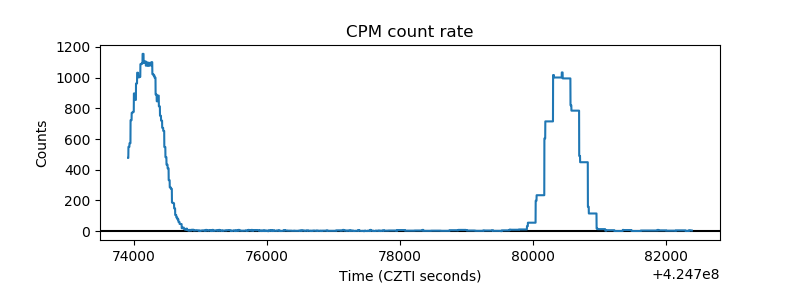 |
| CZT Counter | 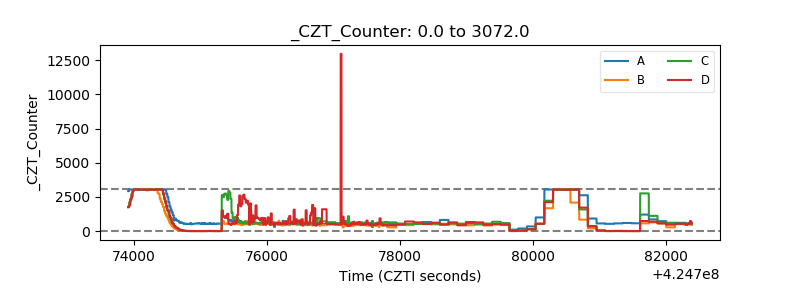 |
| +2.5 Volts monitor | 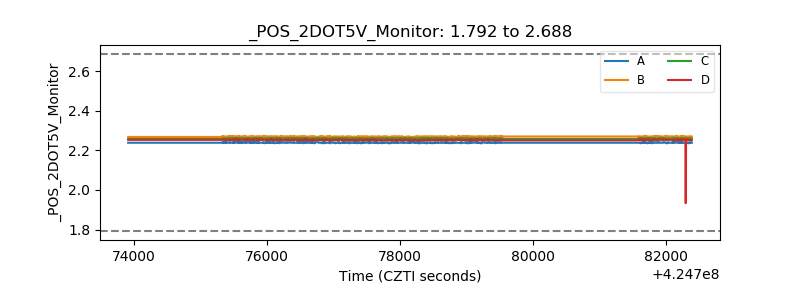 |
| +5 Volts monitor | 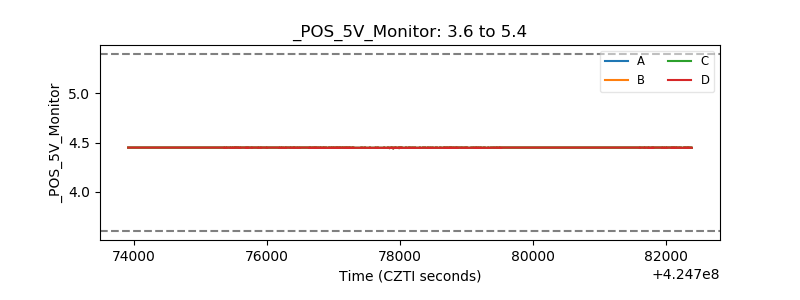 |
| _ROLL_ROT | 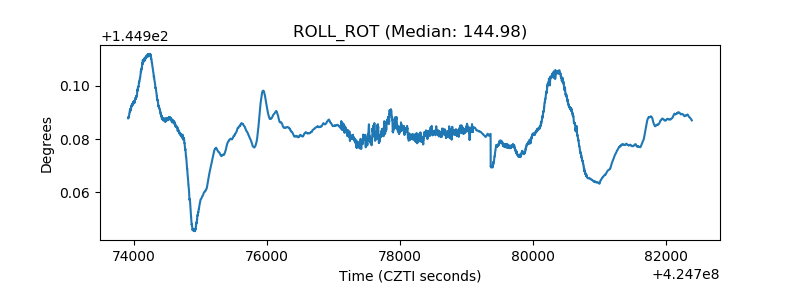 |
| _Roll_DEC | 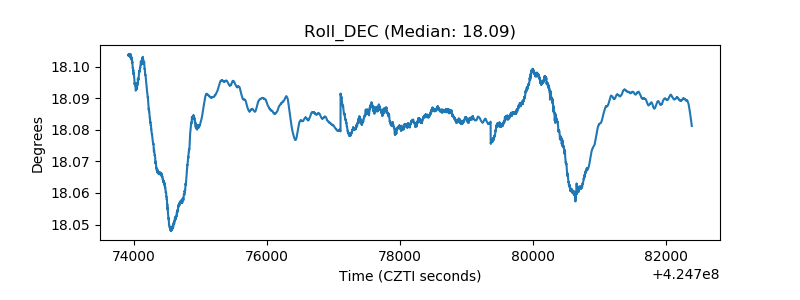 |
| _Roll_RA | 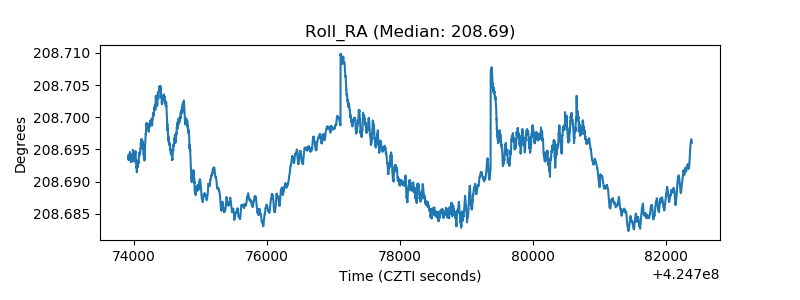 |
| Veto Counter | 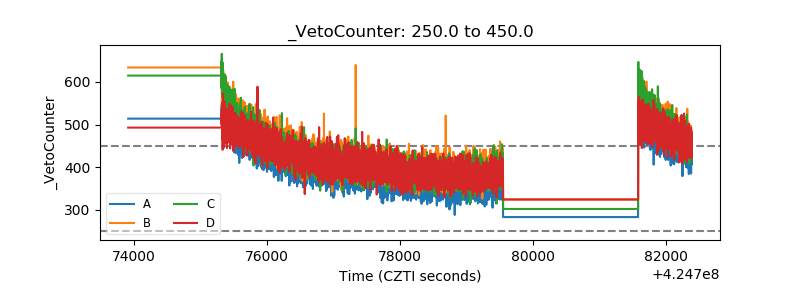 |