| Param | Original file | Final file |
|---|---|---|
| Filename | modeM0/AS1A12_077T11_9000005696_41750cztM0_level2.fits | modeM0/AS1A12_077T11_9000005696_41750cztM0_level2_quad_clean.evt |
| Size (bytes) | 364,078,080 | 93,686,400 |
| Size | 347.2 MB | 89.3 MB |
| Events in quadrant A | 2,994,952 | 654,734 |
| Events in quadrant B | 2,562,431 | 664,747 |
| Events in quadrant C | 3,424,449 | 589,371 |
| Events in quadrant D | 4,091,789 | 564,941 |
| Mode M9 | |||
|---|---|---|---|
| Quadrant | BADHDUFLAG | Total packets | Discarded packets |
| A | 0 | 30 | 0 |
| B | 0 | 31 | 0 |
| C | 0 | 31 | 0 |
| D | 0 | 31 | 0 |
| Mode M0 | |||
|---|---|---|---|
| Quadrant | BADHDUFLAG | Total packets | Discarded packets |
| A | 0 | 11999 | 2 |
| B | 0 | 10778 | 2 |
| C | 0 | 13147 | 2 |
| D | 0 | 15591 | 3 |
| Mode SS | |||
|---|---|---|---|
| Quadrant | BADHDUFLAG | Total packets | Discarded packets |
| A | 0 | 106 | 0 |
| B | 0 | 106 | 0 |
| C | 0 | 106 | 0 |
| D | 0 | 106 | 0 |
| Quadrant | Total seconds | Saturated seconds | Saturation percentage |
|---|---|---|---|
| A | 5185 | 18 | 0.347155% |
| B | 5185 | 6 | 0.115718% |
| C | 5185 | 286 | 5.515911% |
| D | 5184 | 191 | 3.684414% |
Noise dominated data is calculated using 1-second bins in cleaned event files. If a bin has >2000 counts, and if more than 50% of those come from <1% of pixels, then it is considered to be noise-dominated and hence unusable.
| Quadrant | # 1 sec bins | Bins with >0 counts | Bins with >2000 counts | High rate bins dominated by noise | Noise dominated (total time) | Noise dominated (detector-on time) | Marked lightcurve |
|---|---|---|---|---|---|---|---|
| A | 7308 | 5186 | 3 | 3 | 0.04% | 0.06% | 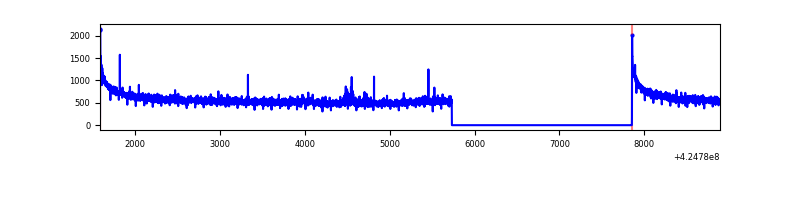 |
| B | 7307 | 5184 | 1 | 1 | 0.01% | 0.02% | 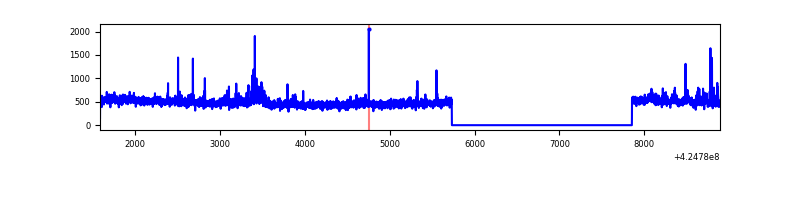 |
| C | 7307 | 5184 | 277 | 277 | 3.79% | 5.34% |  |
| D | 7306 | 5183 | 197 | 197 | 2.70% | 3.80% | 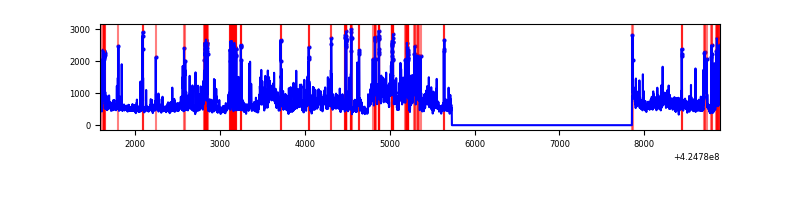 |
Top three noisy pixels from each quadrant. If the there are fewer than three noisy pixels in the level2.evt file, extra rows are filled as -1
| Pixel properties | Quadrant properties | ||||||
|---|---|---|---|---|---|---|---|
| Quadrant | DetID | PixID | Counts | Sigma | Mean | Median | Sigma |
| A | 10 | 83 | 531984 | 4138.82 | 626 | 615 | 128.4 |
| A | 2 | 79 | 27896 | 212.49 | 626 | 615 | 128.4 |
| A | 13 | 254 | 8294 | 59.81 | 626 | 615 | 128.4 |
| B | 0 | 186 | 51629 | 430.61 | 612 | 596 | 118.5 |
| B | 0 | 245 | 30494 | 252.28 | 612 | 596 | 118.5 |
| B | 15 | 35 | 30272 | 250.4 | 612 | 596 | 118.5 |
| C | 0 | 10 | 948807 | 7068.62 | 576 | 582 | 134.1 |
| C | 15 | 214 | 221557 | 1647.28 | 576 | 582 | 134.1 |
| C | 7 | 220 | 3873 | 24.53 | 576 | 582 | 134.1 |
| D | 12 | 79 | 806880 | 5491.61 | 599 | 583 | 146.8 |
| D | 2 | 120 | 265455 | 1804.02 | 599 | 583 | 146.8 |
| D | 2 | 249 | 262589 | 1784.5 | 599 | 583 | 146.8 |
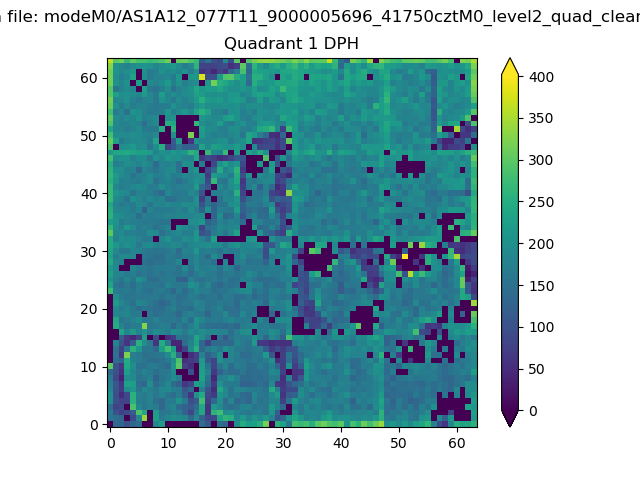
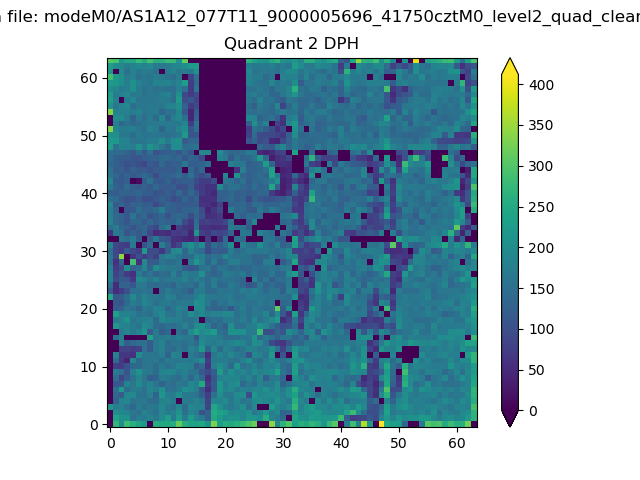
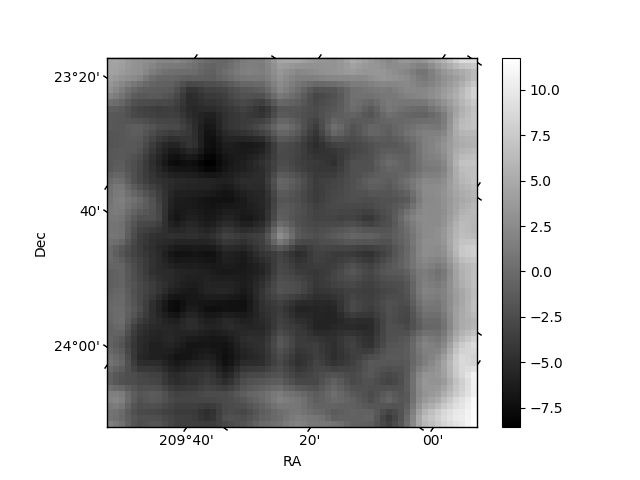
Histogram calculated using DETX and DETY for each event in the final _common_clean file
| Quadrant A | 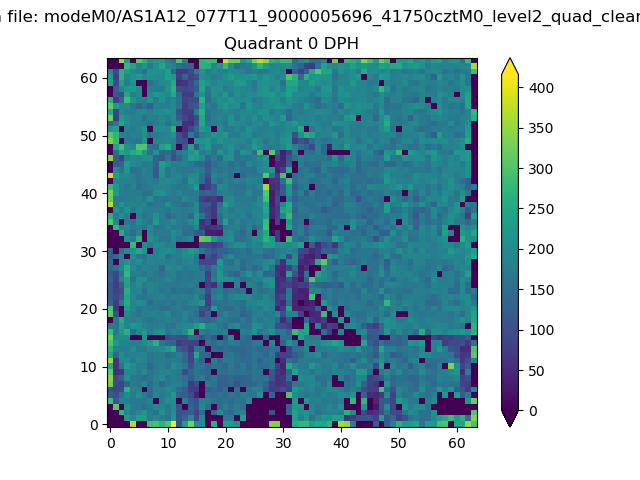 |
 |
Quadrant B |
|---|---|---|---|
| Quadrant D | 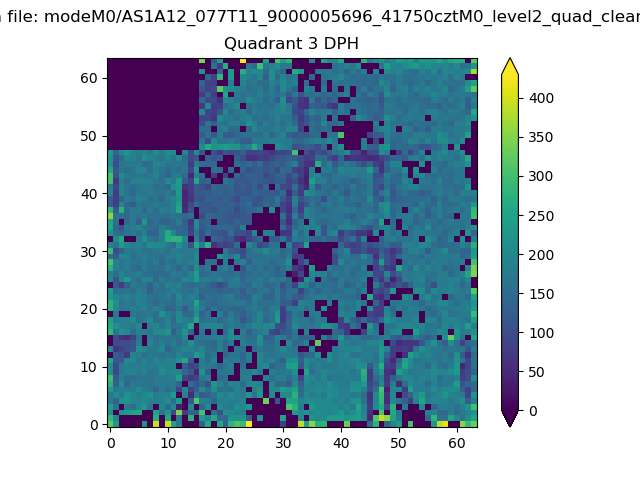 |
 |
Quadrant C |
| Plot type | Count rate plots | Images |
|---|---|---|
| Comparison with Poisson distribution Blue bars denote a histogram of data divided into 1 sec bins. Red curve is a Poisson curve with rate = median count rate of data. |
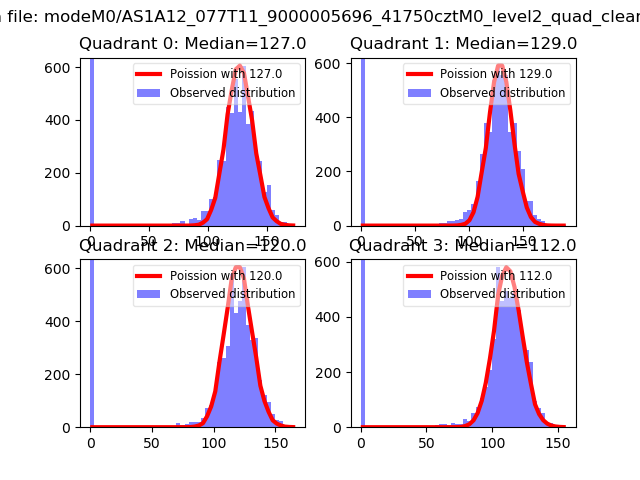 |
 |
| Quadrant-wise count rates Data is divided into 100 sec bins |
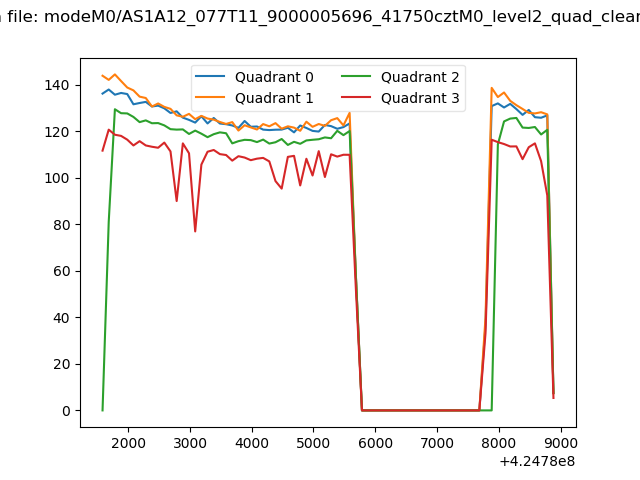 |
|
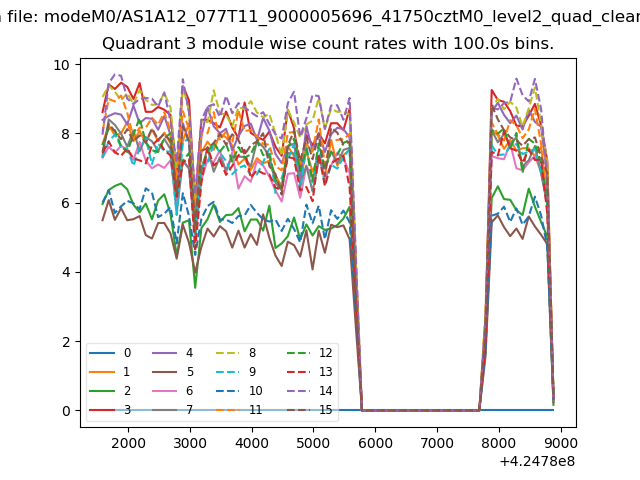
| Module-wise count rates for Quadrant A Data is divided into 100 sec bins |
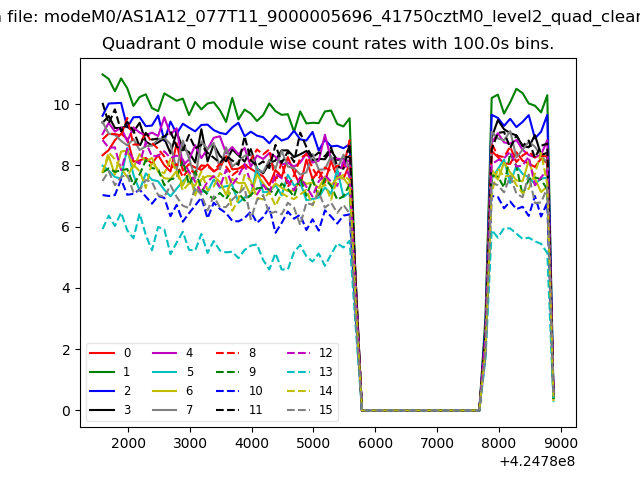 |
 |
| Module-wise count rates for Quadrant B Data is divided into 100 sec bins |
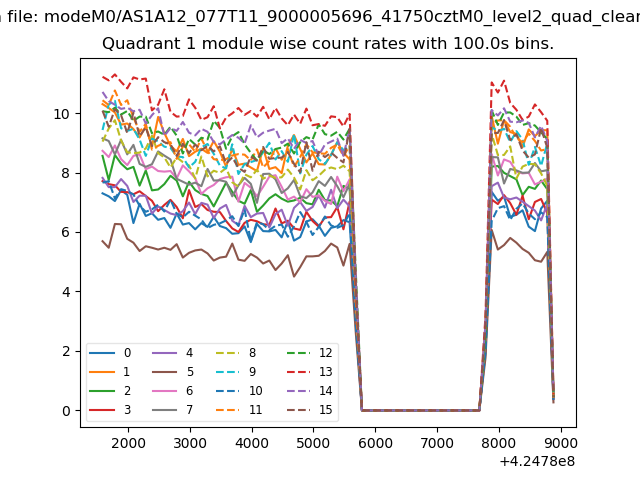 |
 |
| Module-wise count rates for Quadrant C Data is divided into 100 sec bins |
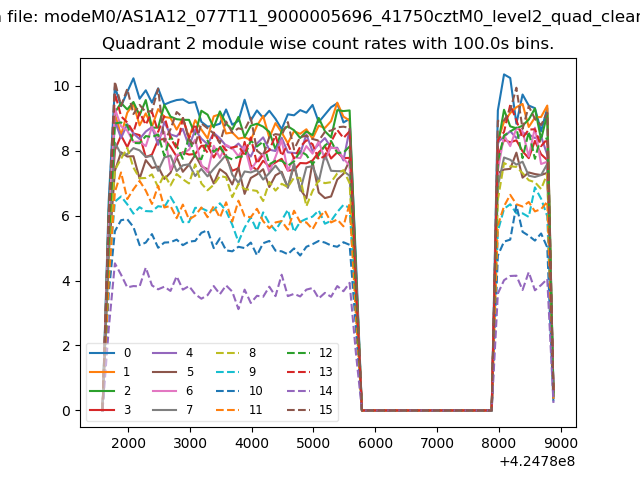 |
 |
| Module-wise count rates for Quadrant D Data is divided into 100 sec bins |
 |
 |
| Parameter | Plot |
|---|---|
| CZT HV Monitor | 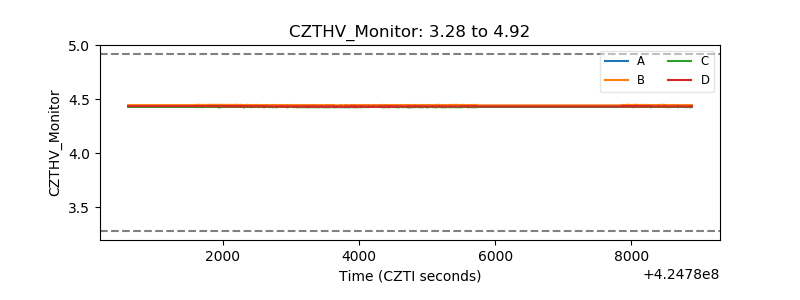 |
| D_VDD | 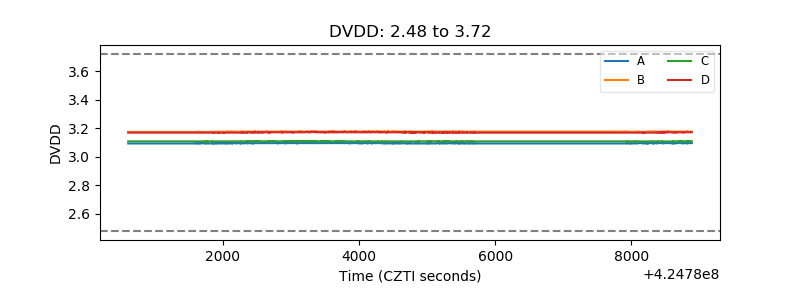 |
| Temperature 1 | 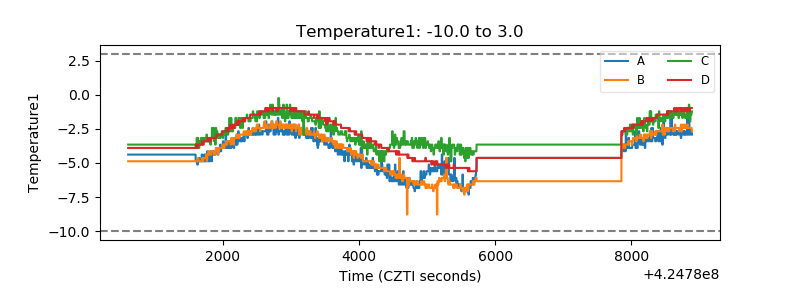 |
| Veto HV Monitor | 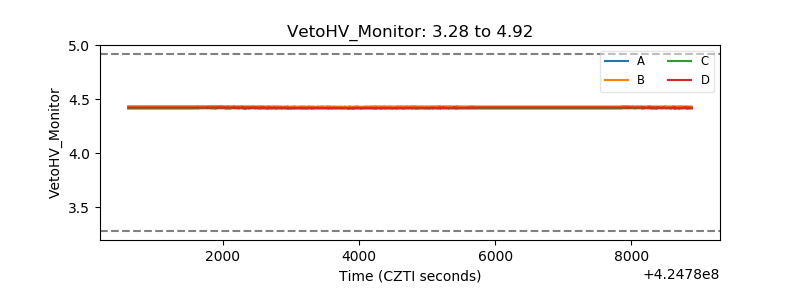 |
| Veto LLD | 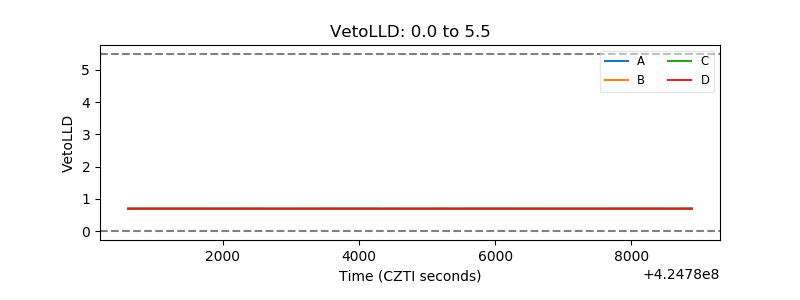 |
| Alpha Counter | 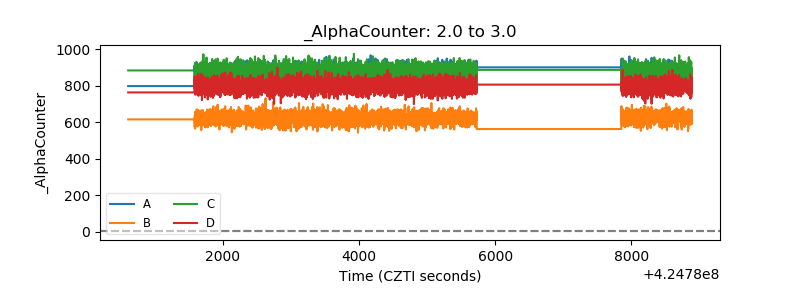 |
| _CPM_Rate | 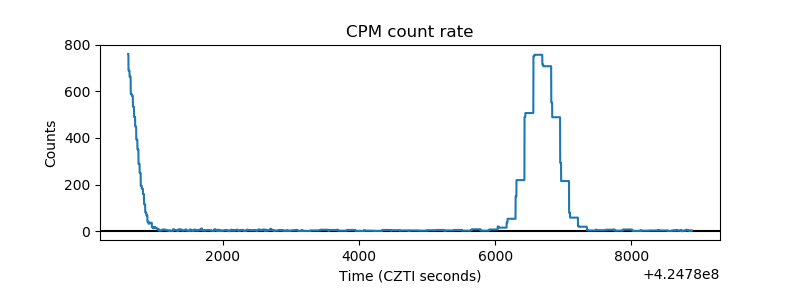 |
| CZT Counter | 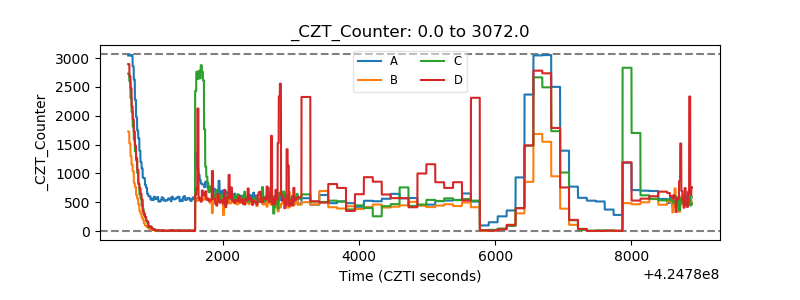 |
| +2.5 Volts monitor | 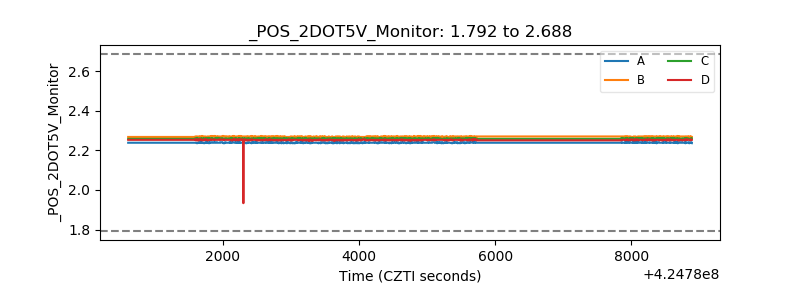 |
| +5 Volts monitor | 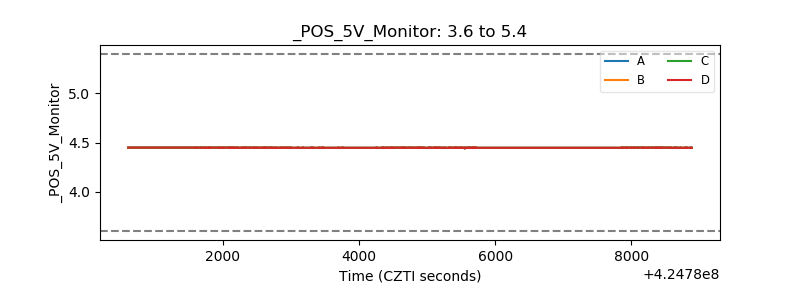 |
| _ROLL_ROT | 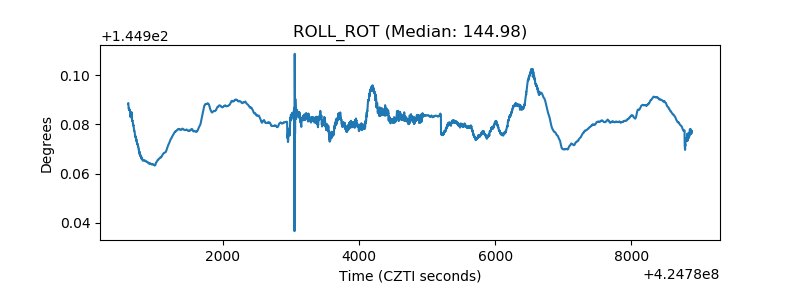 |
| _Roll_DEC | 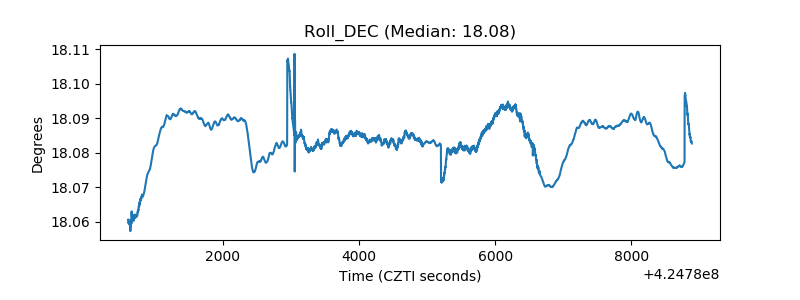 |
| _Roll_RA |  |
| Veto Counter | 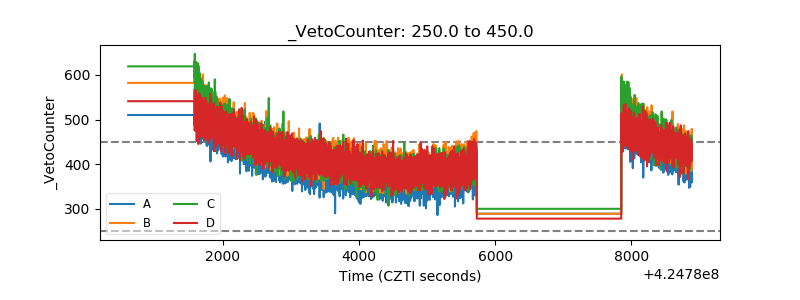 |