| Param | Original file | Final file |
|---|---|---|
| Filename | modeM0/AS1A12_077T11_9000005696_41751cztM0_level2.fits | modeM0/AS1A12_077T11_9000005696_41751cztM0_level2_quad_clean.evt |
| Size (bytes) | 339,442,560 | 86,785,920 |
| Size | 323.7 MB | 82.8 MB |
| Events in quadrant A | 2,717,391 | 603,896 |
| Events in quadrant B | 2,451,354 | 608,650 |
| Events in quadrant C | 2,921,354 | 557,170 |
| Events in quadrant D | 4,088,900 | 510,380 |
| Mode M9 | |||
|---|---|---|---|
| Quadrant | BADHDUFLAG | Total packets | Discarded packets |
| A | 0 | 21 | 0 |
| B | 0 | 21 | 0 |
| C | 0 | 21 | 0 |
| D | 0 | 21 | 0 |
| Mode M0 | |||
|---|---|---|---|
| Quadrant | BADHDUFLAG | Total packets | Discarded packets |
| A | 0 | 11044 | 1 |
| B | 0 | 10480 | 1 |
| C | 0 | 11494 | 1 |
| D | 0 | 15516 | 1 |
| Mode SS | |||
|---|---|---|---|
| Quadrant | BADHDUFLAG | Total packets | Discarded packets |
| A | 0 | 102 | 0 |
| B | 0 | 102 | 0 |
| C | 0 | 102 | 0 |
| D | 0 | 102 | 0 |
| Quadrant | Total seconds | Saturated seconds | Saturation percentage |
|---|---|---|---|
| A | 4957 | 4 | 0.080694% |
| B | 4957 | 30 | 0.605205% |
| C | 4957 | 187 | 3.772443% |
| D | 4958 | 304 | 6.131505% |
Noise dominated data is calculated using 1-second bins in cleaned event files. If a bin has >2000 counts, and if more than 50% of those come from <1% of pixels, then it is considered to be noise-dominated and hence unusable.
| Quadrant | # 1 sec bins | Bins with >0 counts | Bins with >2000 counts | High rate bins dominated by noise | Noise dominated (total time) | Noise dominated (detector-on time) | Marked lightcurve |
|---|---|---|---|---|---|---|---|
| A | 7080 | 4958 | 2 | 2 | 0.03% | 0.04% | 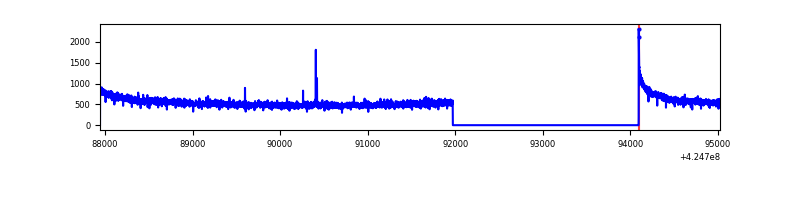 |
| B | 7080 | 4957 | 21 | 21 | 0.30% | 0.42% | 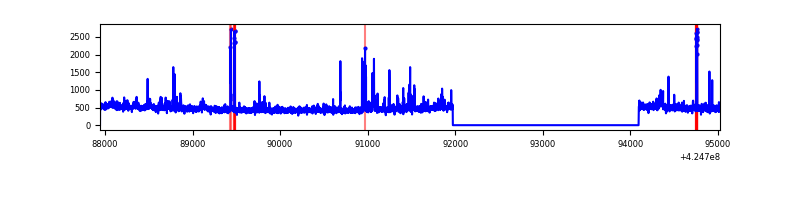 |
| C | 7080 | 4958 | 179 | 179 | 2.53% | 3.61% | 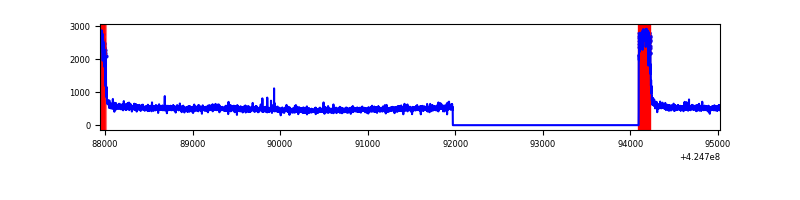 |
| D | 7081 | 4958 | 273 | 273 | 3.86% | 5.51% | 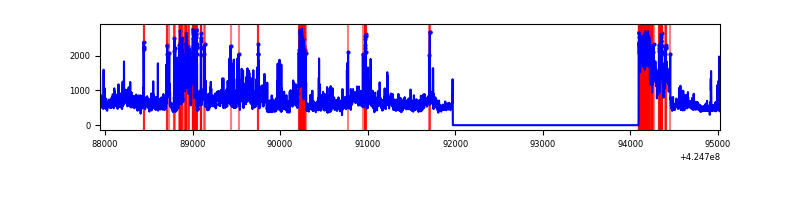 |
Top three noisy pixels from each quadrant. If the there are fewer than three noisy pixels in the level2.evt file, extra rows are filled as -1
| Pixel properties | Quadrant properties | ||||||
|---|---|---|---|---|---|---|---|
| Quadrant | DetID | PixID | Counts | Sigma | Mean | Median | Sigma |
| A | 10 | 83 | 473907 | 3982.25 | 578 | 568 | 118.9 |
| A | 13 | 254 | 7876 | 61.48 | 578 | 568 | 118.9 |
| A | 7 | 3 | 6238 | 47.7 | 578 | 568 | 118.9 |
| B | 5 | 255 | 88780 | 807.08 | 564 | 549 | 109.3 |
| B | 0 | 245 | 52481 | 475.04 | 564 | 549 | 109.3 |
| B | 4 | 141 | 38117 | 343.65 | 564 | 549 | 109.3 |
| C | 0 | 10 | 581754 | 4569.67 | 542 | 545 | 127.2 |
| C | 15 | 214 | 211478 | 1658.43 | 542 | 545 | 127.2 |
| C | 14 | 67 | 7516 | 54.81 | 542 | 545 | 127.2 |
| D | 12 | 79 | 1107952 | 8196.28 | 550 | 536 | 135.1 |
| D | 13 | 249 | 410758 | 3036.16 | 550 | 536 | 135.1 |
| D | 2 | 120 | 207416 | 1531.17 | 550 | 536 | 135.1 |
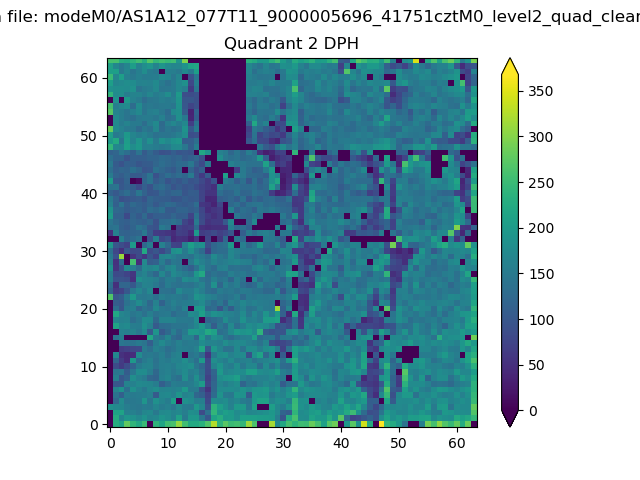
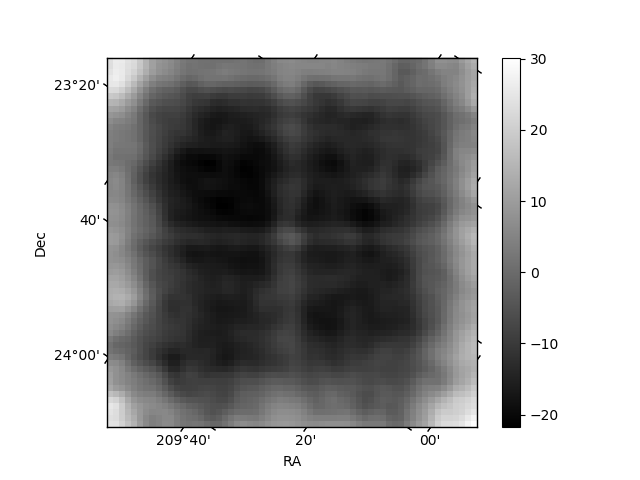
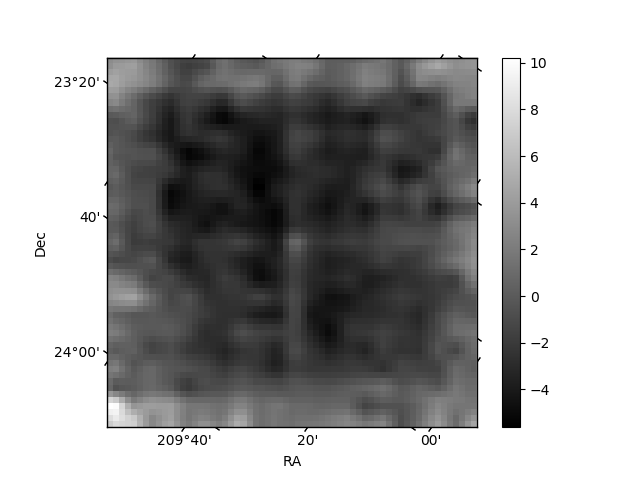
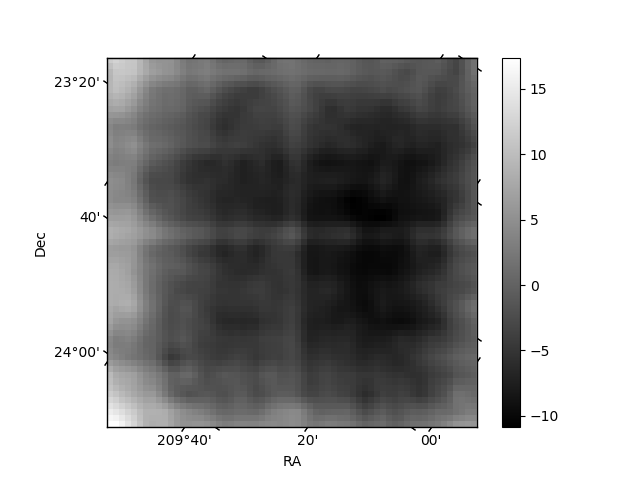
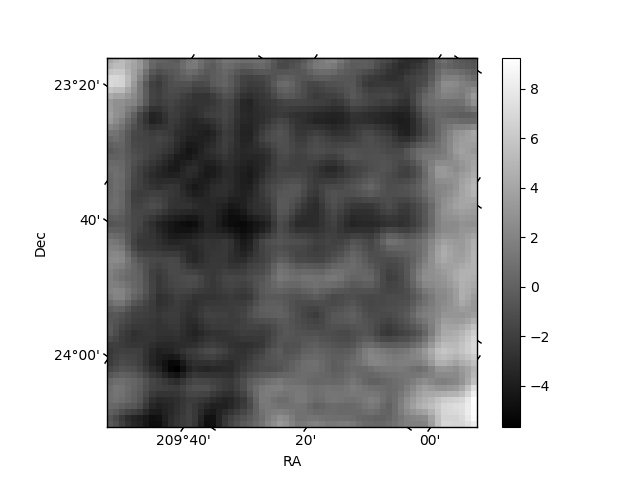
Histogram calculated using DETX and DETY for each event in the final _common_clean file
| Quadrant A | 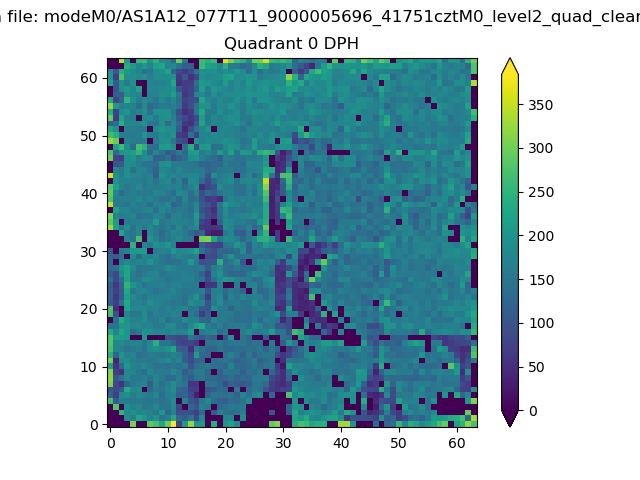 |
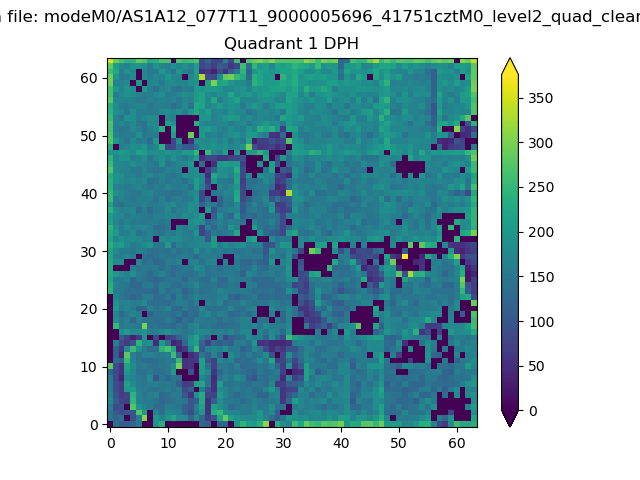 |
Quadrant B |
|---|---|---|---|
| Quadrant D | 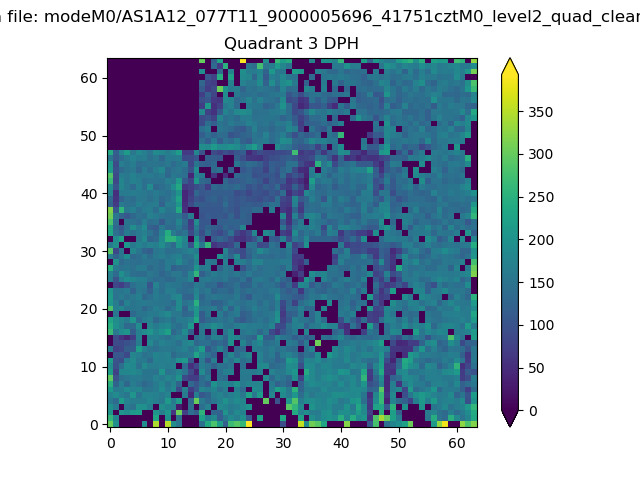 |
 |
Quadrant C |
| Plot type | Count rate plots | Images |
|---|---|---|
| Comparison with Poisson distribution Blue bars denote a histogram of data divided into 1 sec bins. Red curve is a Poisson curve with rate = median count rate of data. |
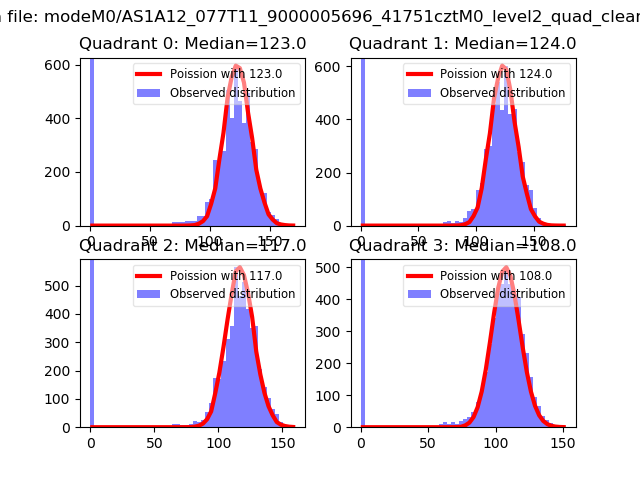 |
 |
| Quadrant-wise count rates Data is divided into 100 sec bins |
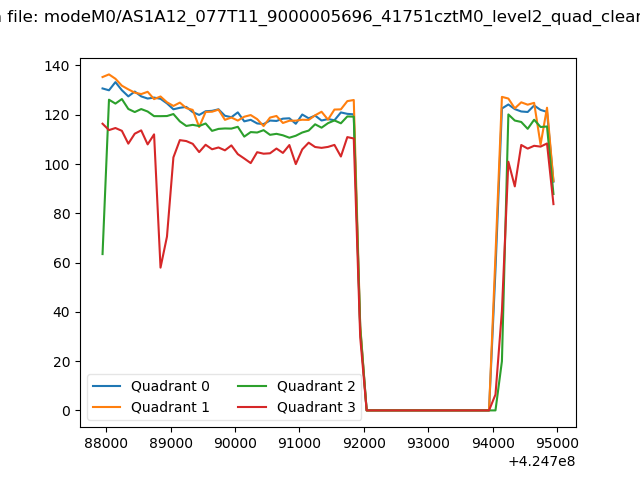 |
|
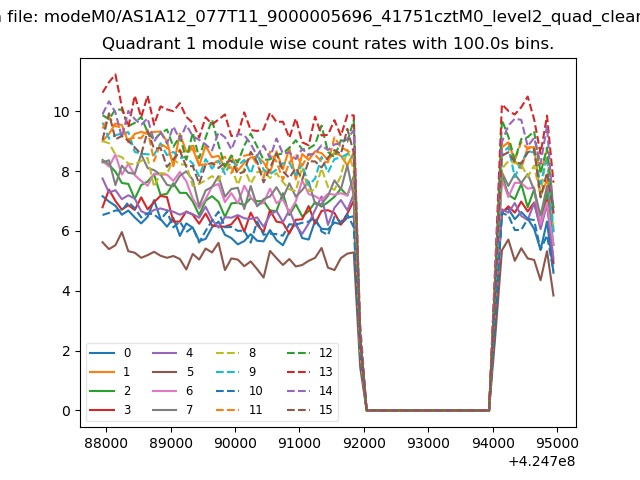
| Module-wise count rates for Quadrant A Data is divided into 100 sec bins |
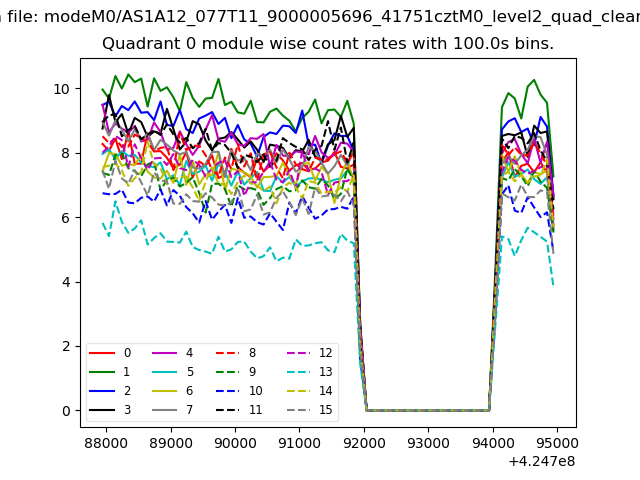 |
 |
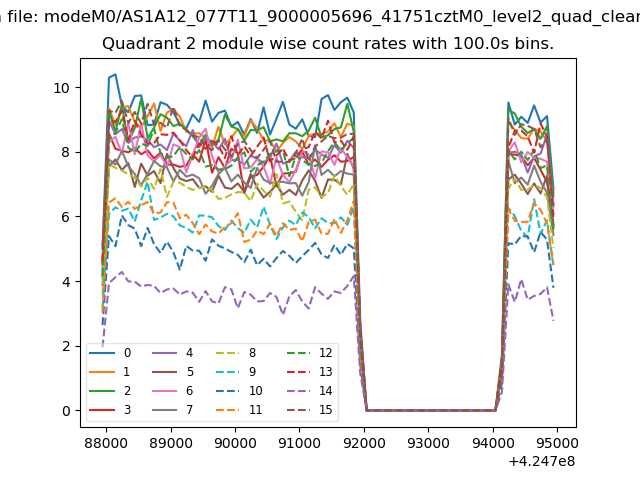
| Module-wise count rates for Quadrant B Data is divided into 100 sec bins |
 |
 |
| Module-wise count rates for Quadrant C Data is divided into 100 sec bins |
 |
 |
| Module-wise count rates for Quadrant D Data is divided into 100 sec bins |
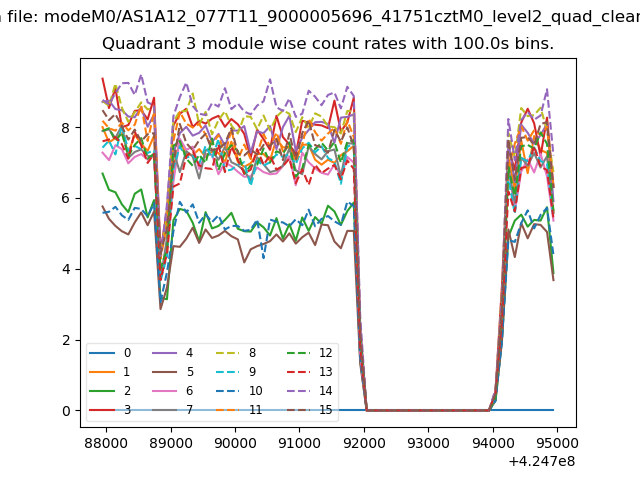 |
 |
| Parameter | Plot |
|---|---|
| CZT HV Monitor | 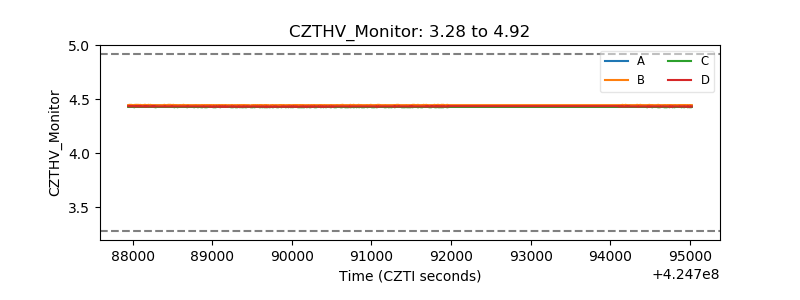 |
| D_VDD | 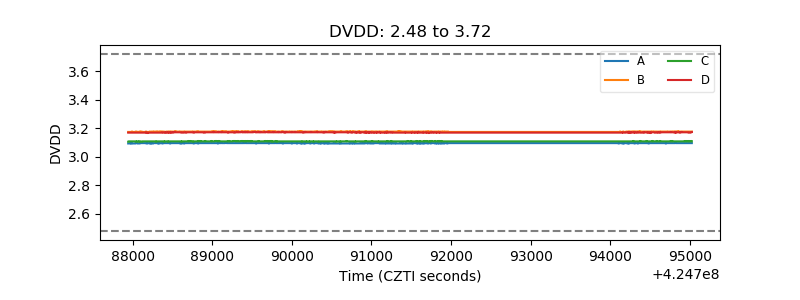 |
| Temperature 1 | 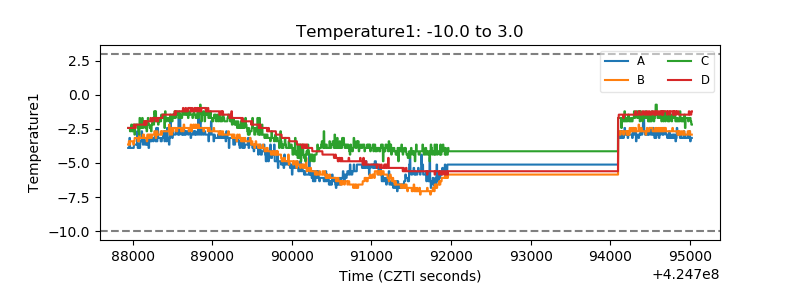 |
| Veto HV Monitor | 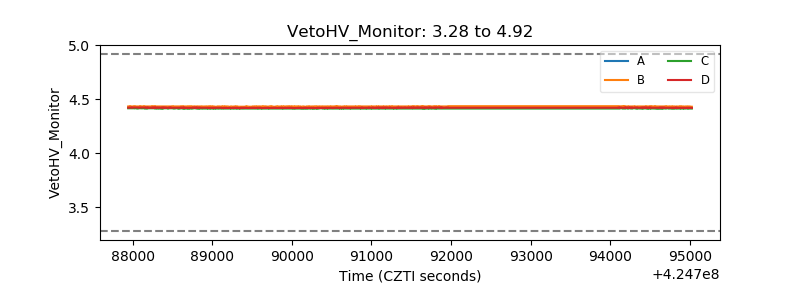 |
| Veto LLD | 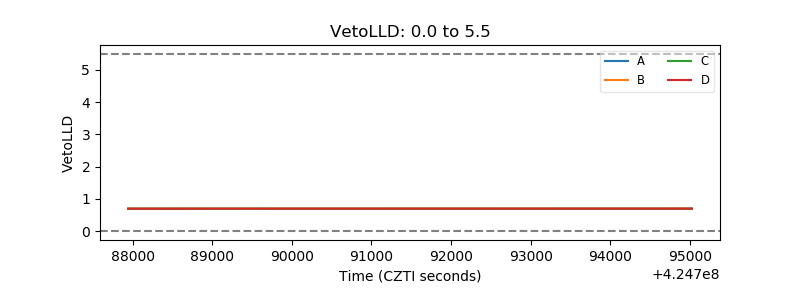 |
| Alpha Counter | 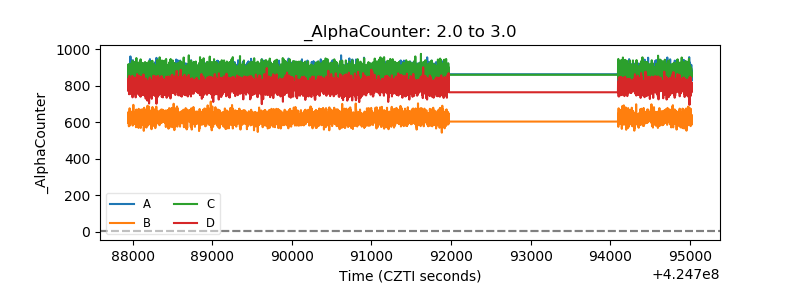 |
| _CPM_Rate |  |
| CZT Counter | 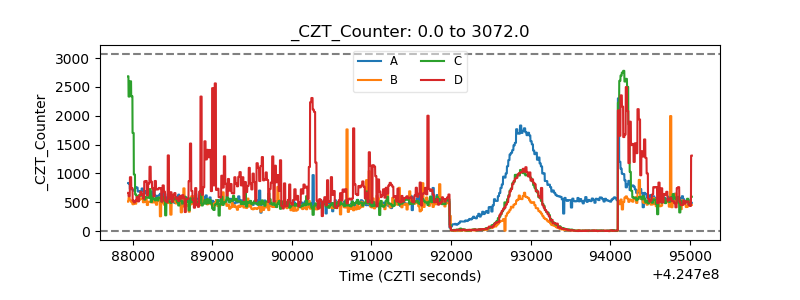 |
| +2.5 Volts monitor | 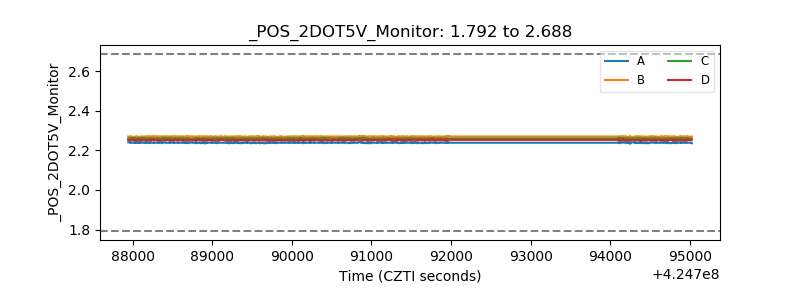 |
| +5 Volts monitor | 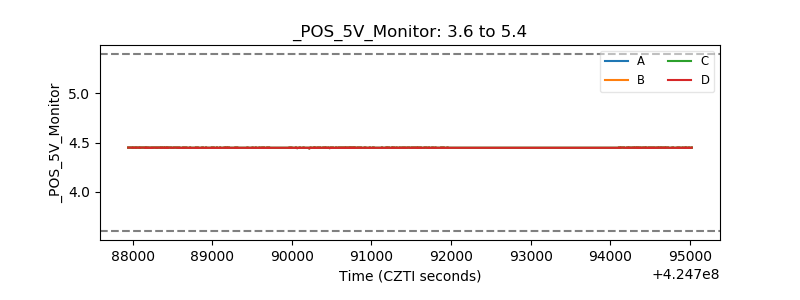 |
| _ROLL_ROT | 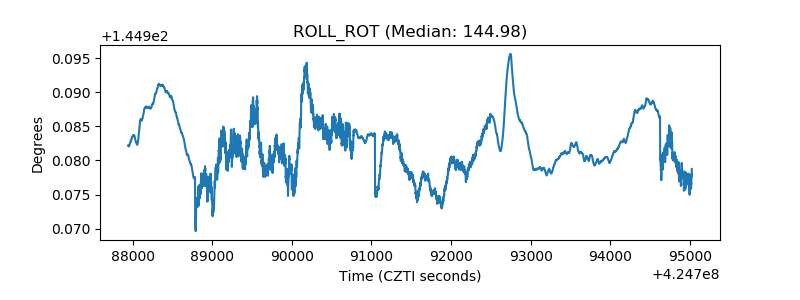 |
| _Roll_DEC | 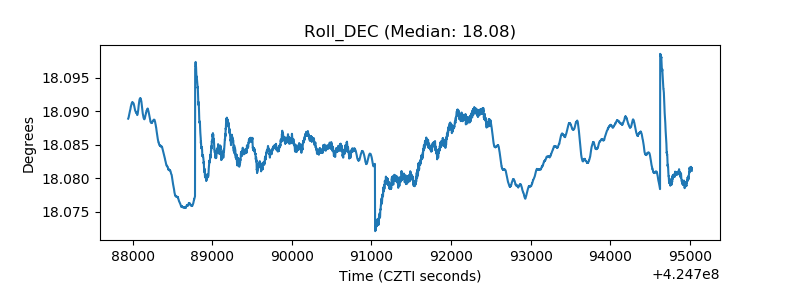 |
| _Roll_RA | 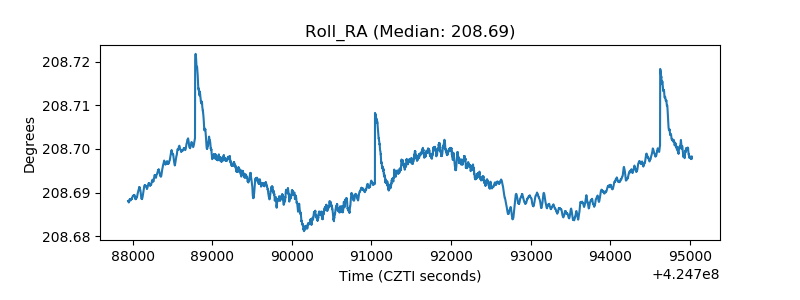 |
| Veto Counter | 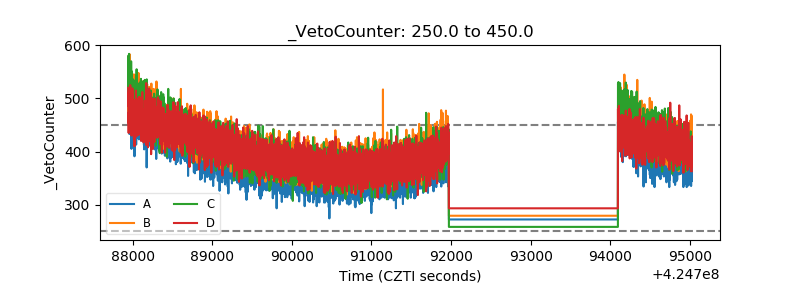 |