| Param | Original file | Final file |
|---|---|---|
| Filename | modeM0/AS1A12_077T11_9000005696_41752cztM0_level2.fits | modeM0/AS1A12_077T11_9000005696_41752cztM0_level2_quad_clean.evt |
| Size (bytes) | 339,981,120 | 85,357,440 |
| Size | 324.2 MB | 81.4 MB |
| Events in quadrant A | 2,745,551 | 588,552 |
| Events in quadrant B | 2,539,193 | 592,026 |
| Events in quadrant C | 3,084,528 | 538,019 |
| Events in quadrant D | 3,820,830 | 510,598 |
| Mode M9 | |||
|---|---|---|---|
| Quadrant | BADHDUFLAG | Total packets | Discarded packets |
| A | 0 | 24 | 0 |
| B | 0 | 24 | 0 |
| C | 0 | 25 | 0 |
| D | 0 | 25 | 0 |
| Mode M0 | |||
|---|---|---|---|
| Quadrant | BADHDUFLAG | Total packets | Discarded packets |
| A | 0 | 11224 | 2 |
| B | 0 | 10980 | 2 |
| C | 0 | 12117 | 2 |
| D | 0 | 14701 | 2 |
| Mode SS | |||
|---|---|---|---|
| Quadrant | BADHDUFLAG | Total packets | Discarded packets |
| A | 0 | 104 | 0 |
| B | 0 | 104 | 0 |
| C | 0 | 104 | 0 |
| D | 0 | 104 | 0 |
| Quadrant | Total seconds | Saturated seconds | Saturation percentage |
|---|---|---|---|
| A | 5070 | 11 | 0.216963% |
| B | 5070 | 67 | 1.321499% |
| C | 5070 | 261 | 5.147929% |
| D | 5070 | 235 | 4.635108% |
Noise dominated data is calculated using 1-second bins in cleaned event files. If a bin has >2000 counts, and if more than 50% of those come from <1% of pixels, then it is considered to be noise-dominated and hence unusable.
| Quadrant | # 1 sec bins | Bins with >0 counts | Bins with >2000 counts | High rate bins dominated by noise | Noise dominated (total time) | Noise dominated (detector-on time) | Marked lightcurve |
|---|---|---|---|---|---|---|---|
| A | 7103 | 5071 | 4 | 4 | 0.06% | 0.08% | 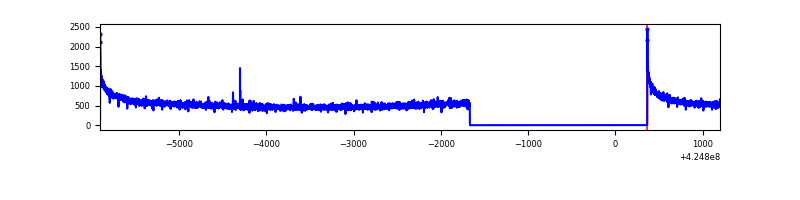 |
| B | 7102 | 5069 | 57 | 57 | 0.80% | 1.12% | 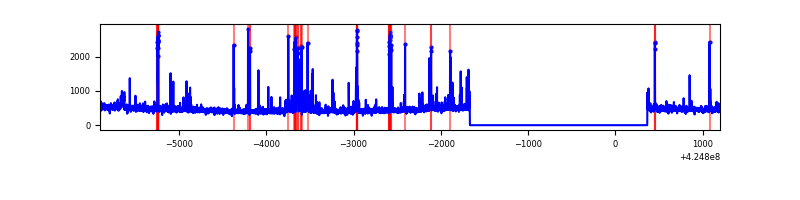 |
| C | 7103 | 5070 | 250 | 250 | 3.52% | 4.93% | 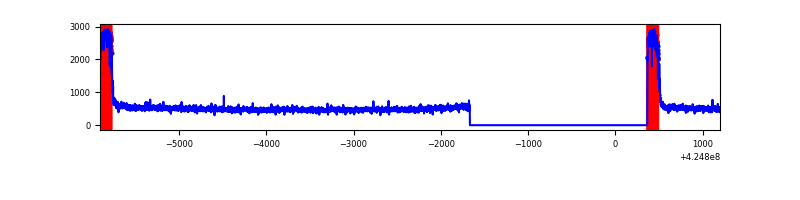 |
| D | 7102 | 5069 | 233 | 233 | 3.28% | 4.60% | 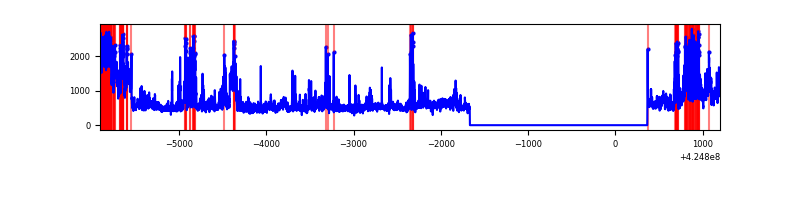 |
Top three noisy pixels from each quadrant. If the there are fewer than three noisy pixels in the level2.evt file, extra rows are filled as -1
| Pixel properties | Quadrant properties | ||||||
|---|---|---|---|---|---|---|---|
| Quadrant | DetID | PixID | Counts | Sigma | Mean | Median | Sigma |
| A | 10 | 83 | 523292 | 4495.82 | 569 | 559 | 116.3 |
| A | 13 | 254 | 9037 | 72.92 | 569 | 559 | 116.3 |
| A | 13 | 6 | 8684 | 69.88 | 569 | 559 | 116.3 |
| B | 5 | 255 | 291066 | 2679.48 | 557 | 542 | 108.4 |
| B | 0 | 183 | 23970 | 216.07 | 557 | 542 | 108.4 |
| B | 0 | 245 | 14170 | 125.69 | 557 | 542 | 108.4 |
| C | 0 | 10 | 792324 | 6304.96 | 531 | 536 | 125.6 |
| C | 15 | 214 | 215233 | 1709.62 | 531 | 536 | 125.6 |
| C | 14 | 67 | 4769 | 33.71 | 531 | 536 | 125.6 |
| D | 12 | 79 | 1107765 | 8113.15 | 549 | 534 | 136.5 |
| D | 2 | 249 | 358022 | 2619.47 | 549 | 534 | 136.5 |
| D | 2 | 120 | 119441 | 871.28 | 549 | 534 | 136.5 |
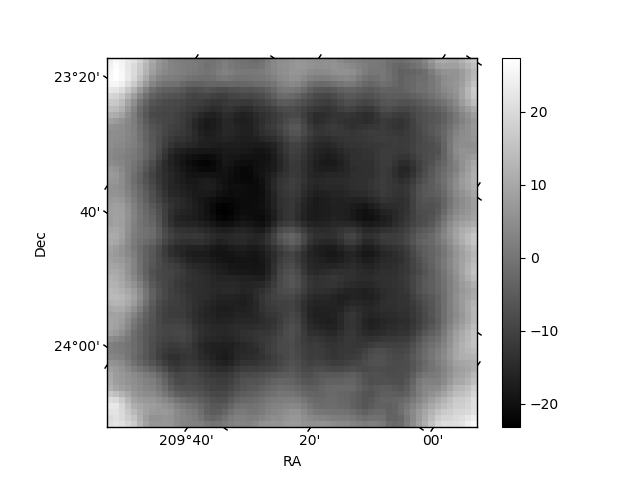
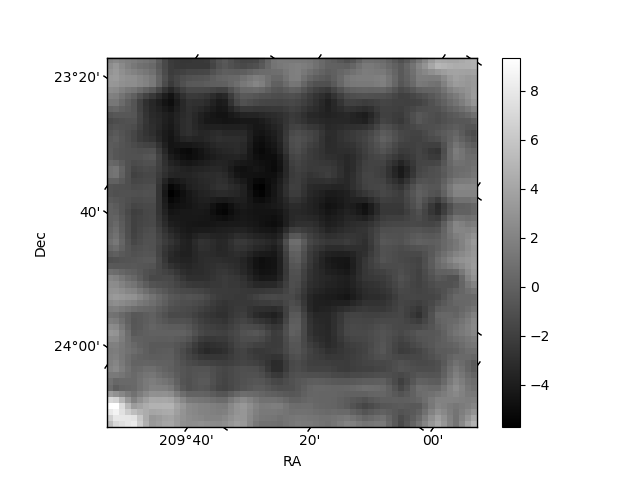
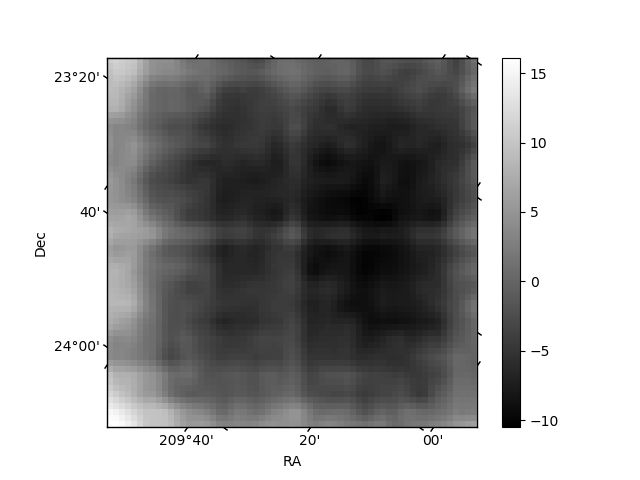
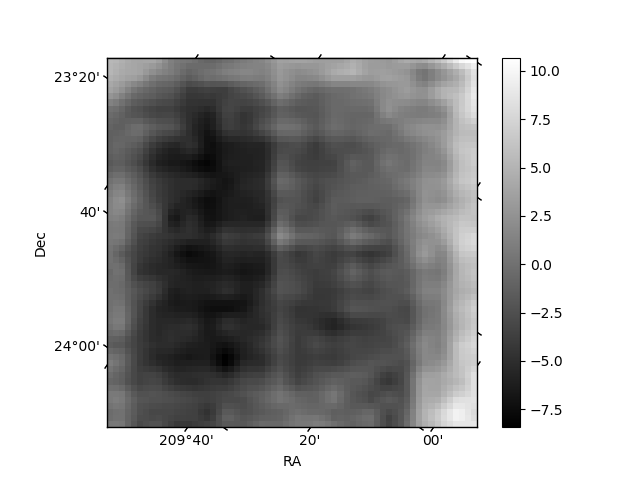
Histogram calculated using DETX and DETY for each event in the final _common_clean file
| Quadrant A | 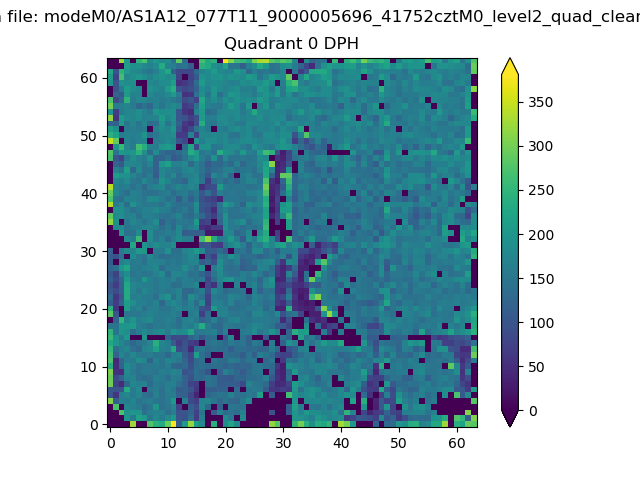 |
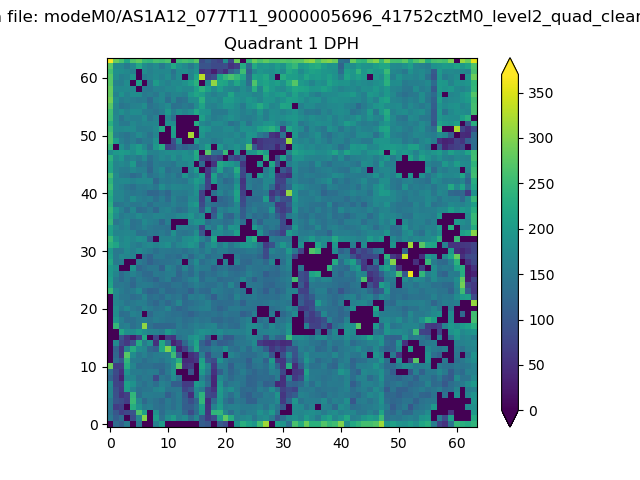 |
Quadrant B |
|---|---|---|---|
| Quadrant D | 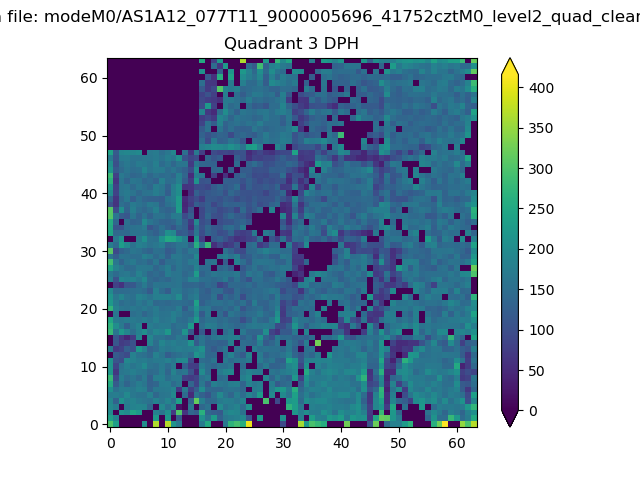 |
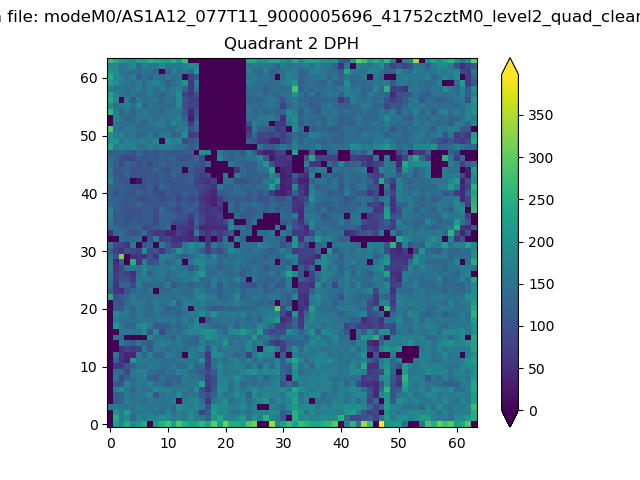 |
Quadrant C |
| Plot type | Count rate plots | Images |
|---|---|---|
| Comparison with Poisson distribution Blue bars denote a histogram of data divided into 1 sec bins. Red curve is a Poisson curve with rate = median count rate of data. |
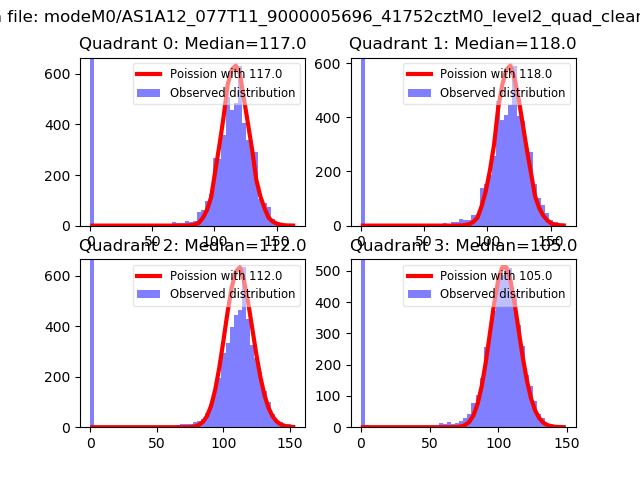 |
 |
| Quadrant-wise count rates Data is divided into 100 sec bins |
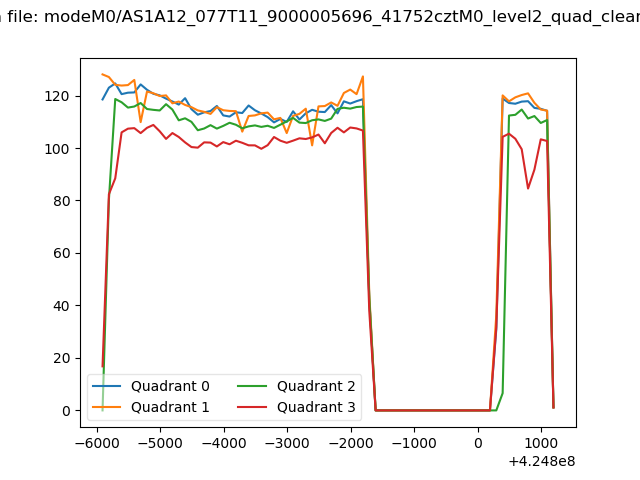 |
|
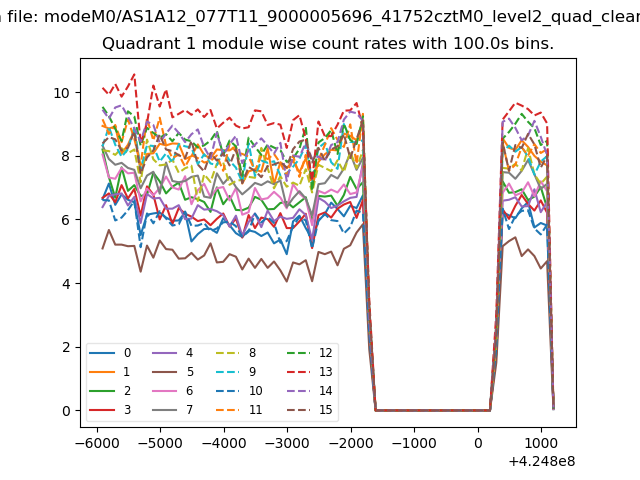
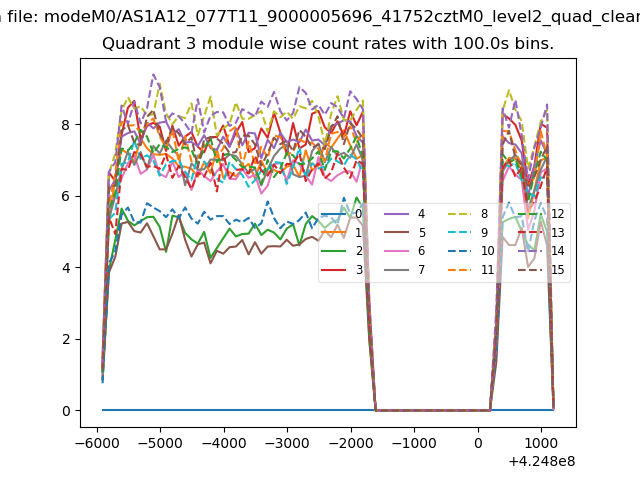
| Module-wise count rates for Quadrant A Data is divided into 100 sec bins |
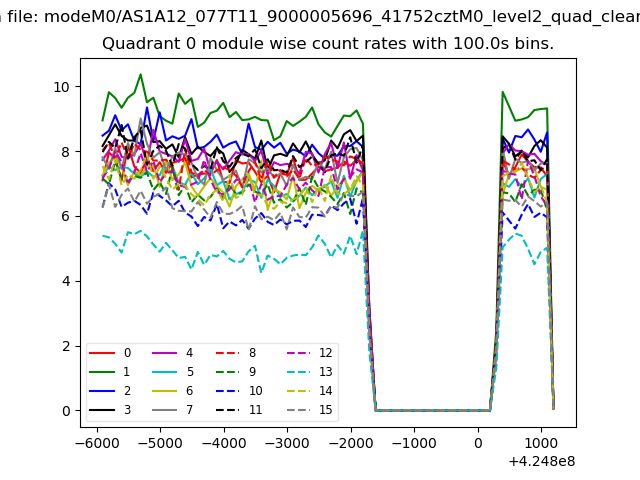 |
 |
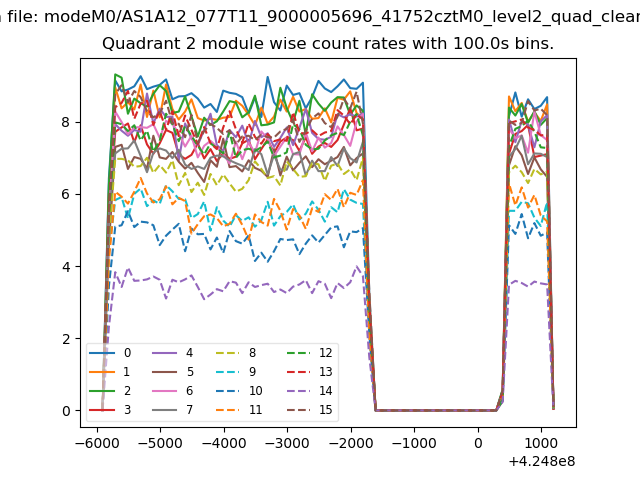
| Module-wise count rates for Quadrant B Data is divided into 100 sec bins |
 |
 |
| Module-wise count rates for Quadrant C Data is divided into 100 sec bins |
 |
 |
| Module-wise count rates for Quadrant D Data is divided into 100 sec bins |
 |
 |
| Parameter | Plot |
|---|---|
| CZT HV Monitor | 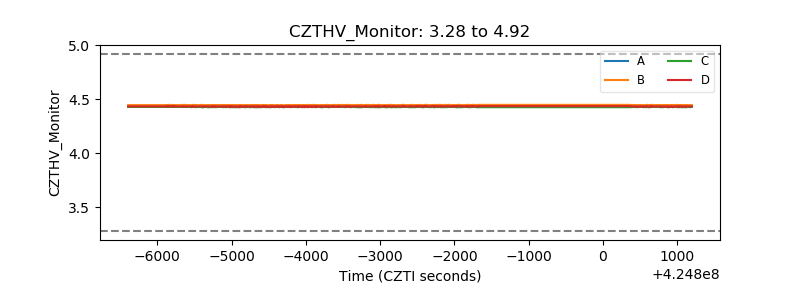 |
| D_VDD | 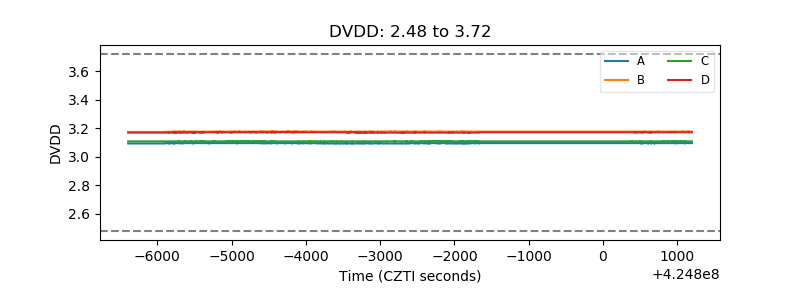 |
| Temperature 1 | 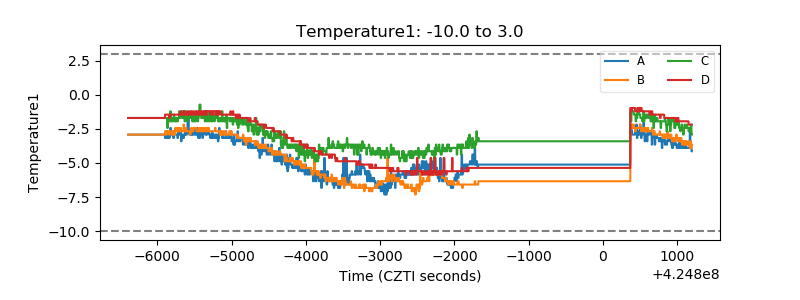 |
| Veto HV Monitor | 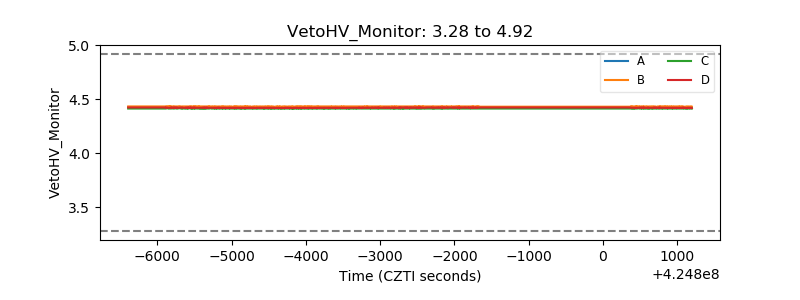 |
| Veto LLD | 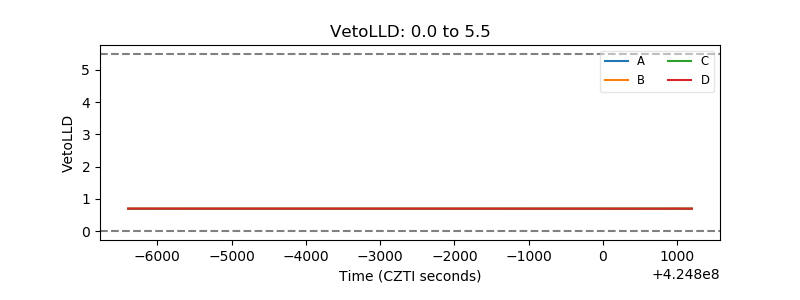 |
| Alpha Counter | 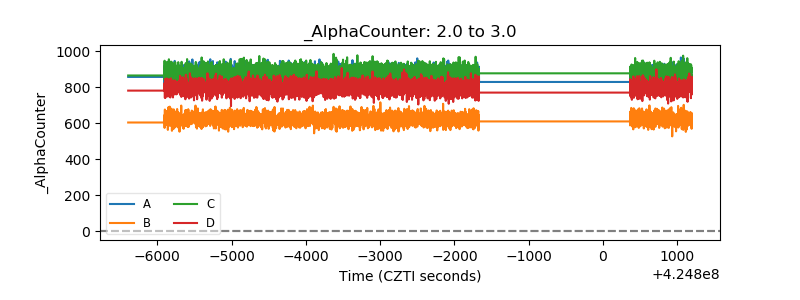 |
| _CPM_Rate | 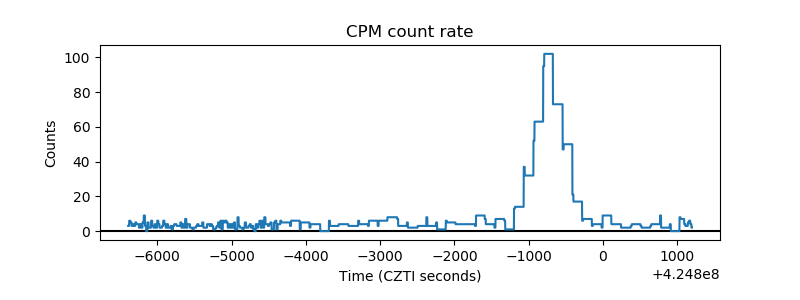 |
| CZT Counter | 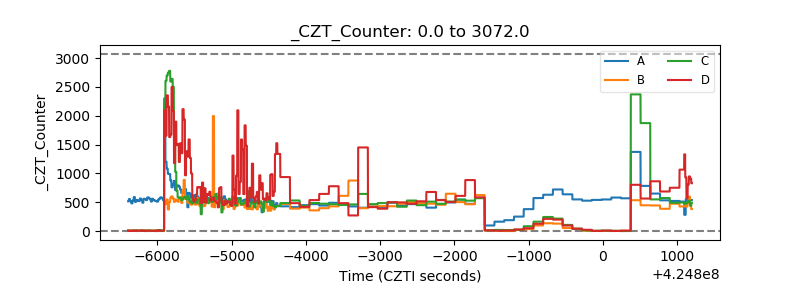 |
| +2.5 Volts monitor | 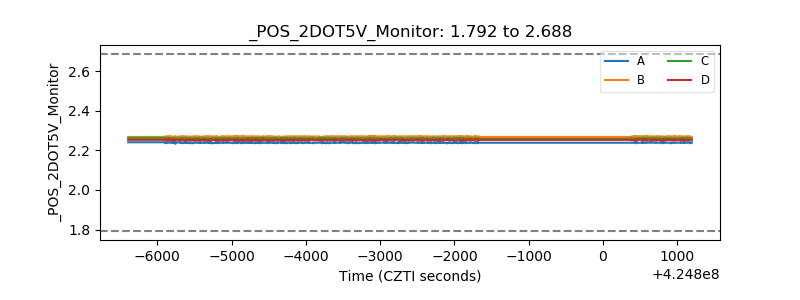 |
| +5 Volts monitor | 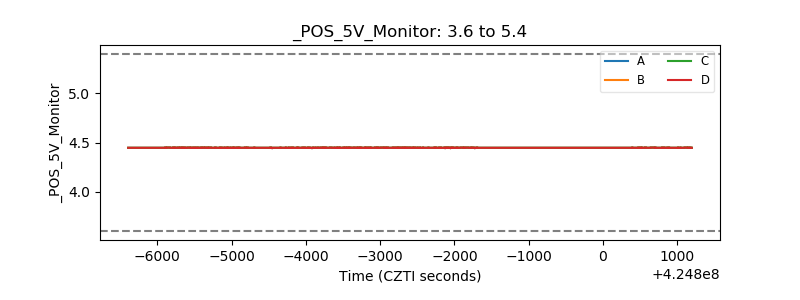 |
| _ROLL_ROT | 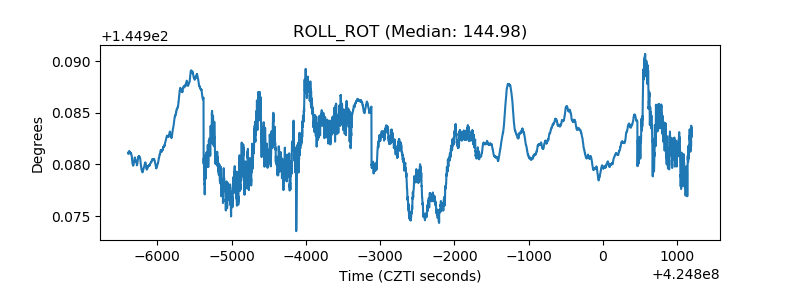 |
| _Roll_DEC | 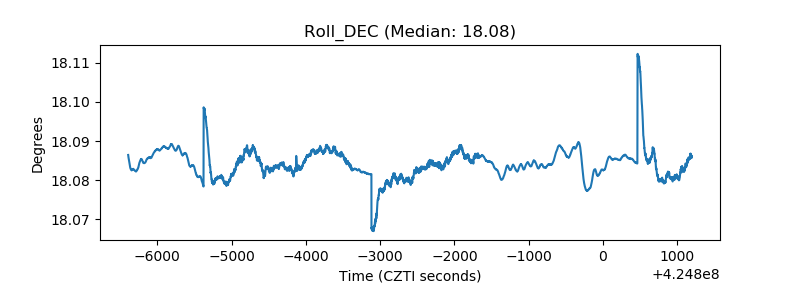 |
| _Roll_RA | 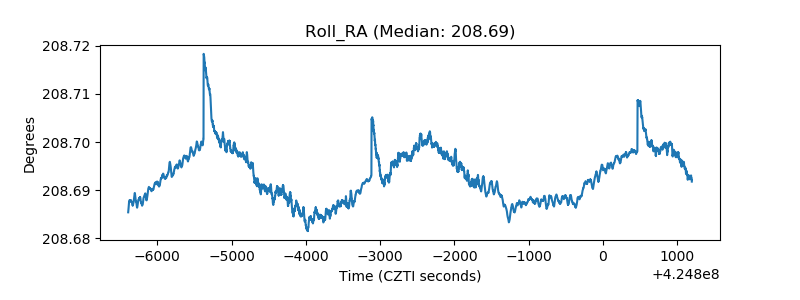 |
| Veto Counter | 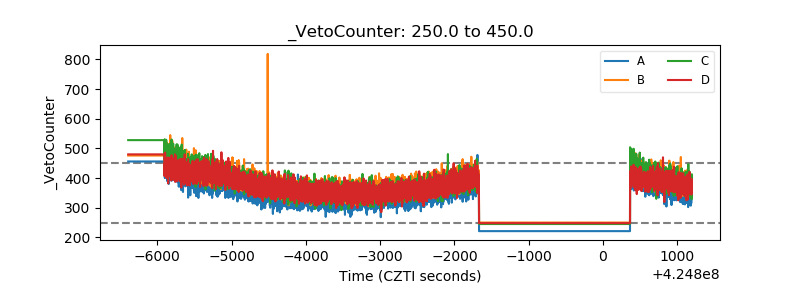 |