| Param | Original file | Final file |
|---|---|---|
| Filename | modeM0/AS1A12_077T11_9000005696_41753cztM0_level2.fits | modeM0/AS1A12_077T11_9000005696_41753cztM0_level2_quad_clean.evt |
| Size (bytes) | 397,733,760 | 85,345,920 |
| Size | 379.3 MB | 81.4 MB |
| Events in quadrant A | 2,778,279 | 580,750 |
| Events in quadrant B | 2,587,936 | 592,254 |
| Events in quadrant C | 3,160,579 | 537,315 |
| Events in quadrant D | 5,790,614 | 508,437 |
| Mode M9 | |||
|---|---|---|---|
| Quadrant | BADHDUFLAG | Total packets | Discarded packets |
| A | 0 | 20 | 0 |
| B | 0 | 21 | 0 |
| C | 0 | 21 | 0 |
| D | 0 | 21 | 0 |
| Mode M0 | |||
|---|---|---|---|
| Quadrant | BADHDUFLAG | Total packets | Discarded packets |
| A | 0 | 11541 | 137 |
| B | 0 | 11450 | 136 |
| C | 0 | 12747 | 188 |
| D | 0 | 21282 | 374 |
| Mode SS | |||
|---|---|---|---|
| Quadrant | BADHDUFLAG | Total packets | Discarded packets |
| A | 0 | 107 | 1 |
| B | 0 | 108 | 0 |
| C | 0 | 108 | 0 |
| D | 0 | 108 | 0 |
| Quadrant | Total seconds | Saturated seconds | Saturation percentage |
|---|---|---|---|
| A | 5221 | 13 | 0.248994% |
| B | 5225 | 32 | 0.612440% |
| C | 5217 | 260 | 4.983707% |
| D | 5190 | 258 | 4.971098% |
Noise dominated data is calculated using 1-second bins in cleaned event files. If a bin has >2000 counts, and if more than 50% of those come from <1% of pixels, then it is considered to be noise-dominated and hence unusable.
| Quadrant | # 1 sec bins | Bins with >0 counts | Bins with >2000 counts | High rate bins dominated by noise | Noise dominated (total time) | Noise dominated (detector-on time) | Marked lightcurve |
|---|---|---|---|---|---|---|---|
| A | 7100 | 5279 | 4 | 4 | 0.06% | 0.08% | 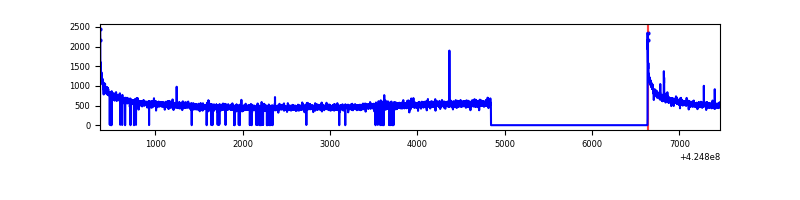 |
| B | 7098 | 5274 | 28 | 28 | 0.39% | 0.53% | 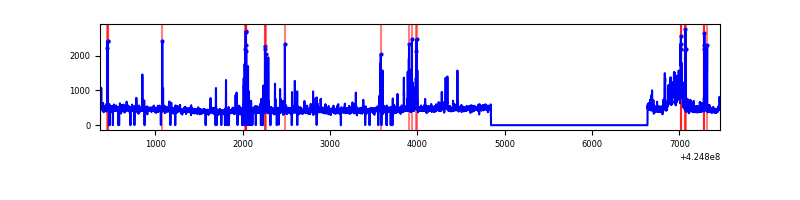 |
| C | 7098 | 5267 | 250 | 250 | 3.52% | 4.75% | 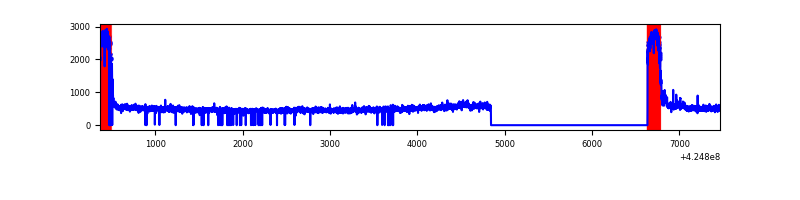 |
| D | 7098 | 5270 | 288 | 288 | 4.06% | 5.46% | 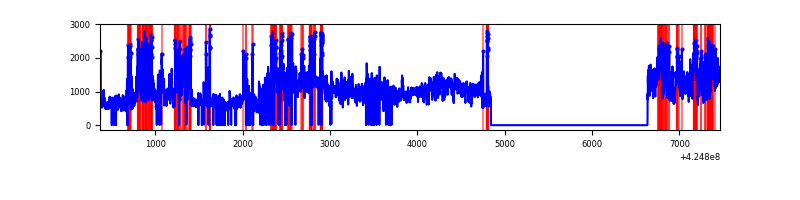 |
Top three noisy pixels from each quadrant. If the there are fewer than three noisy pixels in the level2.evt file, extra rows are filled as -1
| Pixel properties | Quadrant properties | ||||||
|---|---|---|---|---|---|---|---|
| Quadrant | DetID | PixID | Counts | Sigma | Mean | Median | Sigma |
| A | 10 | 83 | 534543 | 4485.31 | 573 | 562 | 119.1 |
| A | 13 | 6 | 11644 | 93.09 | 573 | 562 | 119.1 |
| A | 13 | 254 | 9419 | 74.4 | 573 | 562 | 119.1 |
| B | 5 | 255 | 110327 | 986.9 | 566 | 550 | 111.2 |
| B | 4 | 141 | 103751 | 927.78 | 566 | 550 | 111.2 |
| B | 0 | 186 | 63558 | 566.44 | 566 | 550 | 111.2 |
| C | 0 | 10 | 849781 | 6734.72 | 535 | 539 | 126.1 |
| C | 15 | 214 | 221084 | 1748.98 | 535 | 539 | 126.1 |
| C | 13 | 61 | 3606 | 24.32 | 535 | 539 | 126.1 |
| D | 12 | 79 | 3028373 | 22485.06 | 545 | 531 | 134.7 |
| D | 13 | 249 | 330862 | 2453.07 | 545 | 531 | 134.7 |
| D | 2 | 249 | 230161 | 1705.26 | 545 | 531 | 134.7 |
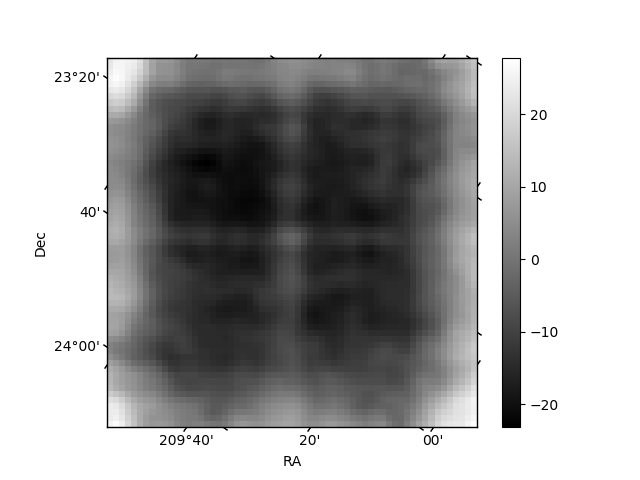
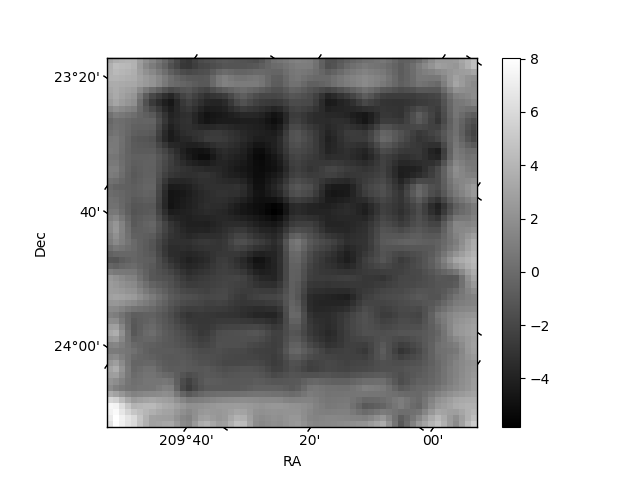
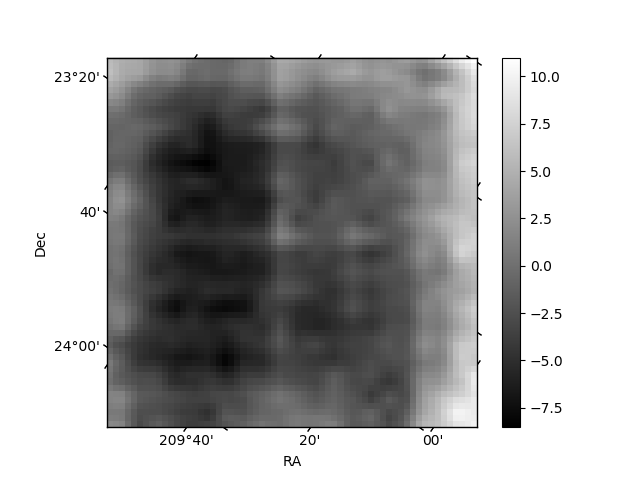
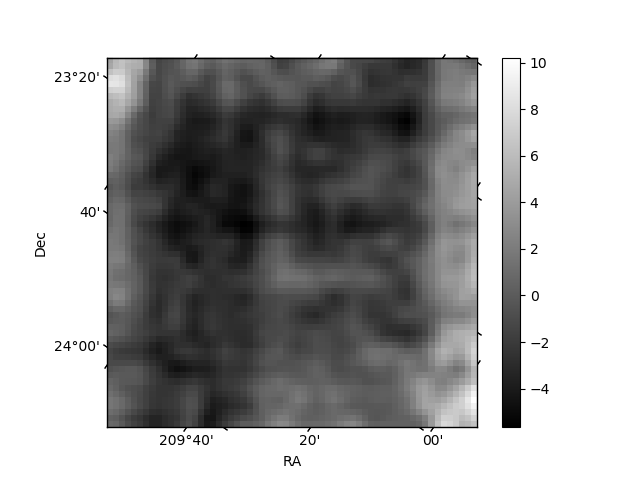
Histogram calculated using DETX and DETY for each event in the final _common_clean file
| Quadrant A | 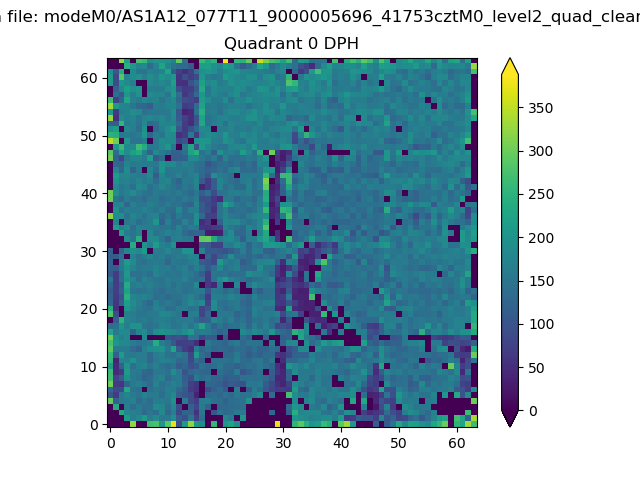 |
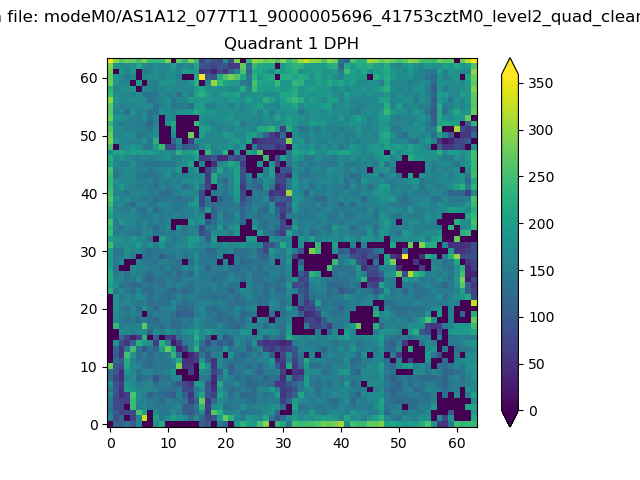 |
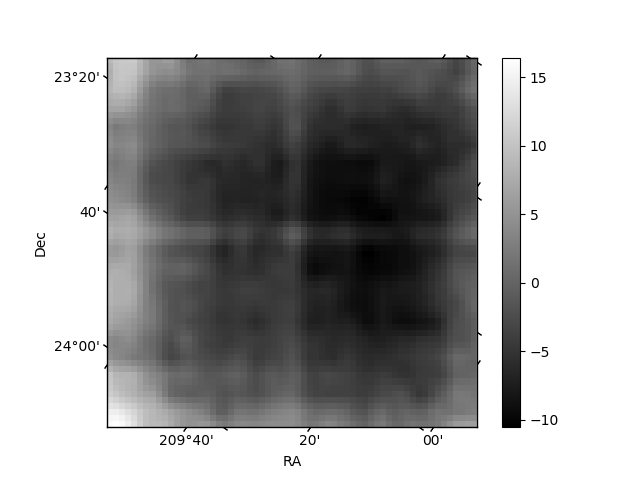
Quadrant B |
|---|---|---|---|
| Quadrant D | 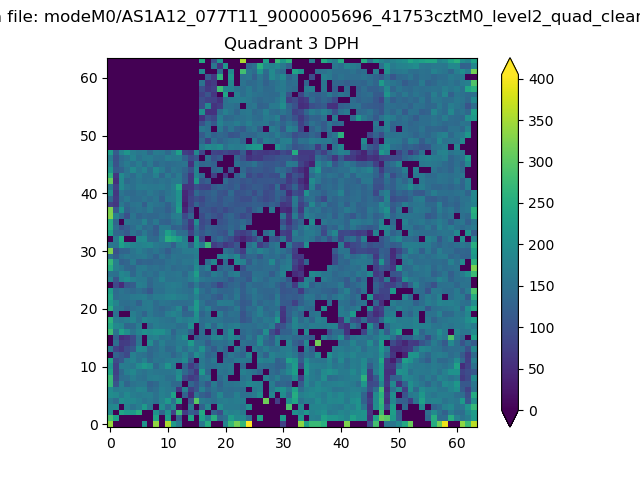 |
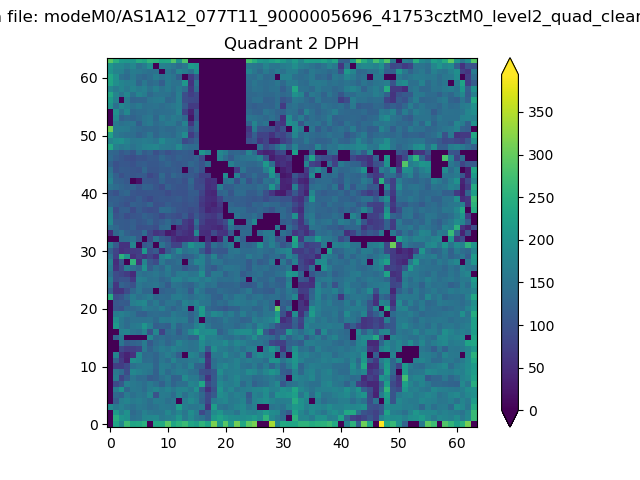 |
Quadrant C |
| Plot type | Count rate plots | Images |
|---|---|---|
| Comparison with Poisson distribution Blue bars denote a histogram of data divided into 1 sec bins. Red curve is a Poisson curve with rate = median count rate of data. |
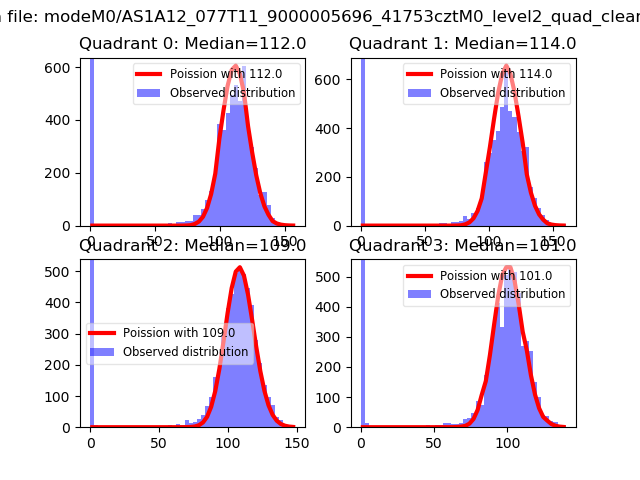 |
 |
| Quadrant-wise count rates Data is divided into 100 sec bins |
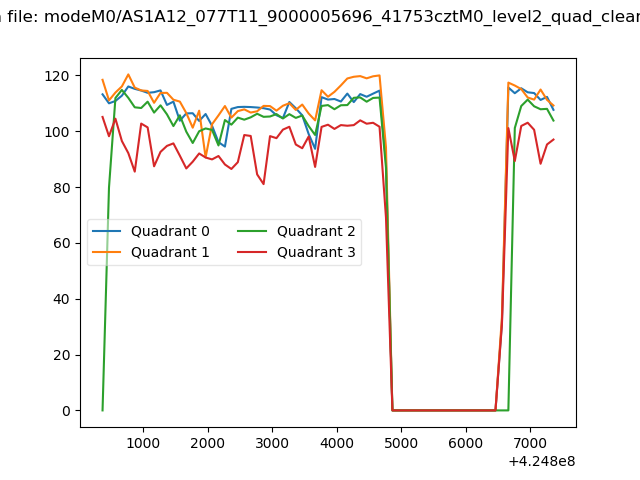 |
|
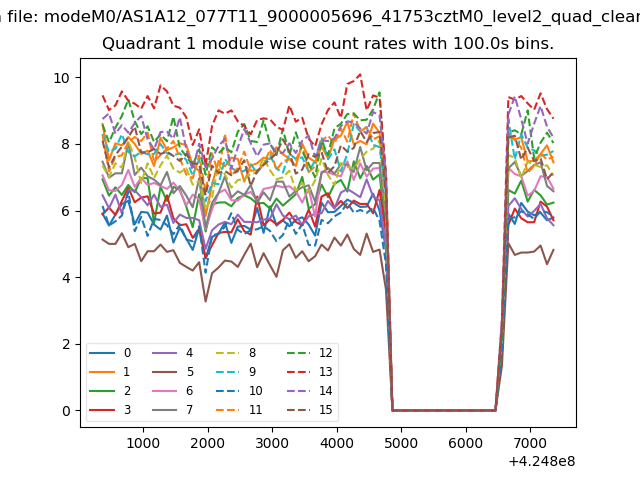
| Module-wise count rates for Quadrant A Data is divided into 100 sec bins |
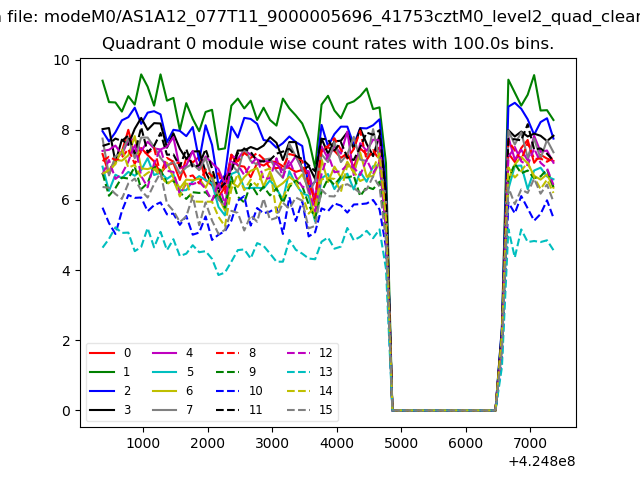 |
 |
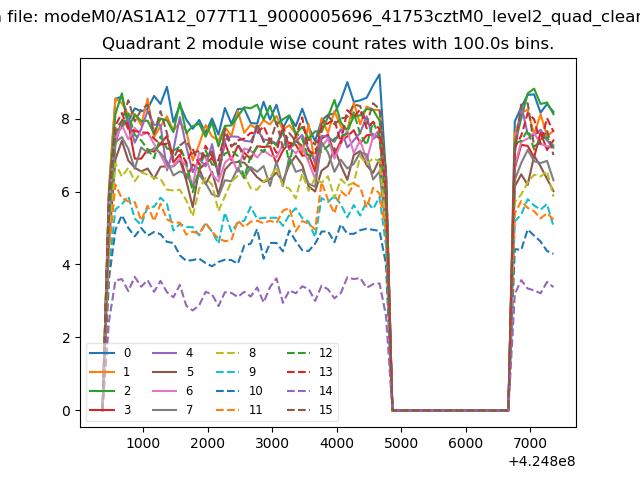
| Module-wise count rates for Quadrant B Data is divided into 100 sec bins |
 |
 |
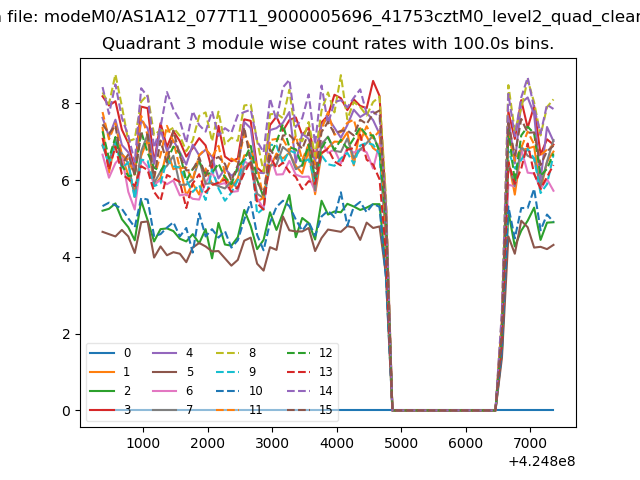
| Module-wise count rates for Quadrant C Data is divided into 100 sec bins |
 |
 |
| Module-wise count rates for Quadrant D Data is divided into 100 sec bins |
 |
 |
| Parameter | Plot |
|---|---|
| CZT HV Monitor | 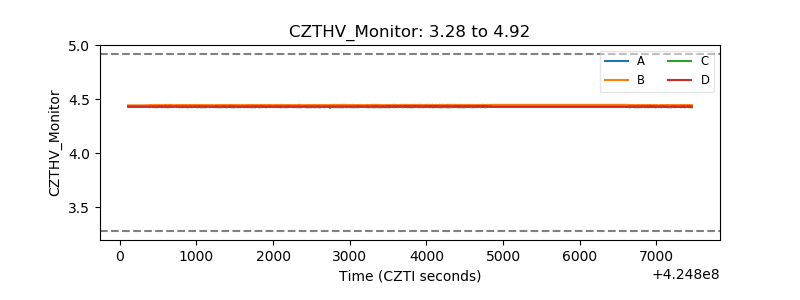 |
| D_VDD | 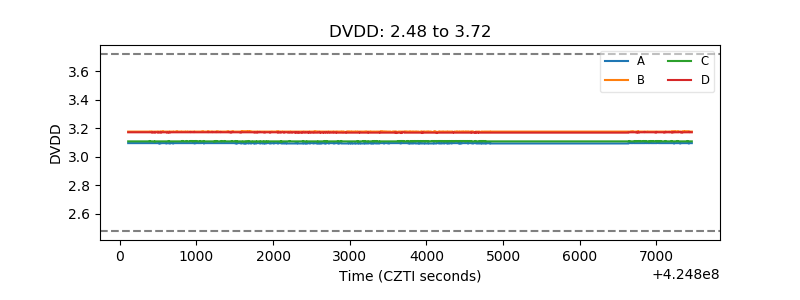 |
| Temperature 1 | 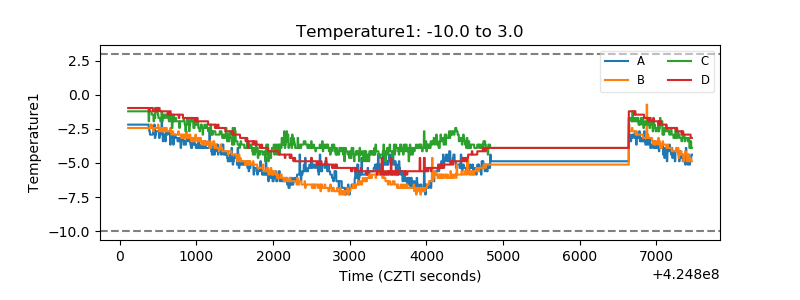 |
| Veto HV Monitor | 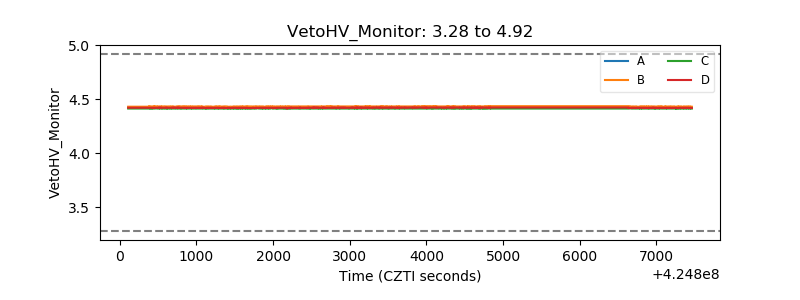 |
| Veto LLD | 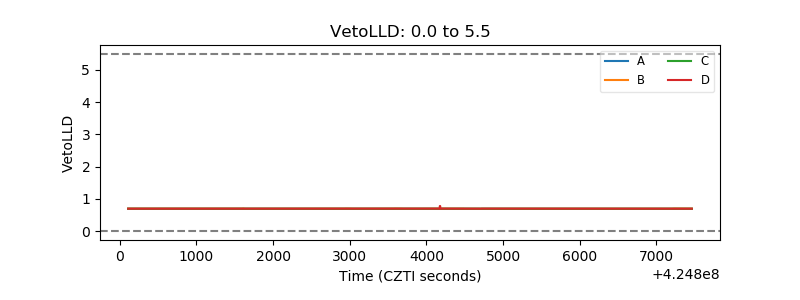 |
| Alpha Counter | 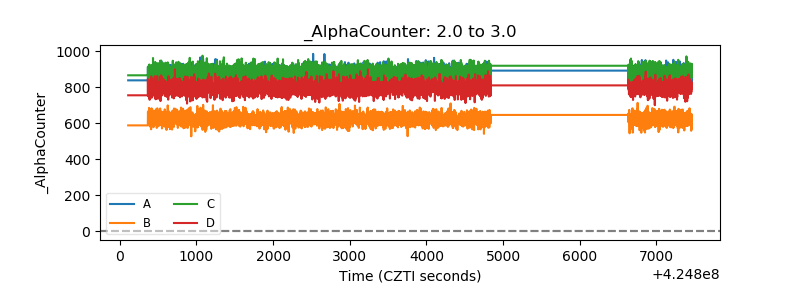 |
| _CPM_Rate | 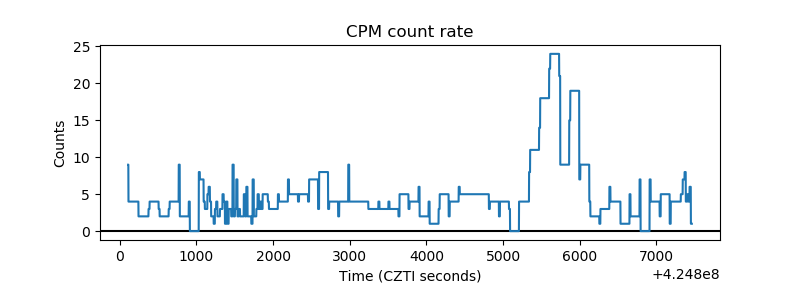 |
| CZT Counter | 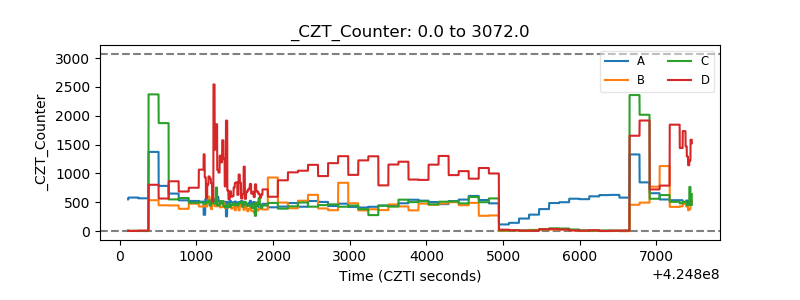 |
| +2.5 Volts monitor | 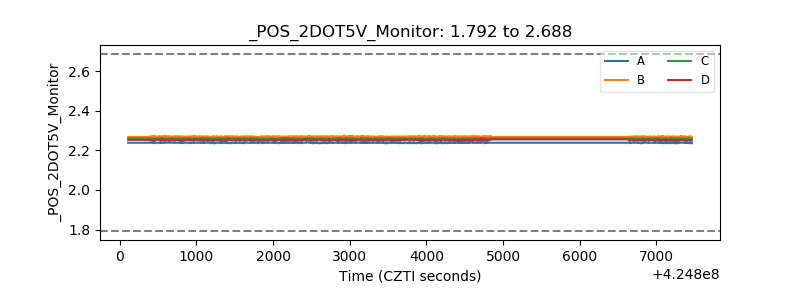 |
| +5 Volts monitor | 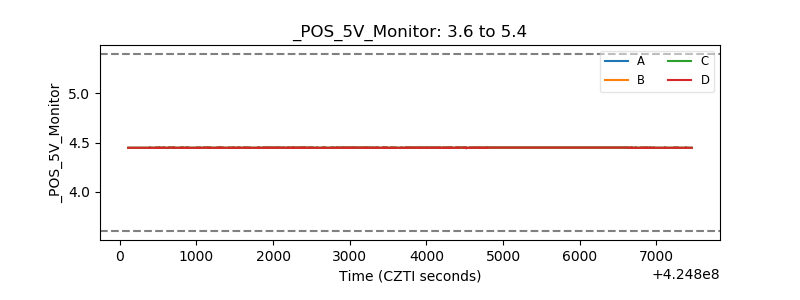 |
| _ROLL_ROT | 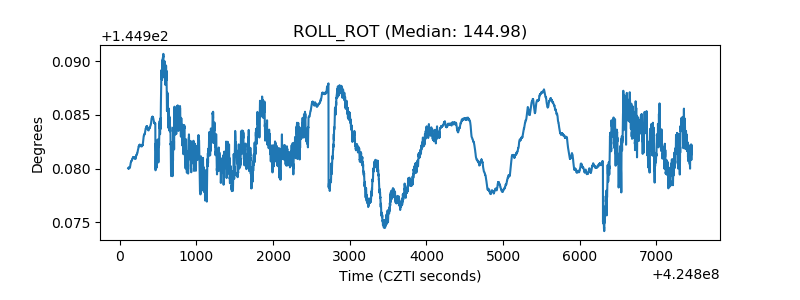 |
| _Roll_DEC | 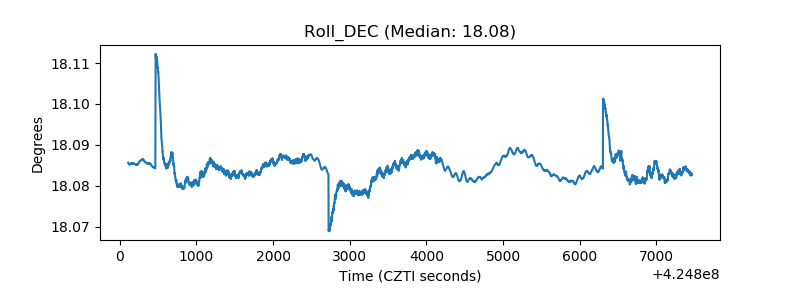 |
| _Roll_RA | 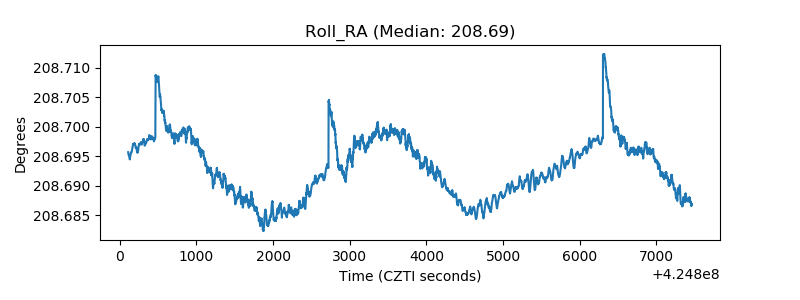 |
| Veto Counter | 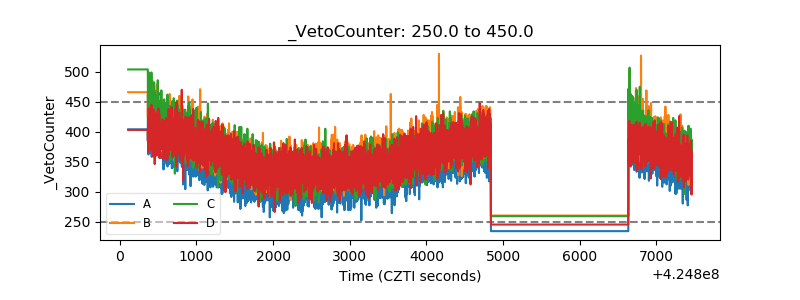 |