| Param | Original file | Final file |
|---|---|---|
| Filename | modeM0/AS1A12_077T11_9000005696_41754cztM0_level2.fits | modeM0/AS1A12_077T11_9000005696_41754cztM0_level2_quad_clean.evt |
| Size (bytes) | 463,749,120 | 90,155,520 |
| Size | 442.3 MB | 86.0 MB |
| Events in quadrant A | 3,190,998 | 614,099 |
| Events in quadrant B | 3,100,908 | 618,816 |
| Events in quadrant C | 3,335,799 | 569,502 |
| Events in quadrant D | 7,105,434 | 536,327 |
| Mode M9 | |||
|---|---|---|---|
| Quadrant | BADHDUFLAG | Total packets | Discarded packets |
| A | 0 | 27 | 0 |
| B | 0 | 28 | 0 |
| C | 0 | 28 | 0 |
| D | 0 | 28 | 0 |
| Mode M0 | |||
|---|---|---|---|
| Quadrant | BADHDUFLAG | Total packets | Discarded packets |
| A | 0 | 12952 | 2 |
| B | 0 | 13180 | 2 |
| C | 0 | 13283 | 2 |
| D | 0 | 25010 | 3 |
| Mode SS | |||
|---|---|---|---|
| Quadrant | BADHDUFLAG | Total packets | Discarded packets |
| A | 0 | 114 | 0 |
| B | 0 | 114 | 0 |
| C | 0 | 114 | 0 |
| D | 0 | 114 | 0 |
| Quadrant | Total seconds | Saturated seconds | Saturation percentage |
|---|---|---|---|
| A | 5588 | 57 | 1.020043% |
| B | 5588 | 116 | 2.075877% |
| C | 5588 | 252 | 4.509664% |
| D | 5587 | 326 | 5.834974% |
Noise dominated data is calculated using 1-second bins in cleaned event files. If a bin has >2000 counts, and if more than 50% of those come from <1% of pixels, then it is considered to be noise-dominated and hence unusable.
| Quadrant | # 1 sec bins | Bins with >0 counts | Bins with >2000 counts | High rate bins dominated by noise | Noise dominated (total time) | Noise dominated (detector-on time) | Marked lightcurve |
|---|---|---|---|---|---|---|---|
| A | 7050 | 5589 | 47 | 47 | 0.67% | 0.84% | 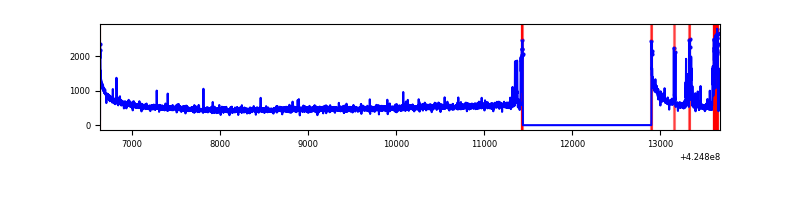 |
| B | 7049 | 5588 | 43 | 43 | 0.61% | 0.77% | 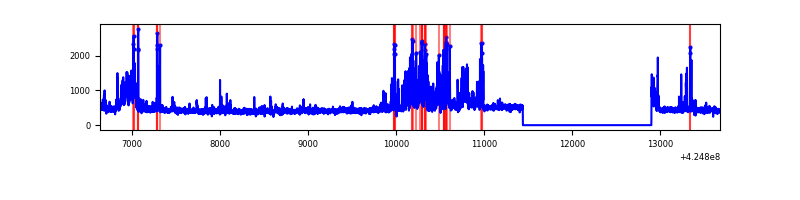 |
| C | 7049 | 5587 | 246 | 246 | 3.49% | 4.40% | 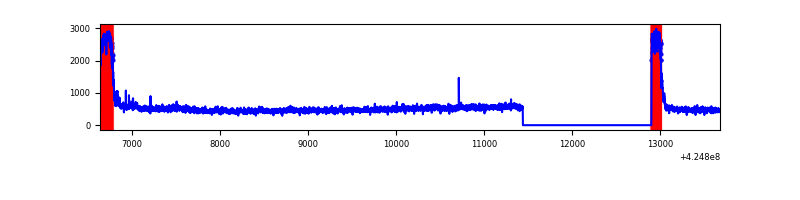 |
| D | 7048 | 5586 | 594 | 594 | 8.43% | 10.63% | 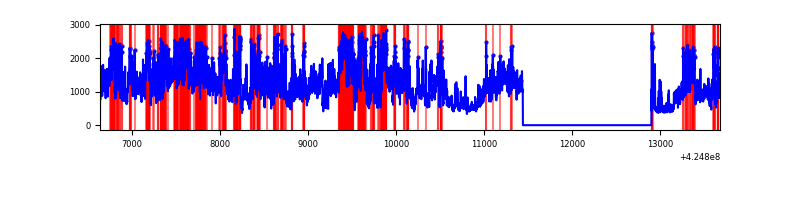 |
Top three noisy pixels from each quadrant. If the there are fewer than three noisy pixels in the level2.evt file, extra rows are filled as -1
| Pixel properties | Quadrant properties | ||||||
|---|---|---|---|---|---|---|---|
| Quadrant | DetID | PixID | Counts | Sigma | Mean | Median | Sigma |
| A | 10 | 83 | 556460 | 4380.78 | 614 | 603 | 126.9 |
| A | 13 | 248 | 239474 | 1882.57 | 614 | 603 | 126.9 |
| A | 13 | 6 | 10658 | 79.24 | 614 | 603 | 126.9 |
| B | 5 | 255 | 449979 | 3805.74 | 605 | 589 | 118.1 |
| B | 0 | 186 | 95483 | 803.63 | 605 | 589 | 118.1 |
| B | 4 | 141 | 93758 | 789.02 | 605 | 589 | 118.1 |
| C | 0 | 10 | 853819 | 6284.43 | 575 | 578 | 135.8 |
| C | 15 | 214 | 234723 | 1724.56 | 575 | 578 | 135.8 |
| C | 13 | 61 | 3781 | 23.59 | 575 | 578 | 135.8 |
| D | 12 | 79 | 4427046 | 30445.56 | 586 | 570 | 145.4 |
| D | 12 | 6 | 165100 | 1131.65 | 586 | 570 | 145.4 |
| D | 2 | 249 | 114809 | 785.74 | 586 | 570 | 145.4 |
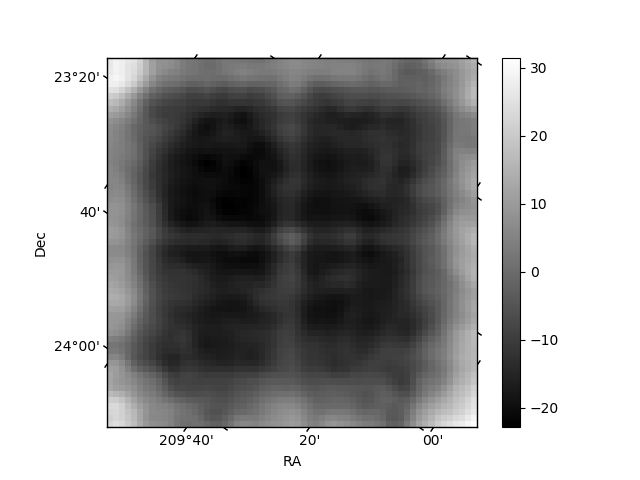
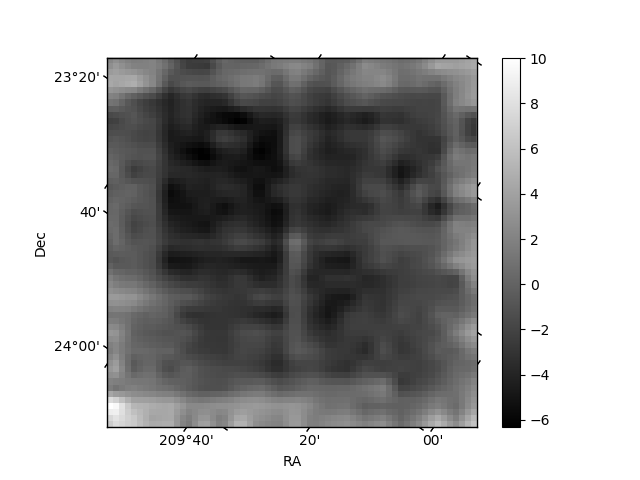
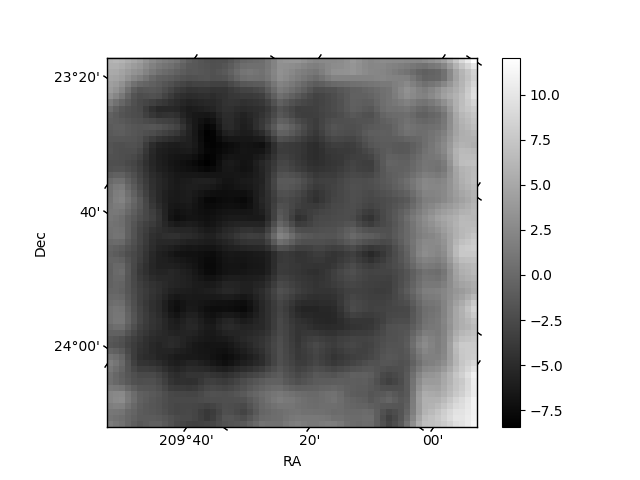
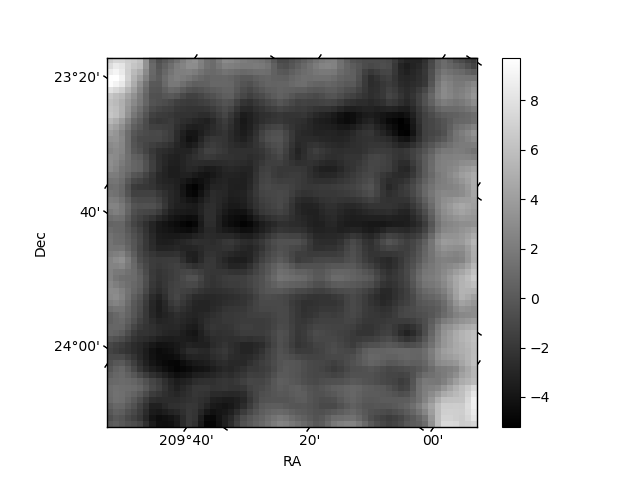
Histogram calculated using DETX and DETY for each event in the final _common_clean file
| Quadrant A | 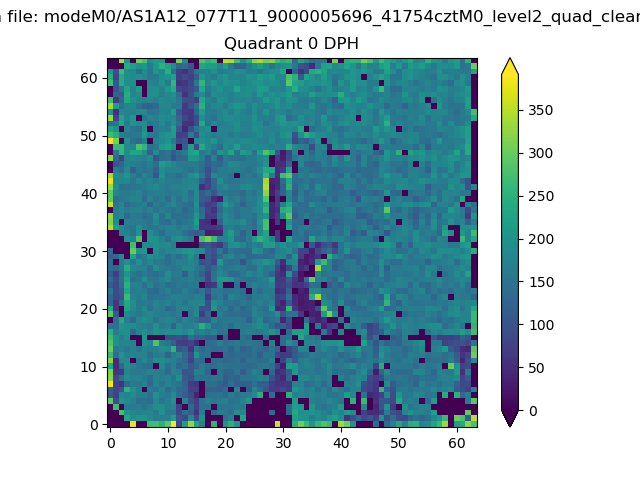 |
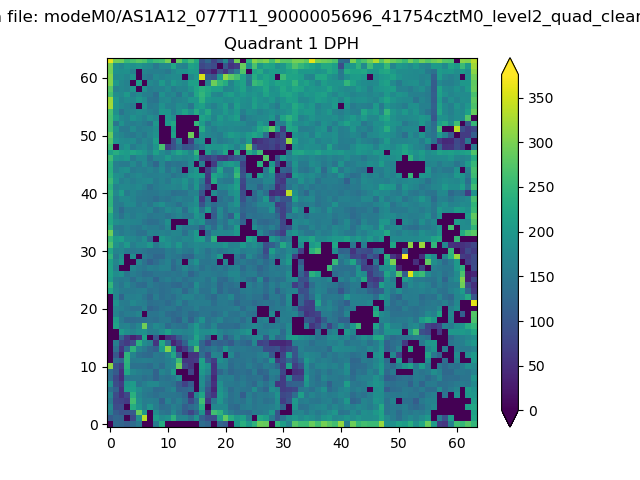 |
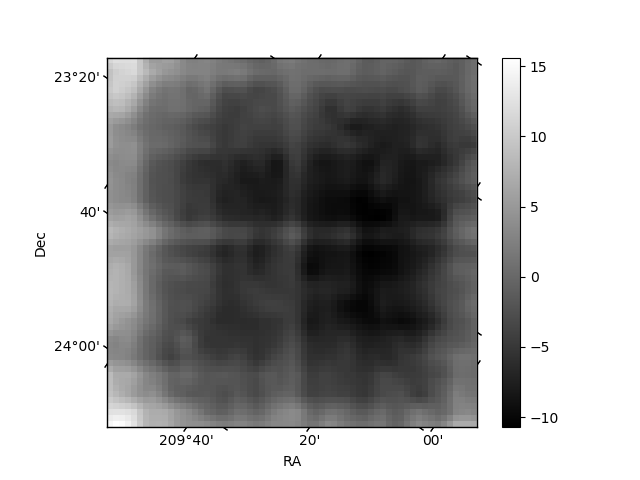
Quadrant B |
|---|---|---|---|
| Quadrant D | 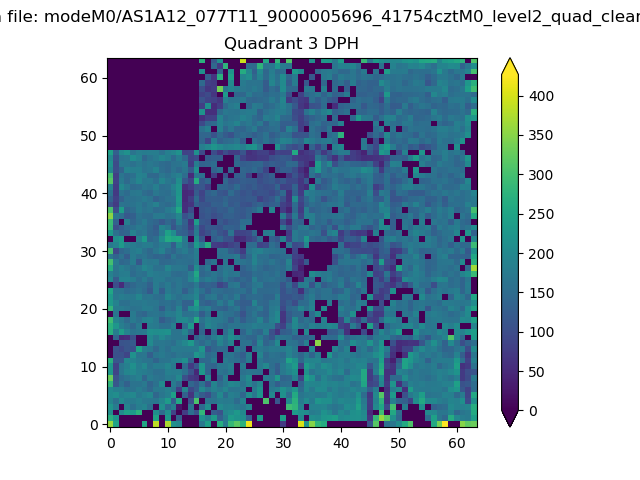 |
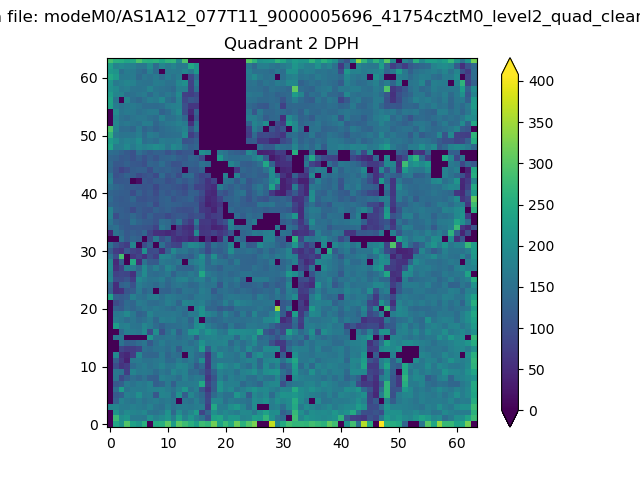 |
Quadrant C |
| Plot type | Count rate plots | Images |
|---|---|---|
| Comparison with Poisson distribution Blue bars denote a histogram of data divided into 1 sec bins. Red curve is a Poisson curve with rate = median count rate of data. |
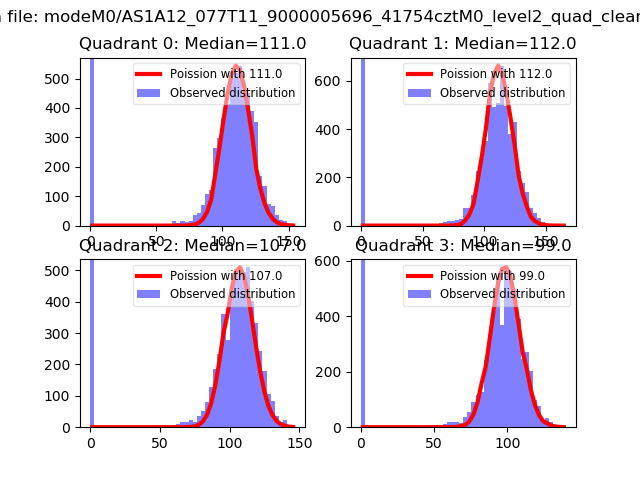 |
 |
| Quadrant-wise count rates Data is divided into 100 sec bins |
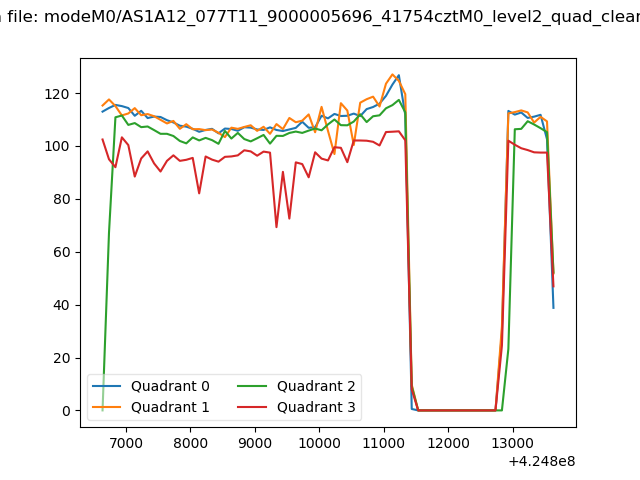 |
|
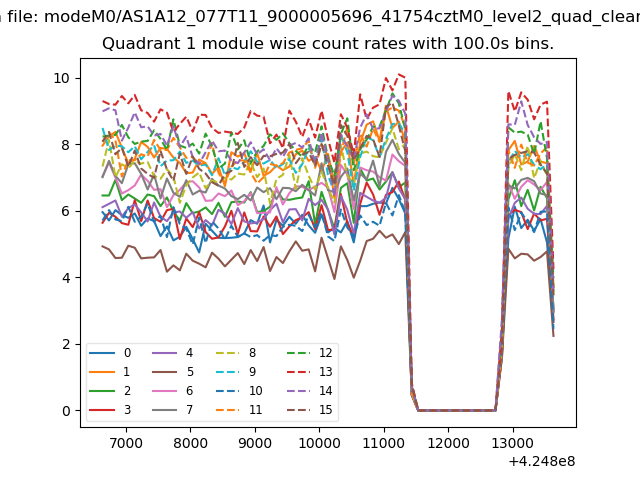
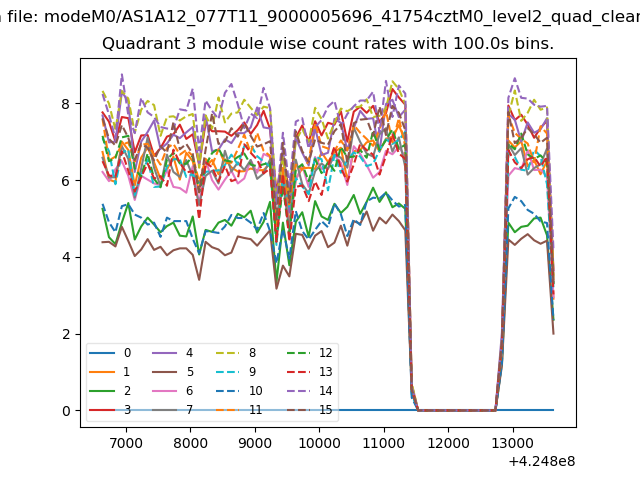
| Module-wise count rates for Quadrant A Data is divided into 100 sec bins |
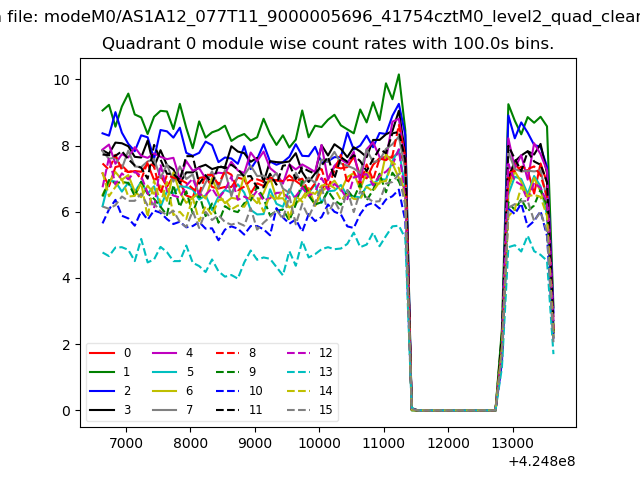 |
 |
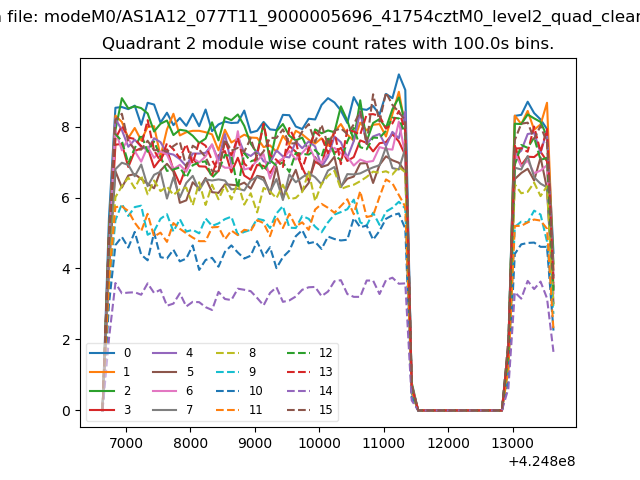
| Module-wise count rates for Quadrant B Data is divided into 100 sec bins |
 |
 |
| Module-wise count rates for Quadrant C Data is divided into 100 sec bins |
 |
 |
| Module-wise count rates for Quadrant D Data is divided into 100 sec bins |
 |
 |
| Parameter | Plot |
|---|---|
| CZT HV Monitor | 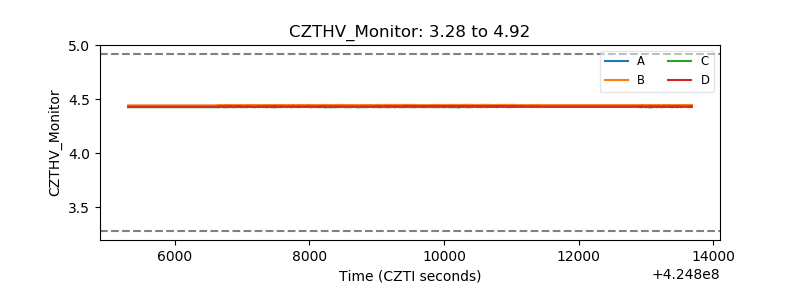 |
| D_VDD | 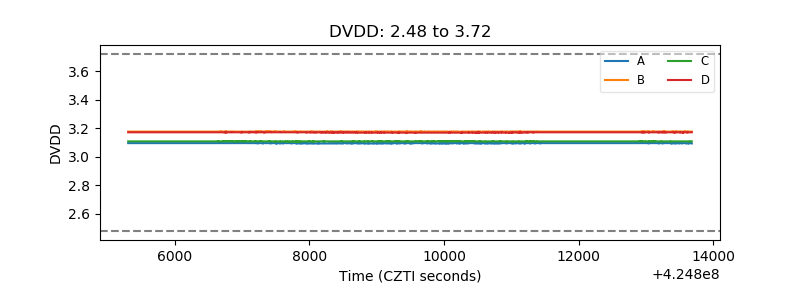 |
| Temperature 1 | 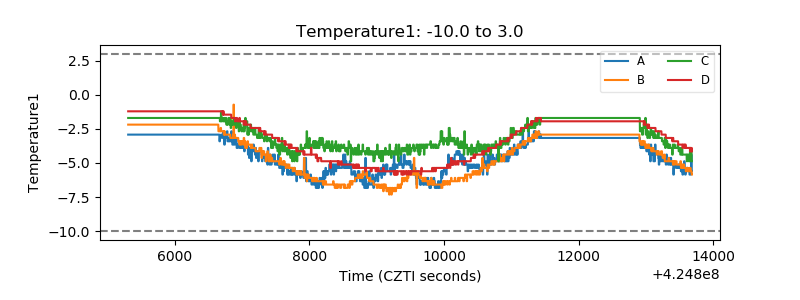 |
| Veto HV Monitor |  |
| Veto LLD | 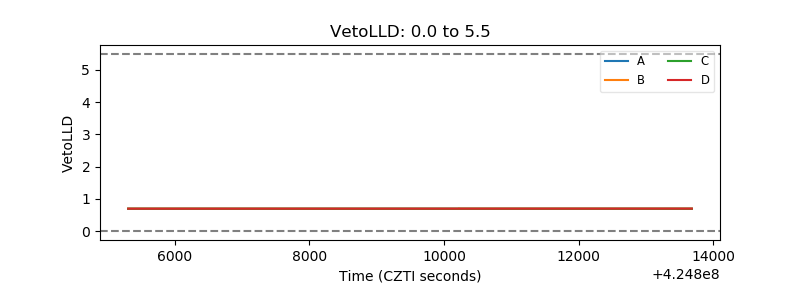 |
| Alpha Counter | 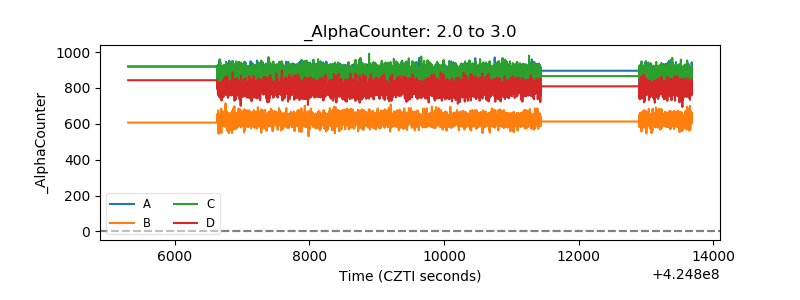 |
| _CPM_Rate | 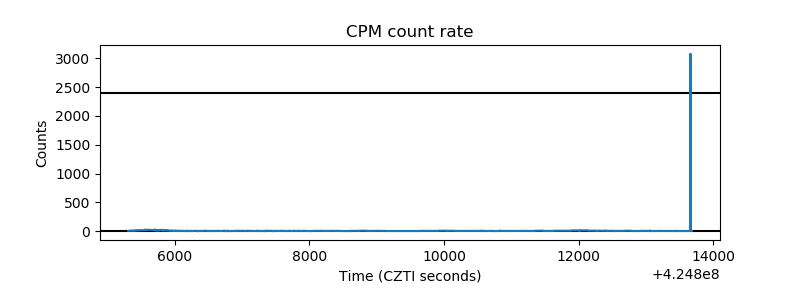 |
| CZT Counter | 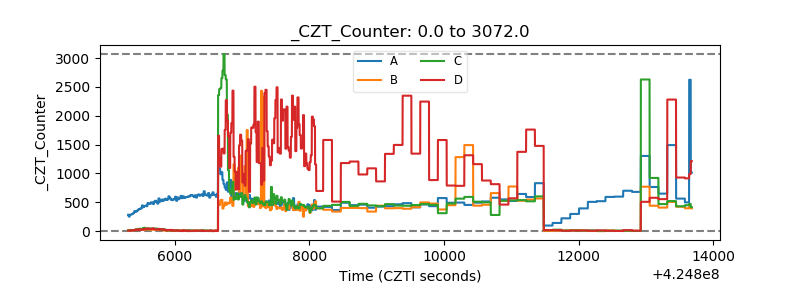 |
| +2.5 Volts monitor | 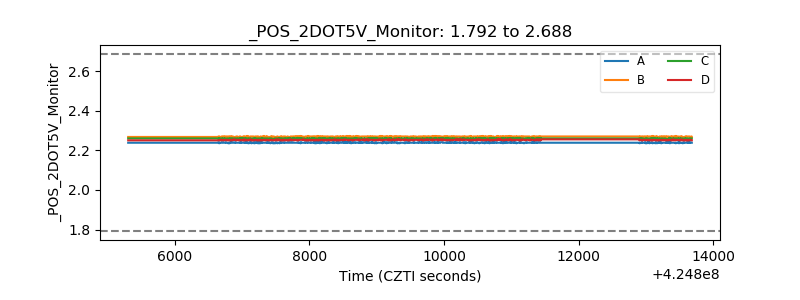 |
| +5 Volts monitor | 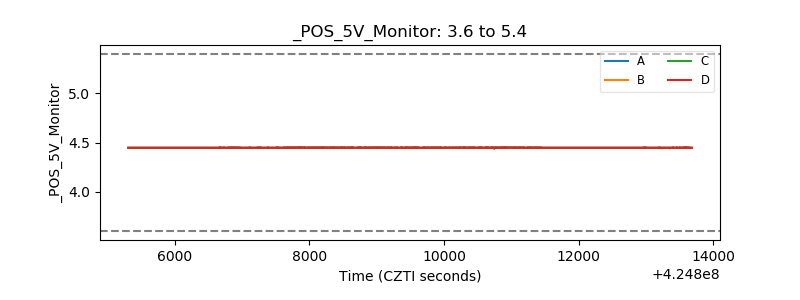 |
| _ROLL_ROT | 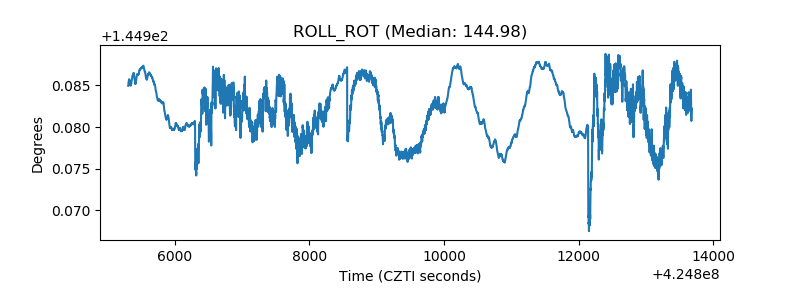 |
| _Roll_DEC | 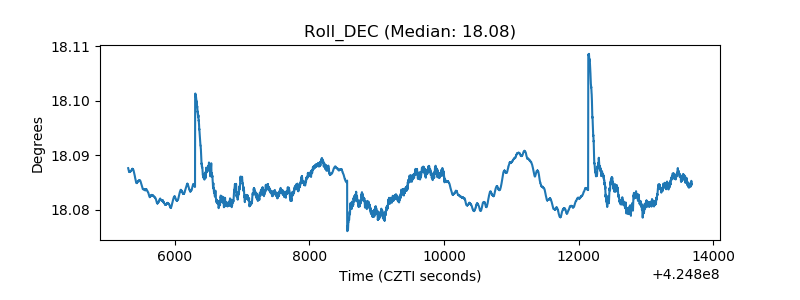 |
| _Roll_RA | 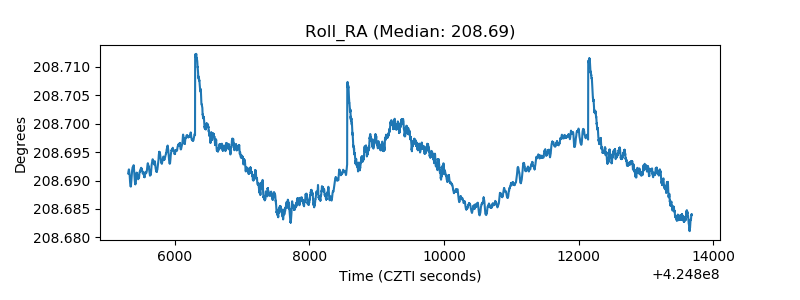 |
| Veto Counter | 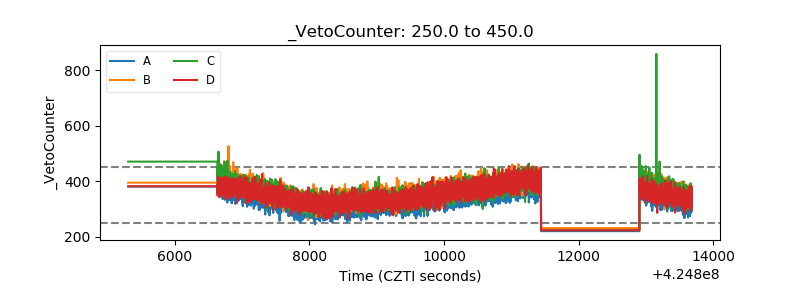 |