| Param | Original file | Final file |
|---|---|---|
| Filename | modeM0/AS1A12_077T11_9000005696_41755cztM0_level2.fits | modeM0/AS1A12_077T11_9000005696_41755cztM0_level2_quad_clean.evt |
| Size (bytes) | 510,770,880 | 97,185,600 |
| Size | 487.1 MB | 92.7 MB |
| Events in quadrant A | 3,502,531 | 666,209 |
| Events in quadrant B | 3,428,039 | 671,529 |
| Events in quadrant C | 3,528,958 | 628,702 |
| Events in quadrant D | 7,970,344 | 546,358 |
| Mode M9 | |||
|---|---|---|---|
| Quadrant | BADHDUFLAG | Total packets | Discarded packets |
| A | 0 | 27 | 0 |
| B | 0 | 27 | 0 |
| C | 0 | 27 | 0 |
| D | 0 | 27 | 0 |
| Mode M0 | |||
|---|---|---|---|
| Quadrant | BADHDUFLAG | Total packets | Discarded packets |
| A | 0 | 14235 | 2 |
| B | 0 | 14531 | 2 |
| C | 0 | 14393 | 2 |
| D | 0 | 27954 | 2 |
| Mode SS | |||
|---|---|---|---|
| Quadrant | BADHDUFLAG | Total packets | Discarded packets |
| A | 0 | 128 | 0 |
| B | 0 | 128 | 0 |
| C | 0 | 128 | 0 |
| D | 0 | 128 | 0 |
| Quadrant | Total seconds | Saturated seconds | Saturation percentage |
|---|---|---|---|
| A | 6152 | 62 | 1.007802% |
| B | 6152 | 187 | 3.039662% |
| C | 6153 | 239 | 3.884284% |
| D | 6153 | 841 | 13.668129% |
Noise dominated data is calculated using 1-second bins in cleaned event files. If a bin has >2000 counts, and if more than 50% of those come from <1% of pixels, then it is considered to be noise-dominated and hence unusable.
| Quadrant | # 1 sec bins | Bins with >0 counts | Bins with >2000 counts | High rate bins dominated by noise | Noise dominated (total time) | Noise dominated (detector-on time) | Marked lightcurve |
|---|---|---|---|---|---|---|---|
| A | 8926 | 6154 | 53 | 53 | 0.59% | 0.86% | 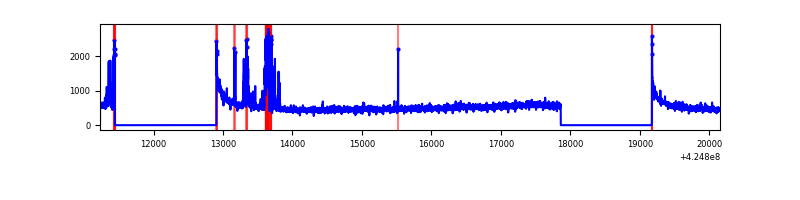 |
| B | 8926 | 6153 | 94 | 94 | 1.05% | 1.53% | 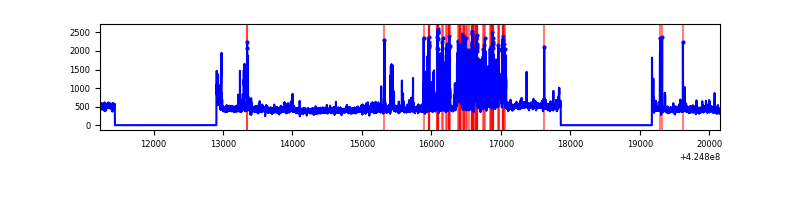 |
| C | 8927 | 6153 | 232 | 232 | 2.60% | 3.77% | 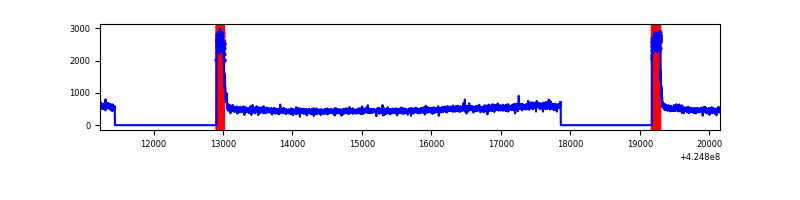 |
| D | 8927 | 6153 | 951 | 951 | 10.65% | 15.46% | 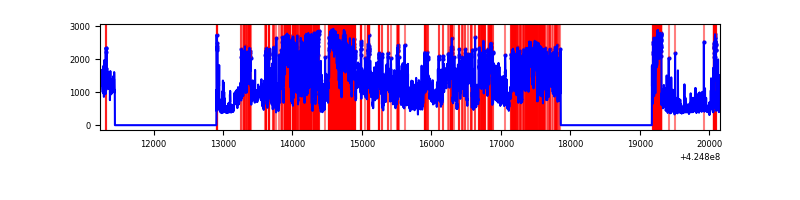 |
Top three noisy pixels from each quadrant. If the there are fewer than three noisy pixels in the level2.evt file, extra rows are filled as -1
| Pixel properties | Quadrant properties | ||||||
|---|---|---|---|---|---|---|---|
| Quadrant | DetID | PixID | Counts | Sigma | Mean | Median | Sigma |
| A | 10 | 83 | 576381 | 4091.22 | 677 | 664 | 140.7 |
| A | 13 | 248 | 284148 | 2014.53 | 677 | 664 | 140.7 |
| A | 13 | 6 | 12069 | 81.05 | 677 | 664 | 140.7 |
| B | 5 | 255 | 620800 | 4727.53 | 666 | 647 | 131.2 |
| B | 0 | 245 | 55264 | 416.35 | 666 | 647 | 131.2 |
| B | 0 | 186 | 40957 | 307.29 | 666 | 647 | 131.2 |
| C | 0 | 10 | 760901 | 5038.14 | 642 | 645 | 150.9 |
| C | 15 | 214 | 260008 | 1718.77 | 642 | 645 | 150.9 |
| C | 14 | 67 | 5333 | 31.06 | 642 | 645 | 150.9 |
| D | 12 | 79 | 4413291 | 27604.46 | 635 | 617 | 159.9 |
| D | 2 | 249 | 835111 | 5220.36 | 635 | 617 | 159.9 |
| D | 13 | 249 | 114666 | 713.46 | 635 | 617 | 159.9 |
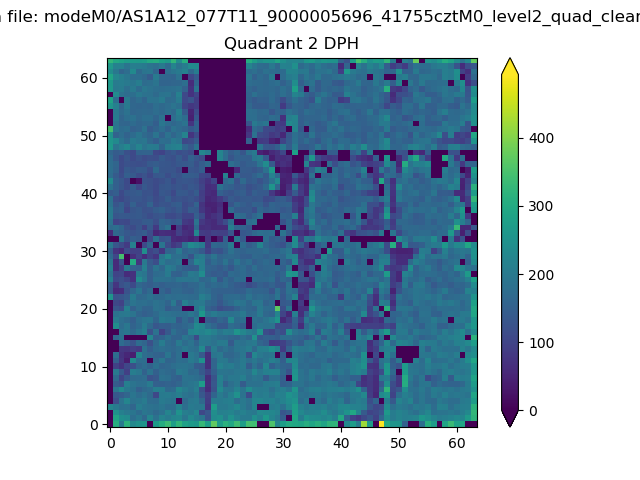
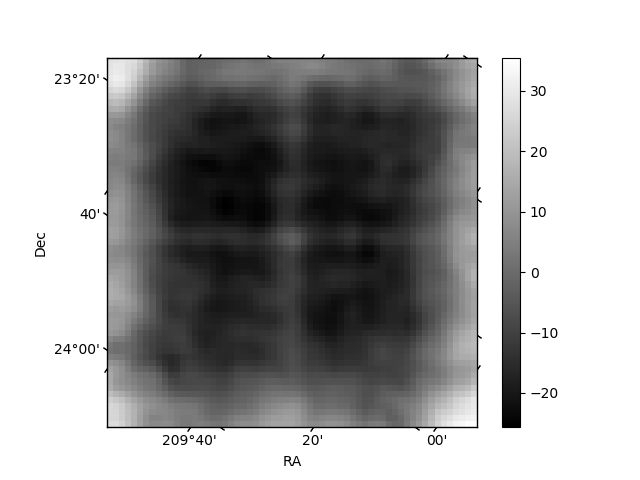
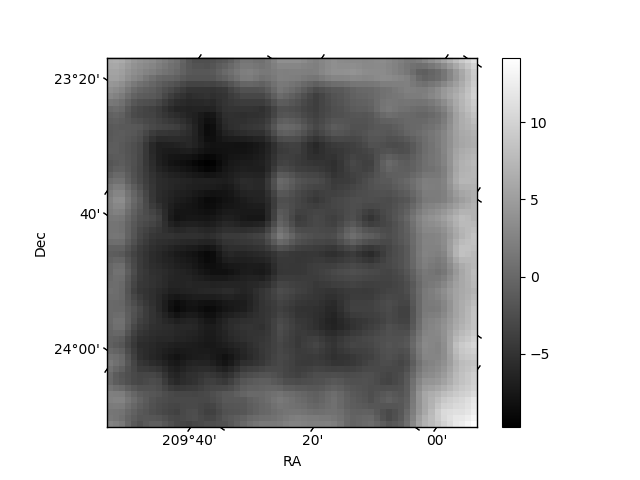
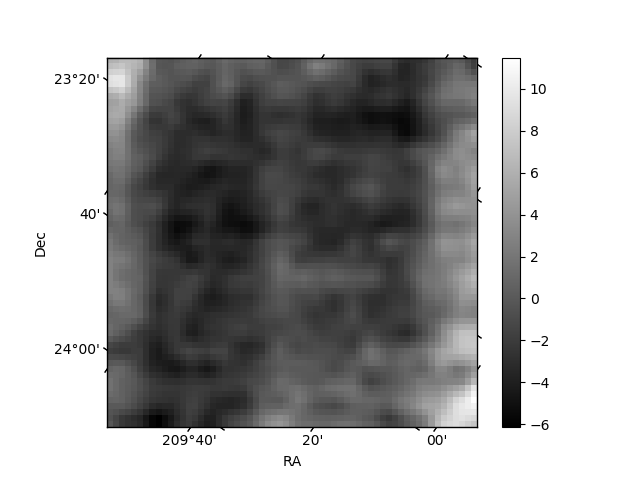
Histogram calculated using DETX and DETY for each event in the final _common_clean file
| Quadrant A | 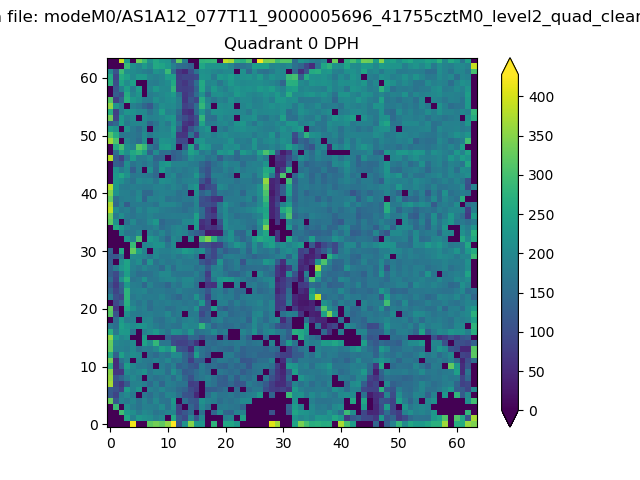 |
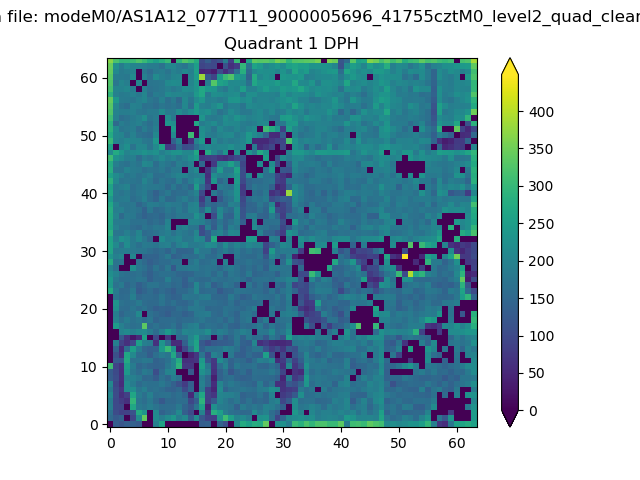 |
Quadrant B |
|---|---|---|---|
| Quadrant D | 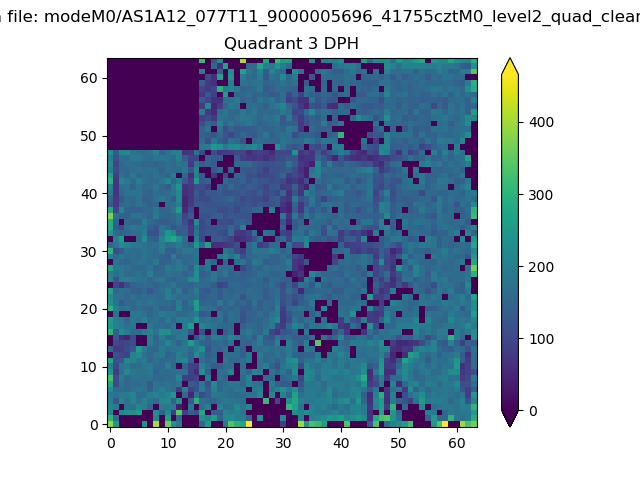 |
 |
Quadrant C |
| Plot type | Count rate plots | Images |
|---|---|---|
| Comparison with Poisson distribution Blue bars denote a histogram of data divided into 1 sec bins. Red curve is a Poisson curve with rate = median count rate of data. |
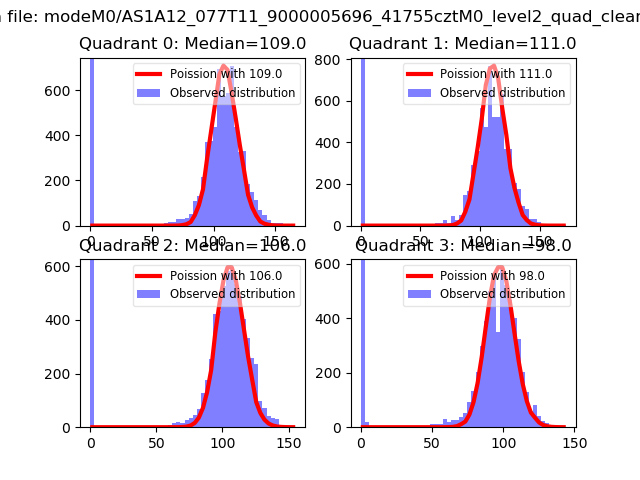 |
 |
| Quadrant-wise count rates Data is divided into 100 sec bins |
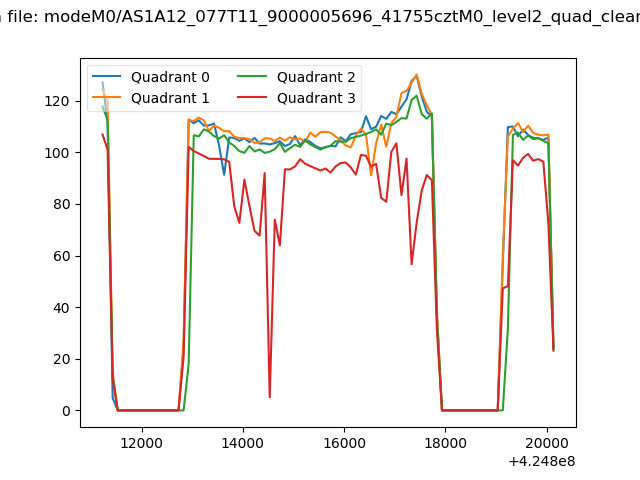 |
|
| Module-wise count rates for Quadrant A Data is divided into 100 sec bins |
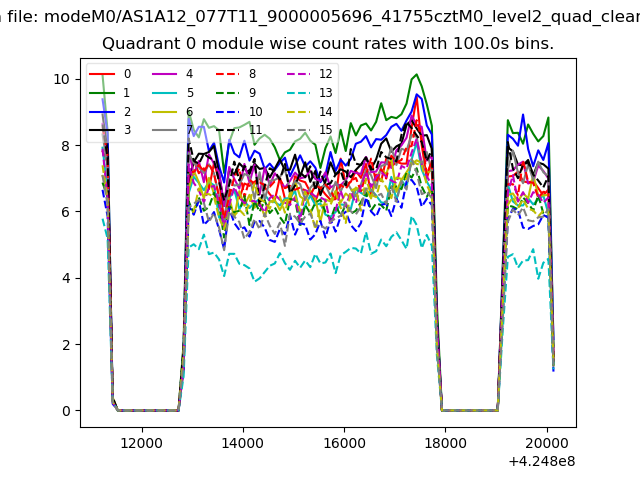 |
 |
| Module-wise count rates for Quadrant B Data is divided into 100 sec bins |
 |
 |
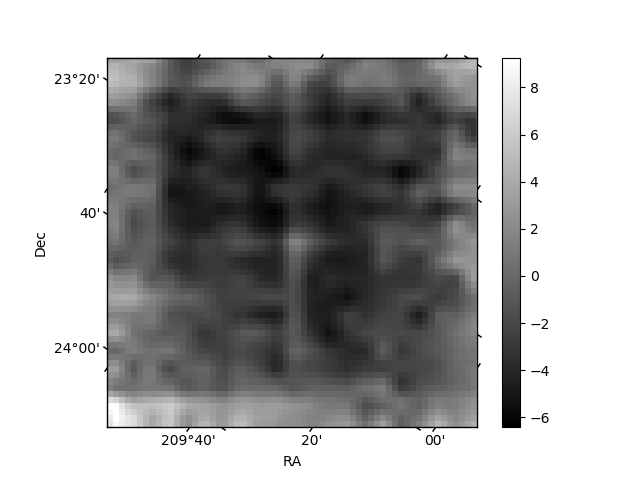
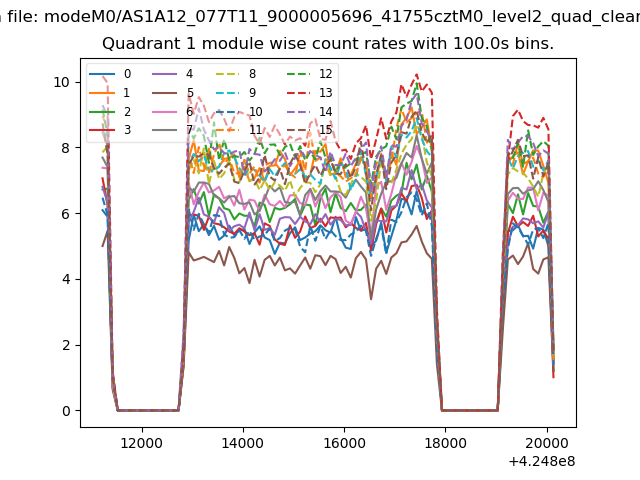
| Module-wise count rates for Quadrant C Data is divided into 100 sec bins |
 |
 |
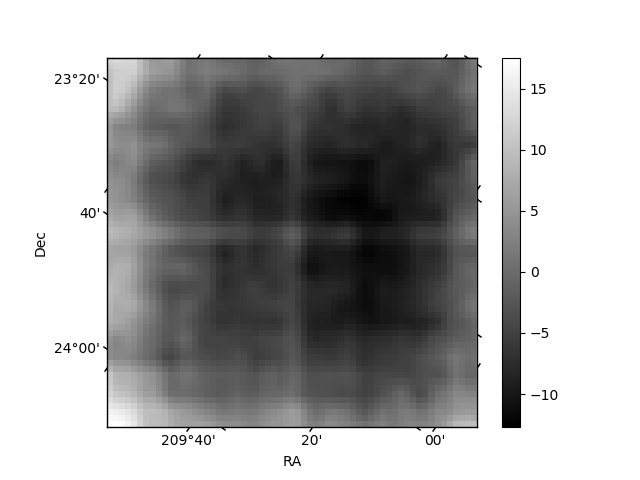
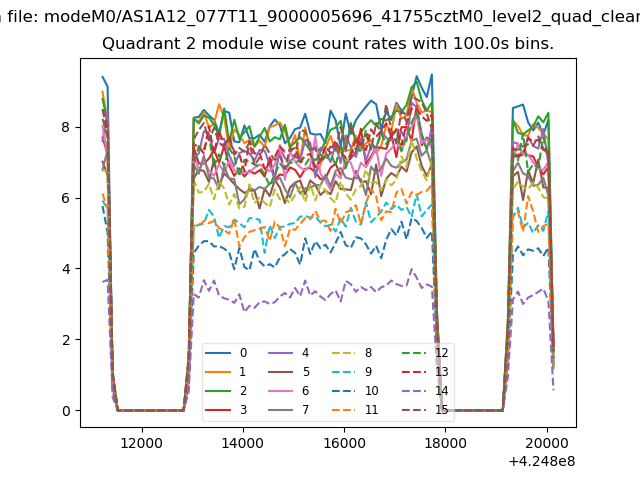
| Module-wise count rates for Quadrant D Data is divided into 100 sec bins |
 |
 |
| Parameter | Plot |
|---|---|
| CZT HV Monitor | 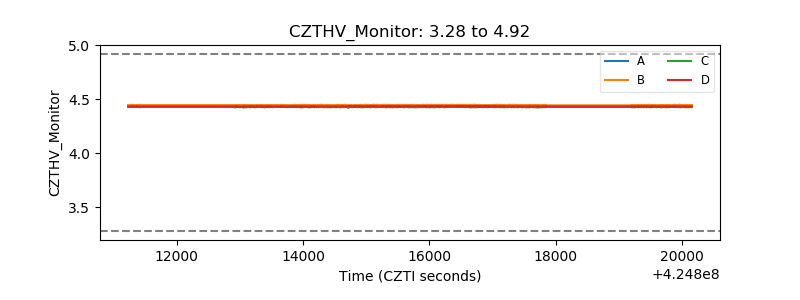 |
| D_VDD | 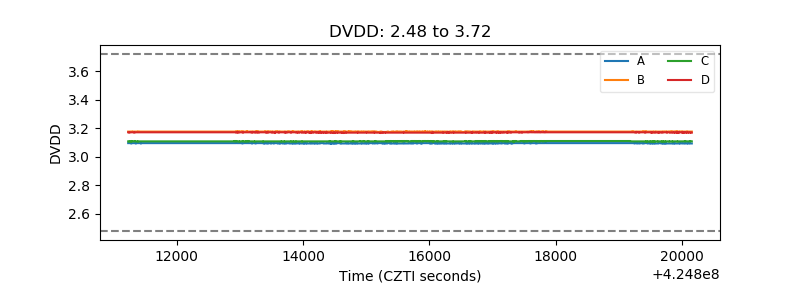 |
| Temperature 1 | 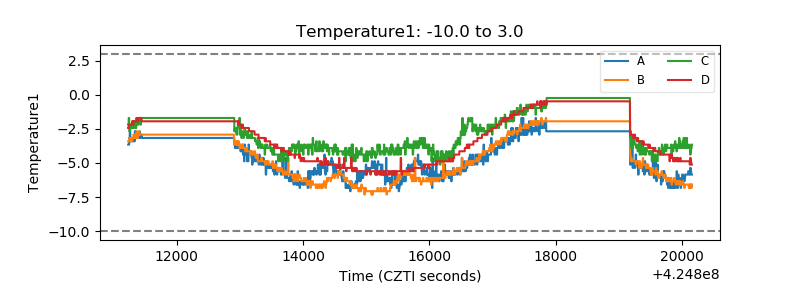 |
| Veto HV Monitor | 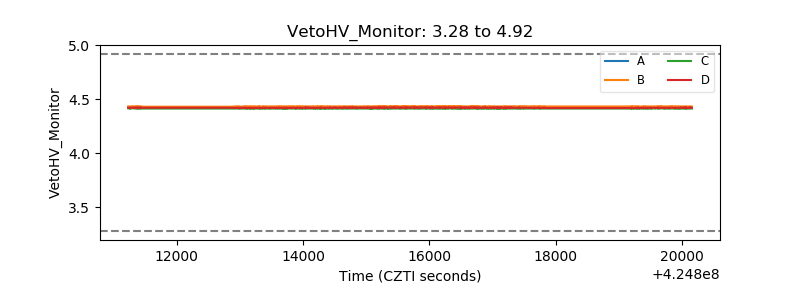 |
| Veto LLD | 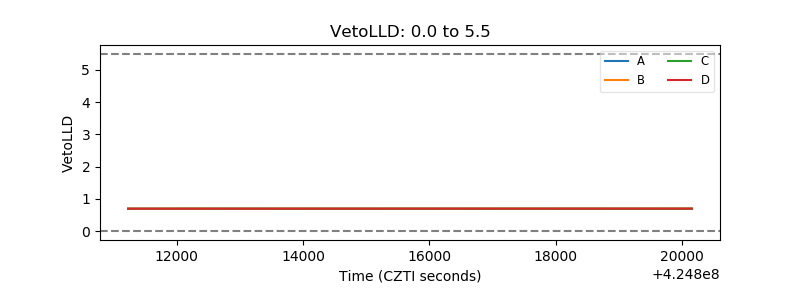 |
| Alpha Counter | 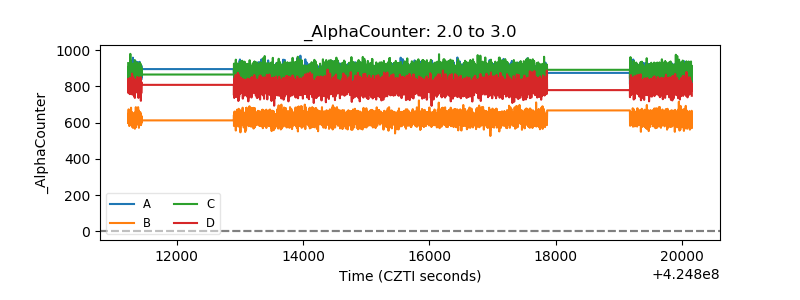 |
| _CPM_Rate | 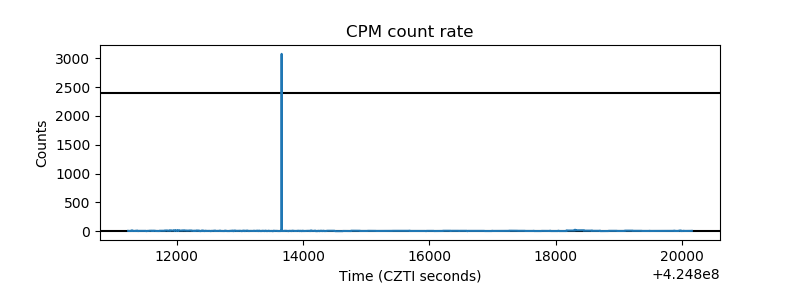 |
| CZT Counter | 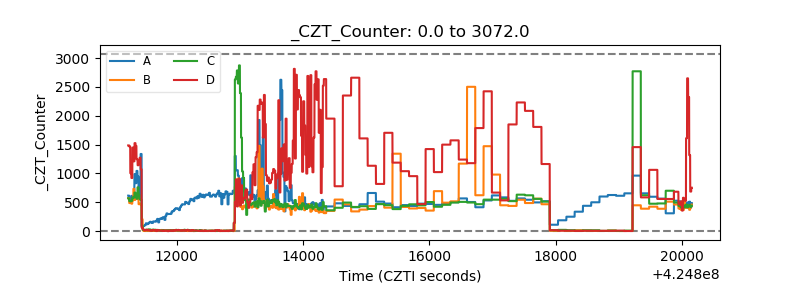 |
| +2.5 Volts monitor | 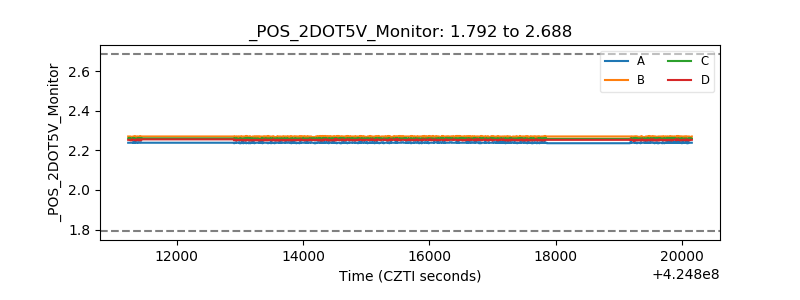 |
| +5 Volts monitor | 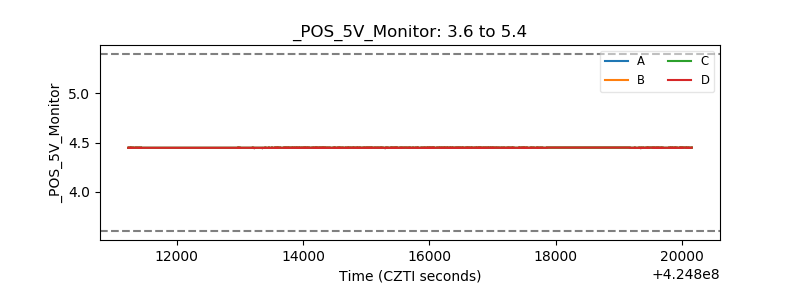 |
| _ROLL_ROT | 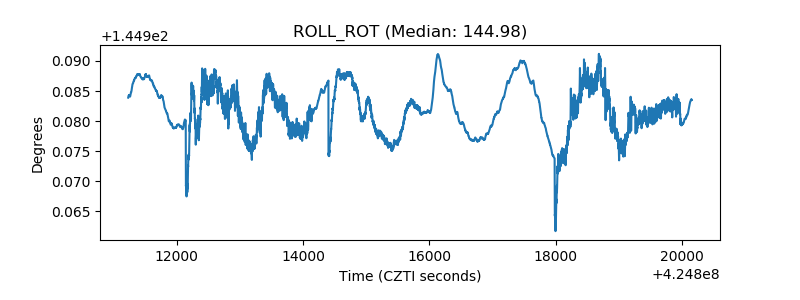 |
| _Roll_DEC | 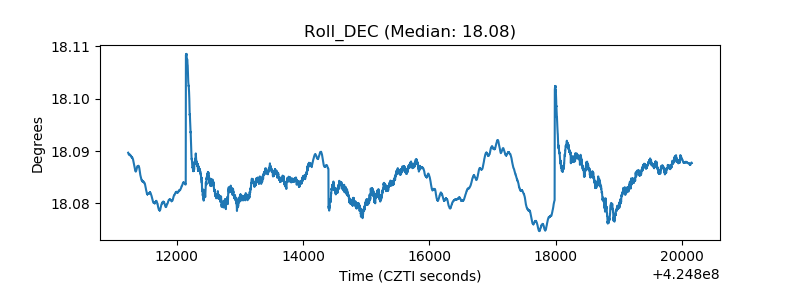 |
| _Roll_RA | 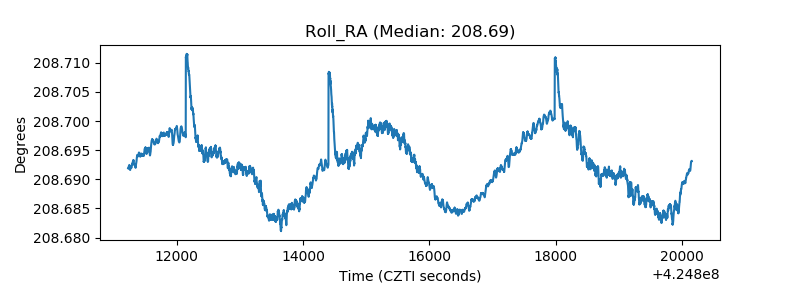 |
| Veto Counter | 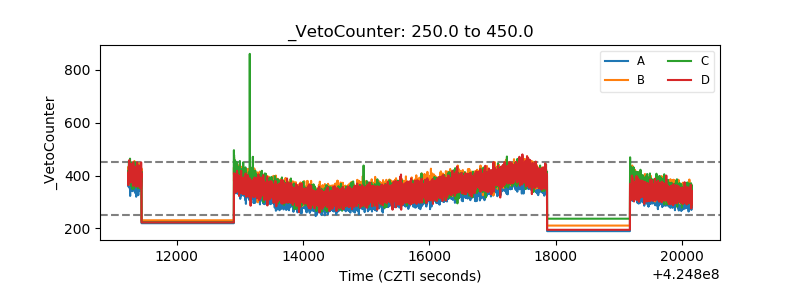 |