| Param | Original file | Final file |
|---|---|---|
| Filename | modeM0/AS1A12_077T11_9000005696_41758cztM0_level2.fits | modeM0/AS1A12_077T11_9000005696_41758cztM0_level2_quad_clean.evt |
| Size (bytes) | 1,211,143,680 | 241,413,120 |
| Size | 1.1 GB | 230.2 MB |
| Events in quadrant A | 8,166,880 | 1,664,813 |
| Events in quadrant B | 8,099,761 | 1,675,890 |
| Events in quadrant C | 9,702,150 | 1,588,376 |
| Events in quadrant D | 17,657,632 | 1,303,506 |
| Mode M9 | |||
|---|---|---|---|
| Quadrant | BADHDUFLAG | Total packets | Discarded packets |
| A | 0 | 52 | 0 |
| B | 0 | 53 | 0 |
| C | 0 | 53 | 0 |
| D | 0 | 53 | 0 |
| Mode M0 | |||
|---|---|---|---|
| Quadrant | BADHDUFLAG | Total packets | Discarded packets |
| A | 0 | 33497 | 10 |
| B | 0 | 34786 | 17 |
| C | 0 | 38733 | 21 |
| D | 0 | 63412 | 38 |
| Mode SS | |||
|---|---|---|---|
| Quadrant | BADHDUFLAG | Total packets | Discarded packets |
| A | 0 | 318 | 0 |
| B | 0 | 318 | 0 |
| C | 0 | 318 | 0 |
| D | 0 | 318 | 0 |
| Quadrant | Total seconds | Saturated seconds | Saturation percentage |
|---|---|---|---|
| A | 15606 | 21 | 0.134564% |
| B | 15600 | 341 | 2.185897% |
| C | 15598 | 527 | 3.378638% |
| D | 15599 | 2467 | 15.815116% |
Noise dominated data is calculated using 1-second bins in cleaned event files. If a bin has >2000 counts, and if more than 50% of those come from <1% of pixels, then it is considered to be noise-dominated and hence unusable.
| Quadrant | # 1 sec bins | Bins with >0 counts | Bins with >2000 counts | High rate bins dominated by noise | Noise dominated (total time) | Noise dominated (detector-on time) | Marked lightcurve |
|---|---|---|---|---|---|---|---|
| A | 19727 | 15611 | 9 | 9 | 0.05% | 0.06% | 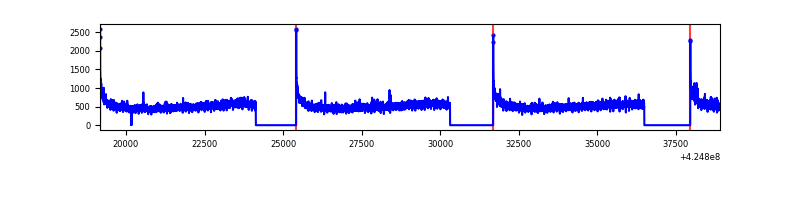 |
| B | 19726 | 15602 | 250 | 250 | 1.27% | 1.60% | 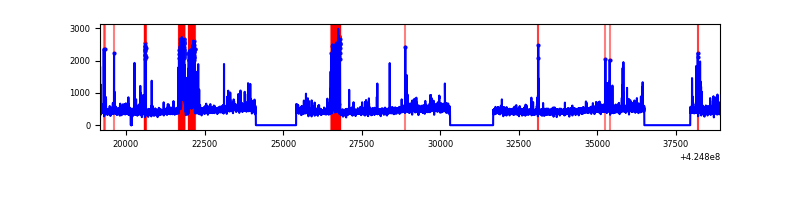 |
| C | 19726 | 15604 | 526 | 526 | 2.67% | 3.37% | 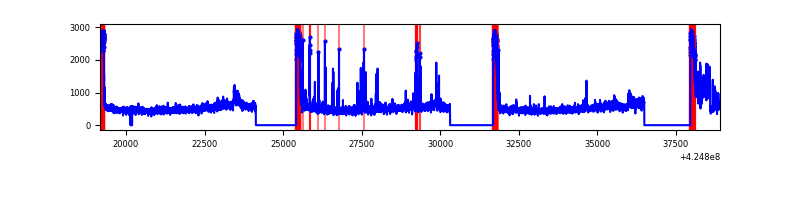 |
| D | 19726 | 15606 | 2476 | 2476 | 12.55% | 15.87% | 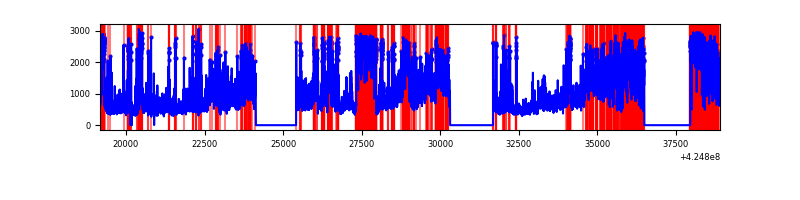 |
Top three noisy pixels from each quadrant. If the there are fewer than three noisy pixels in the level2.evt file, extra rows are filled as -1
| Pixel properties | Quadrant properties | ||||||
|---|---|---|---|---|---|---|---|
| Quadrant | DetID | PixID | Counts | Sigma | Mean | Median | Sigma |
| A | 10 | 83 | 1369760 | 3846.84 | 1737 | 1702 | 355.6 |
| A | 13 | 6 | 36965 | 99.16 | 1737 | 1702 | 355.6 |
| A | 10 | 255 | 28260 | 74.68 | 1737 | 1702 | 355.6 |
| B | 5 | 255 | 966438 | 2903.69 | 1709 | 1664 | 332.3 |
| B | 0 | 245 | 202505 | 604.47 | 1709 | 1664 | 332.3 |
| B | 3 | 112 | 87516 | 258.39 | 1709 | 1664 | 332.3 |
| C | 0 | 10 | 1934412 | 5014.61 | 1652 | 1662 | 385.4 |
| C | 15 | 214 | 665089 | 1721.29 | 1652 | 1662 | 385.4 |
| C | 14 | 254 | 657175 | 1700.76 | 1652 | 1662 | 385.4 |
| D | 12 | 79 | 8450862 | 21662.28 | 1592 | 1546 | 390.0 |
| D | 2 | 249 | 1502750 | 3848.77 | 1592 | 1546 | 390.0 |
| D | 12 | 6 | 607266 | 1552.94 | 1592 | 1546 | 390.0 |
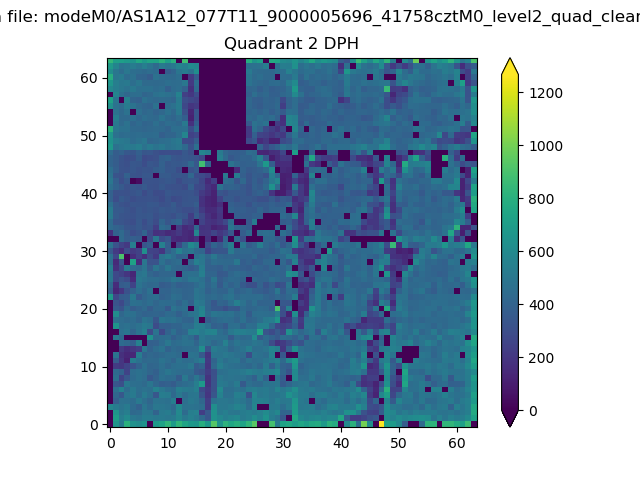
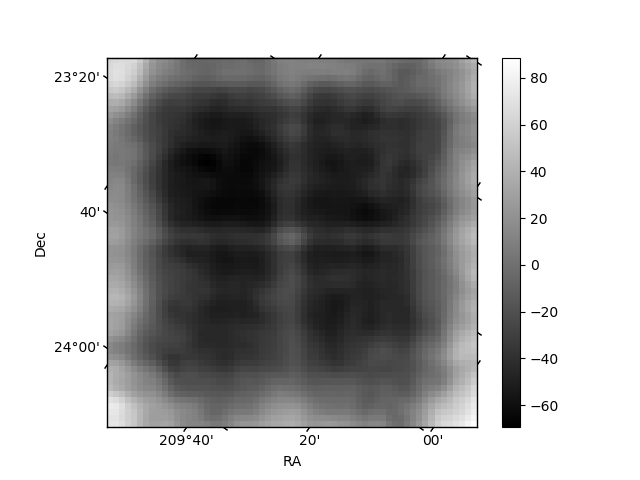
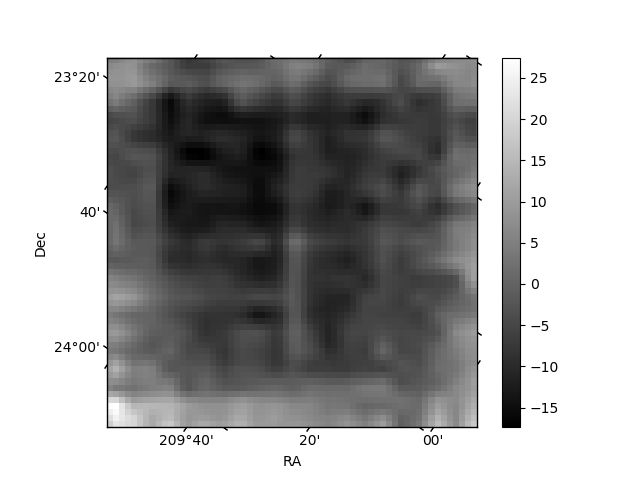
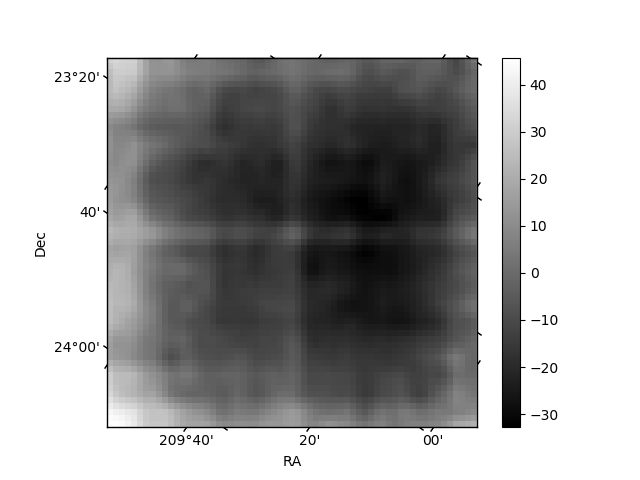
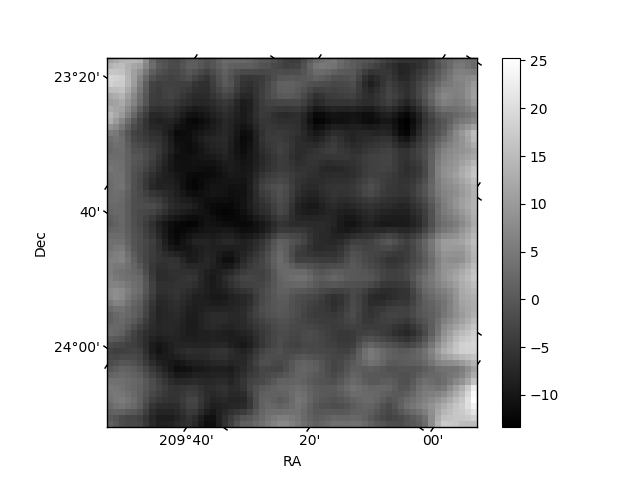
Histogram calculated using DETX and DETY for each event in the final _common_clean file
| Quadrant A | 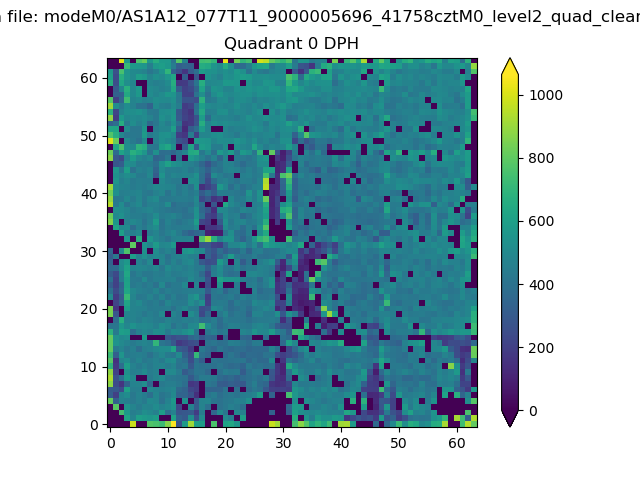 |
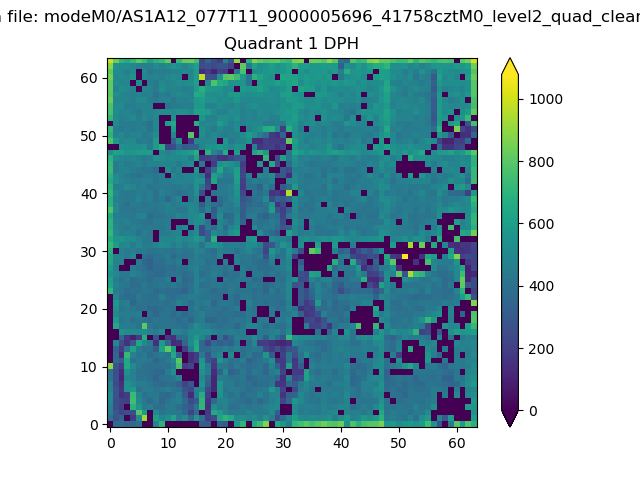 |
Quadrant B |
|---|---|---|---|
| Quadrant D | 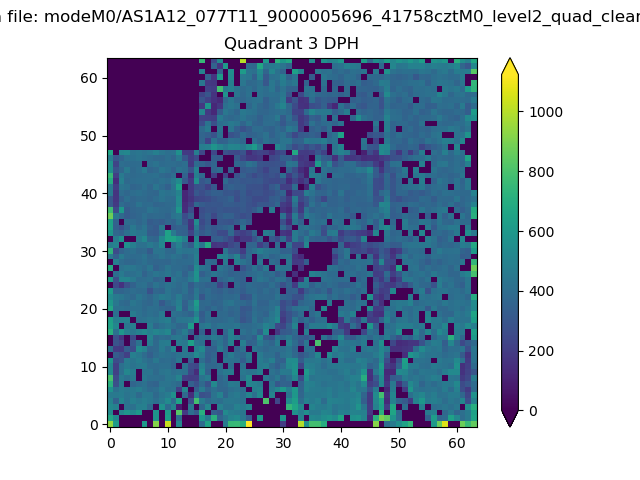 |
 |
Quadrant C |
| Plot type | Count rate plots | Images |
|---|---|---|
| Comparison with Poisson distribution Blue bars denote a histogram of data divided into 1 sec bins. Red curve is a Poisson curve with rate = median count rate of data. |
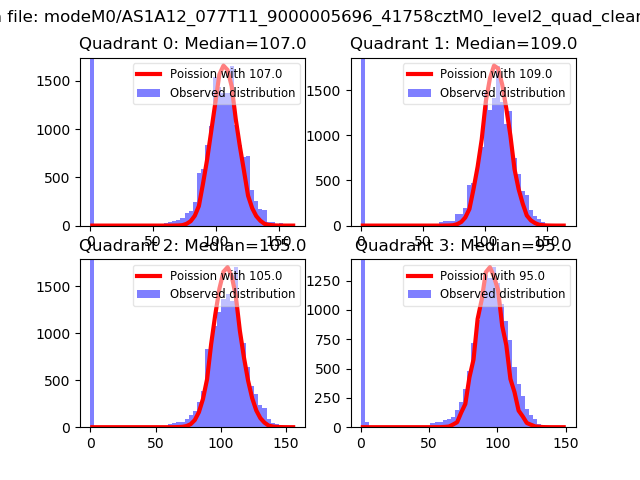 |
 |
| Quadrant-wise count rates Data is divided into 100 sec bins |
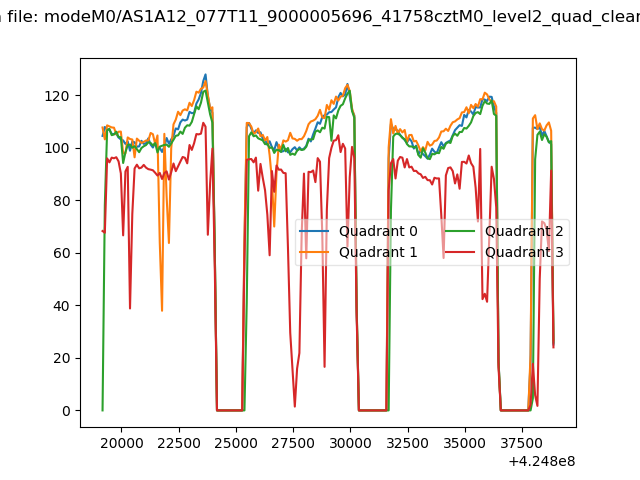 |
|
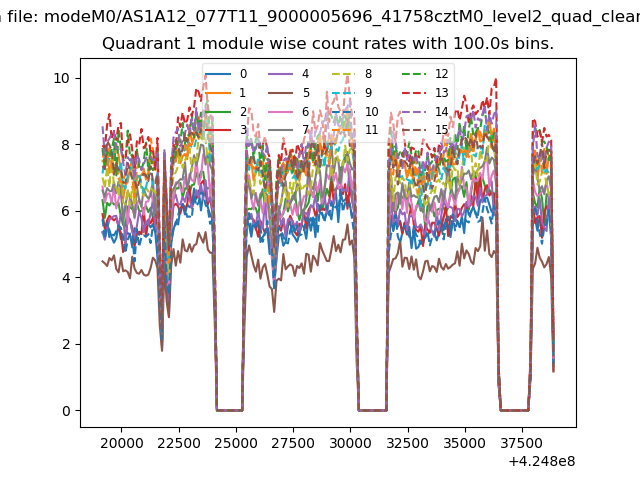
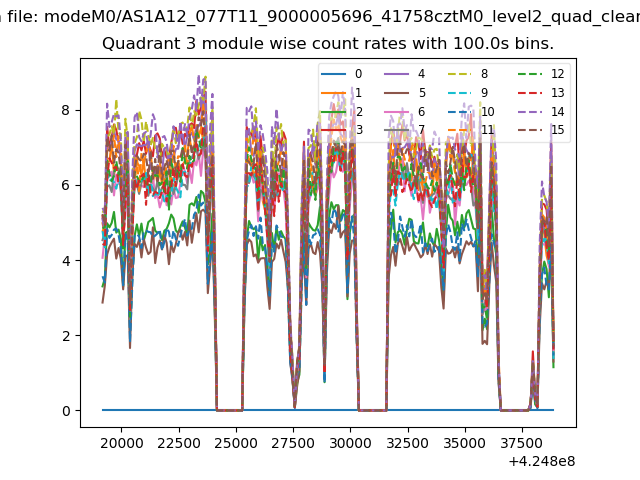
| Module-wise count rates for Quadrant A Data is divided into 100 sec bins |
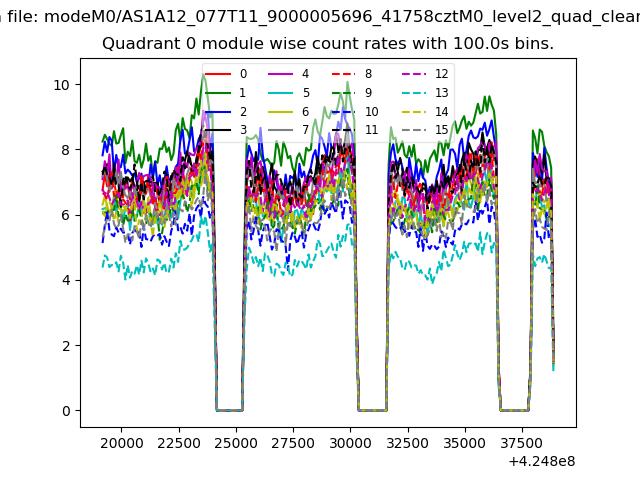 |
 |
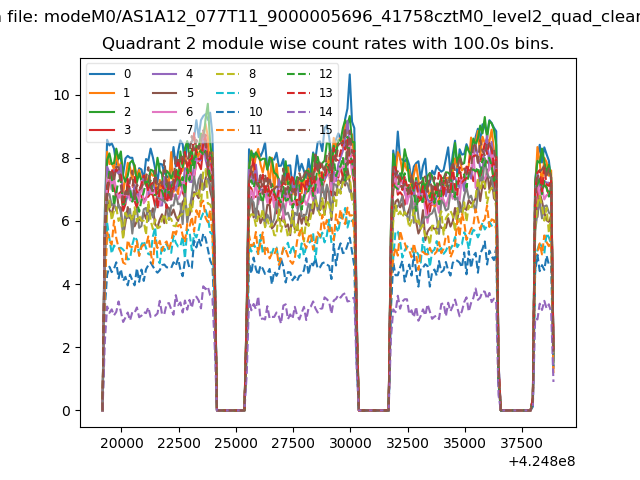
| Module-wise count rates for Quadrant B Data is divided into 100 sec bins |
 |
 |
| Module-wise count rates for Quadrant C Data is divided into 100 sec bins |
 |
 |
| Module-wise count rates for Quadrant D Data is divided into 100 sec bins |
 |
 |
| Parameter | Plot |
|---|---|
| CZT HV Monitor | 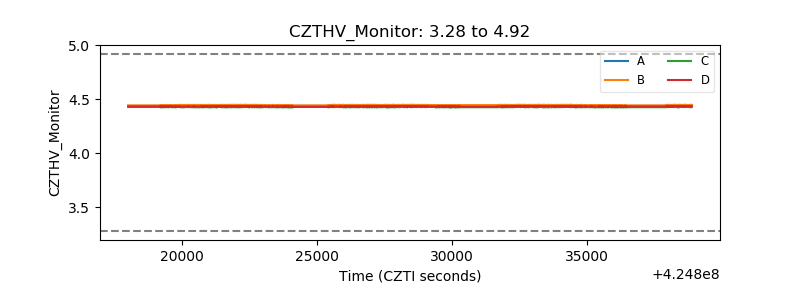 |
| D_VDD | 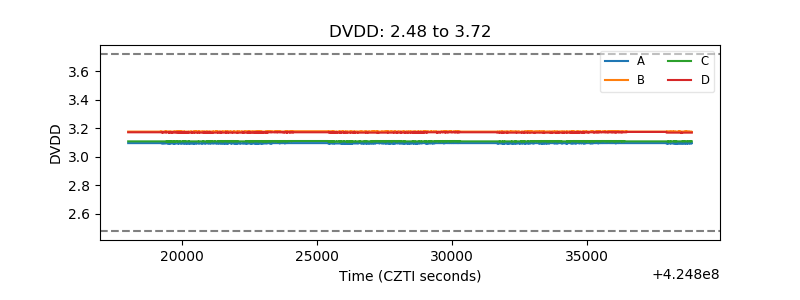 |
| Temperature 1 | 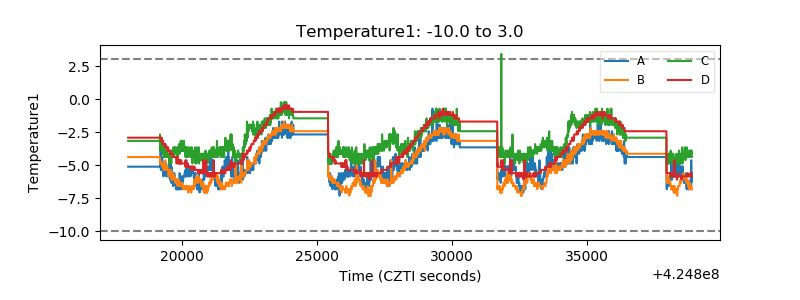 |
| Veto HV Monitor | 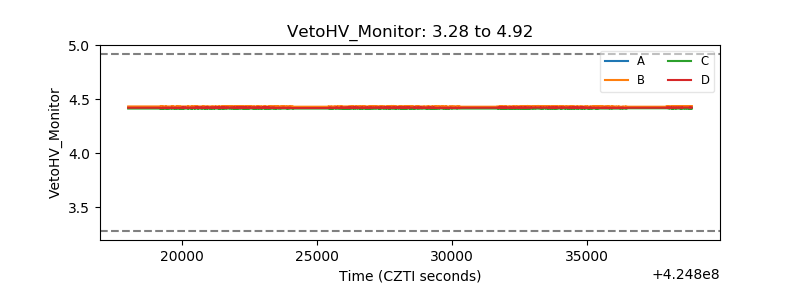 |
| Veto LLD | 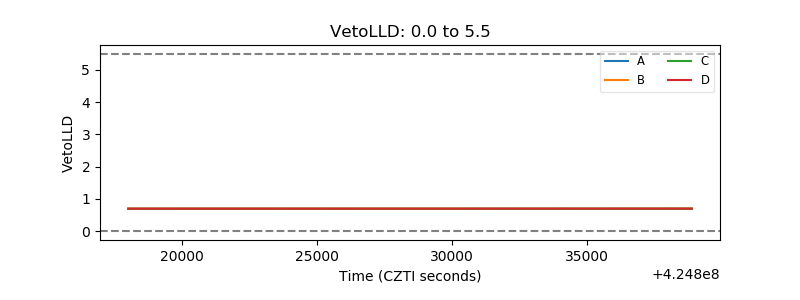 |
| Alpha Counter | 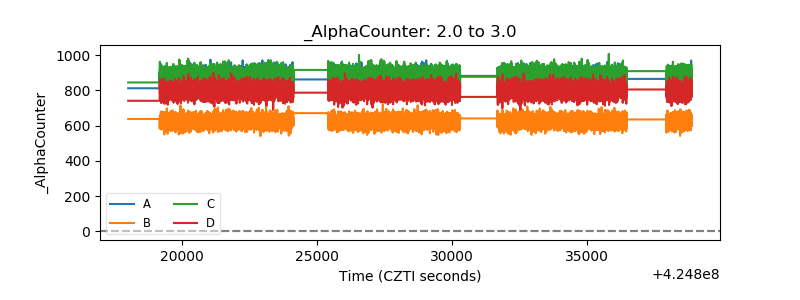 |
| _CPM_Rate | 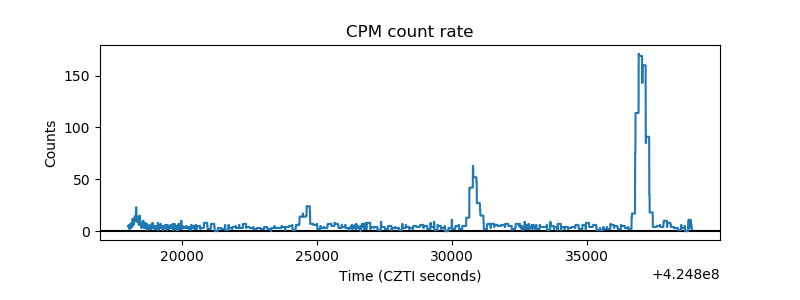 |
| CZT Counter | 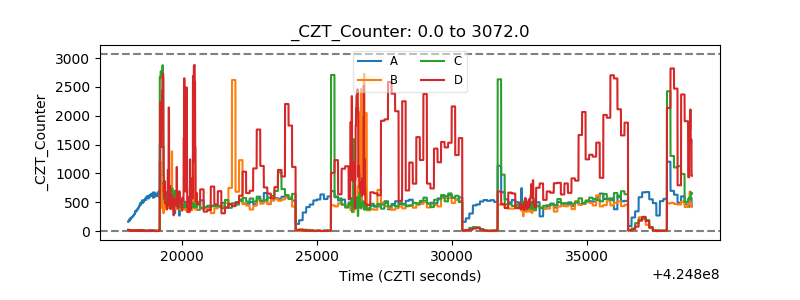 |
| +2.5 Volts monitor | 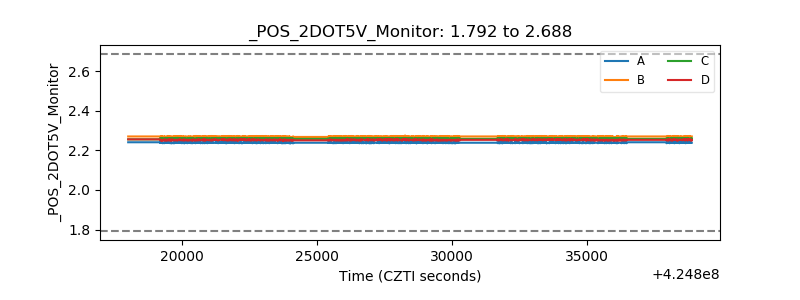 |
| +5 Volts monitor | 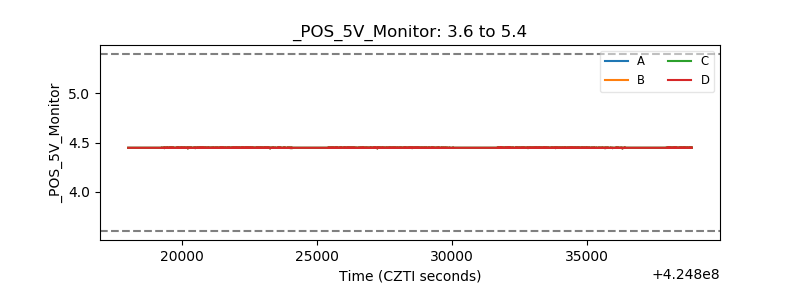 |
| _ROLL_ROT | 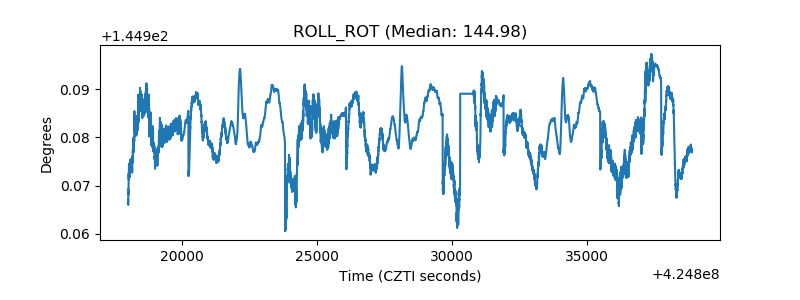 |
| _Roll_DEC | 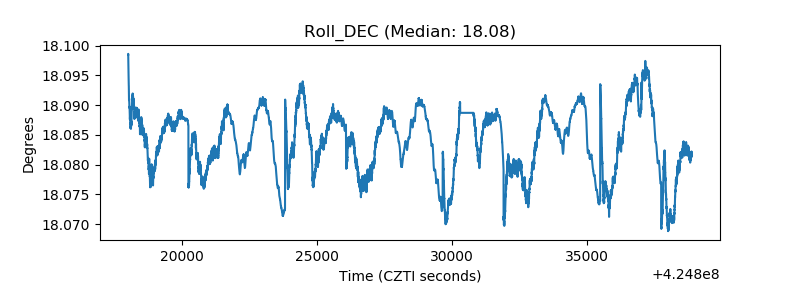 |
| _Roll_RA | 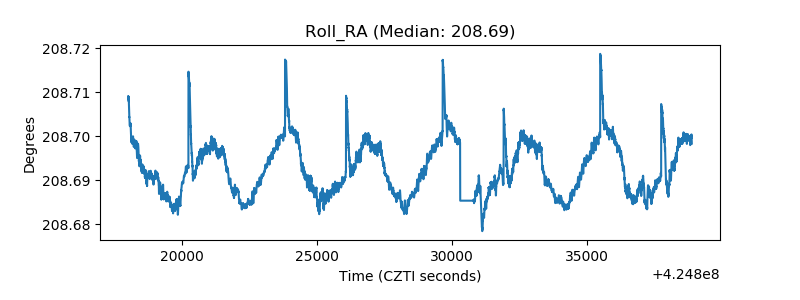 |
| Veto Counter | 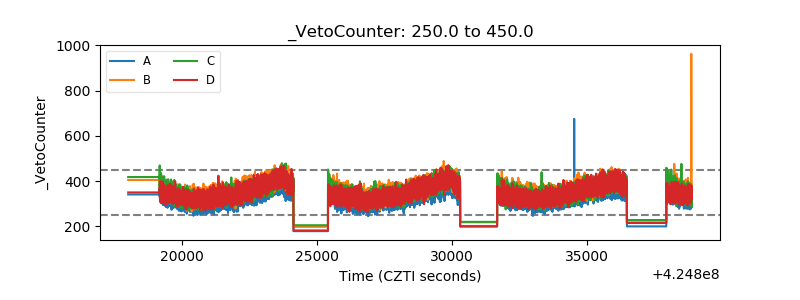 |