| Param | Original file | Final file |
|---|---|---|
| Filename | modeM0/AS1A12_077T11_9000005696_41759cztM0_level2.fits | modeM0/AS1A12_077T11_9000005696_41759cztM0_level2_quad_clean.evt |
| Size (bytes) | 476,340,480 | 85,311,360 |
| Size | 454.3 MB | 81.4 MB |
| Events in quadrant A | 2,966,278 | 597,998 |
| Events in quadrant B | 2,505,674 | 616,953 |
| Events in quadrant C | 3,741,907 | 556,599 |
| Events in quadrant D | 7,992,444 | 427,164 |
| Mode M9 | |||
|---|---|---|---|
| Quadrant | BADHDUFLAG | Total packets | Discarded packets |
| A | 0 | 19 | 0 |
| B | 0 | 20 | 0 |
| C | 0 | 20 | 0 |
| D | 0 | 20 | 0 |
| Mode M0 | |||
|---|---|---|---|
| Quadrant | BADHDUFLAG | Total packets | Discarded packets |
| A | 0 | 11947 | 2 |
| B | 0 | 11220 | 2 |
| C | 0 | 14223 | 2 |
| D | 0 | 27525 | 2 |
| Mode SS | |||
|---|---|---|---|
| Quadrant | BADHDUFLAG | Total packets | Discarded packets |
| A | 0 | 112 | 0 |
| B | 0 | 112 | 0 |
| C | 0 | 112 | 0 |
| D | 0 | 112 | 0 |
| Quadrant | Total seconds | Saturated seconds | Saturation percentage |
|---|---|---|---|
| A | 5490 | 16 | 0.291439% |
| B | 5489 | 8 | 0.145746% |
| C | 5489 | 250 | 4.554564% |
| D | 5489 | 1356 | 24.703953% |
Noise dominated data is calculated using 1-second bins in cleaned event files. If a bin has >2000 counts, and if more than 50% of those come from <1% of pixels, then it is considered to be noise-dominated and hence unusable.
| Quadrant | # 1 sec bins | Bins with >0 counts | Bins with >2000 counts | High rate bins dominated by noise | Noise dominated (total time) | Noise dominated (detector-on time) | Marked lightcurve |
|---|---|---|---|---|---|---|---|
| A | 7102 | 5491 | 4 | 4 | 0.06% | 0.07% | 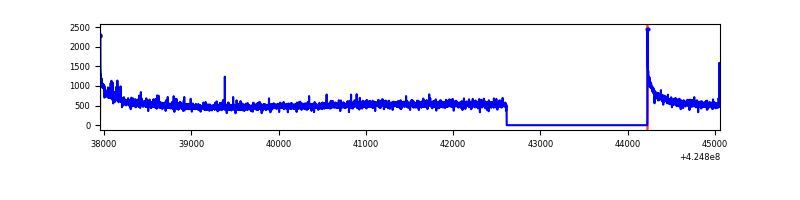 |
| B | 7100 | 5489 | 3 | 3 | 0.04% | 0.05% | 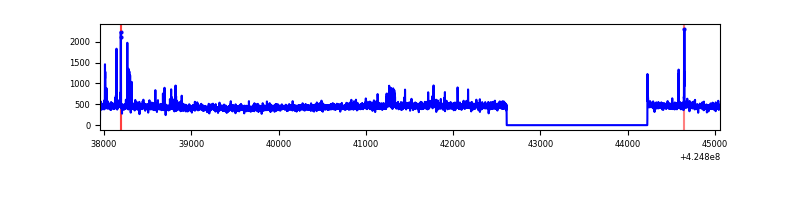 |
| C | 7100 | 5488 | 252 | 252 | 3.55% | 4.59% |  |
| D | 7100 | 5488 | 1551 | 1551 | 21.85% | 28.26% | 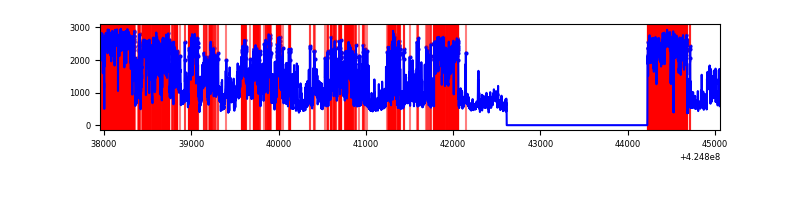 |
Top three noisy pixels from each quadrant. If the there are fewer than three noisy pixels in the level2.evt file, extra rows are filled as -1
| Pixel properties | Quadrant properties | ||||||
|---|---|---|---|---|---|---|---|
| Quadrant | DetID | PixID | Counts | Sigma | Mean | Median | Sigma |
| A | 10 | 83 | 535797 | 4216.76 | 614 | 600 | 126.9 |
| A | 10 | 255 | 30961 | 239.21 | 614 | 600 | 126.9 |
| A | 13 | 6 | 11085 | 82.61 | 614 | 600 | 126.9 |
| B | 0 | 245 | 83444 | 693.1 | 607 | 589 | 119.5 |
| B | 12 | 111 | 15471 | 124.49 | 607 | 589 | 119.5 |
| B | 0 | 183 | 15338 | 123.38 | 607 | 589 | 119.5 |
| C | 0 | 10 | 831626 | 6115.97 | 579 | 582 | 135.9 |
| C | 14 | 254 | 405957 | 2983.31 | 579 | 582 | 135.9 |
| C | 15 | 214 | 238605 | 1751.7 | 579 | 582 | 135.9 |
| D | 12 | 79 | 5093330 | 37105.33 | 551 | 534 | 137.3 |
| D | 2 | 249 | 372805 | 2712.31 | 551 | 534 | 137.3 |
| D | 13 | 249 | 150376 | 1091.73 | 551 | 534 | 137.3 |
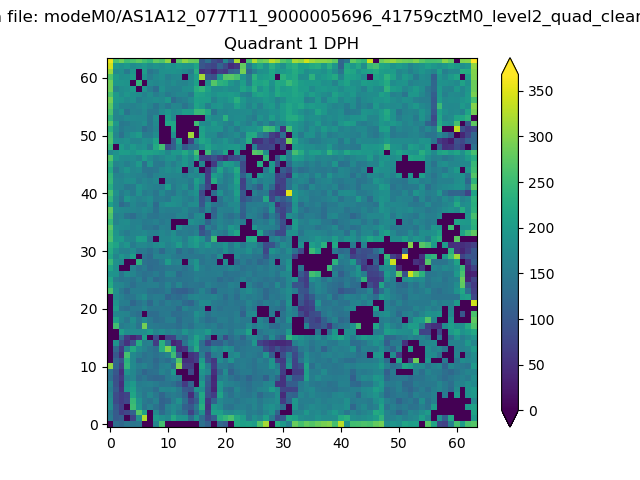
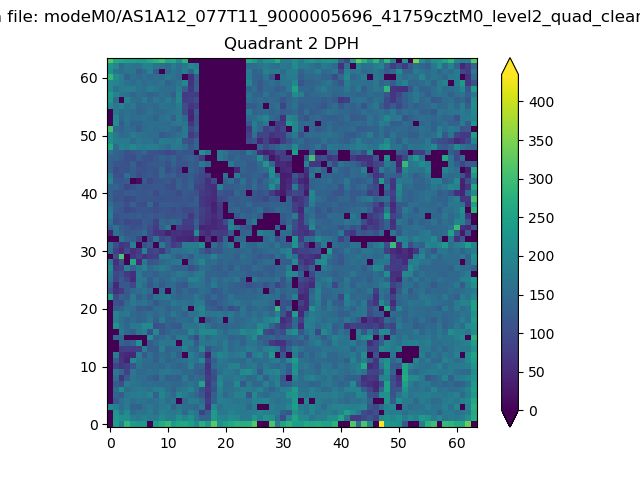
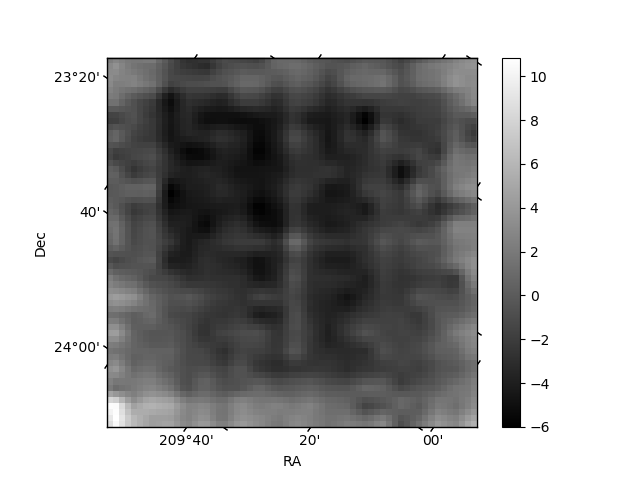
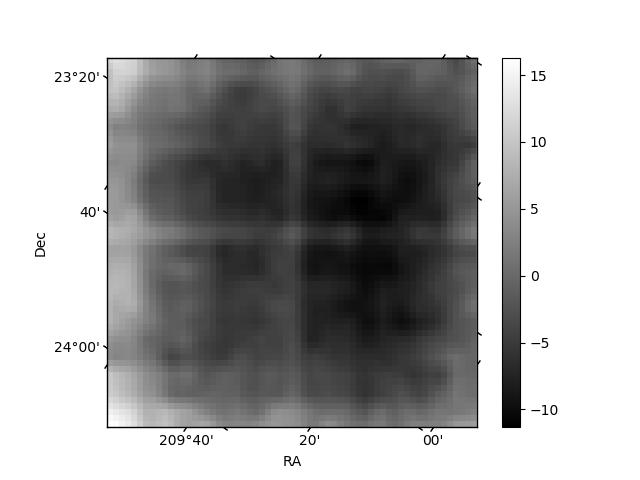
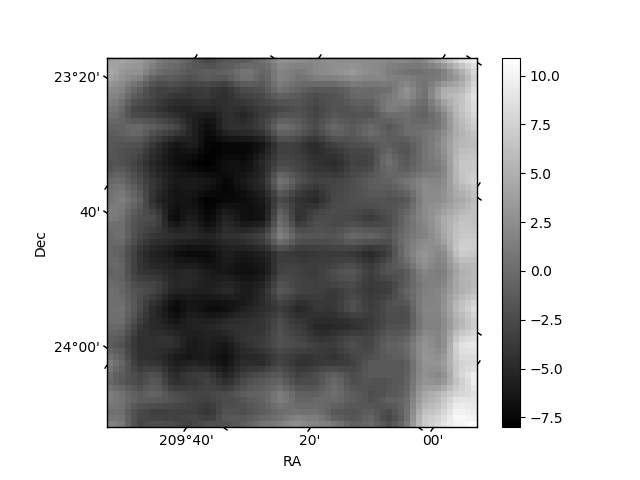
Histogram calculated using DETX and DETY for each event in the final _common_clean file
| Quadrant A | 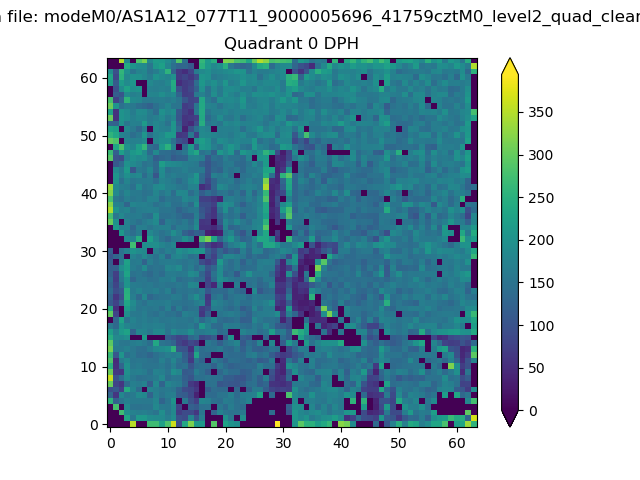 |
 |
Quadrant B |
|---|---|---|---|
| Quadrant D | 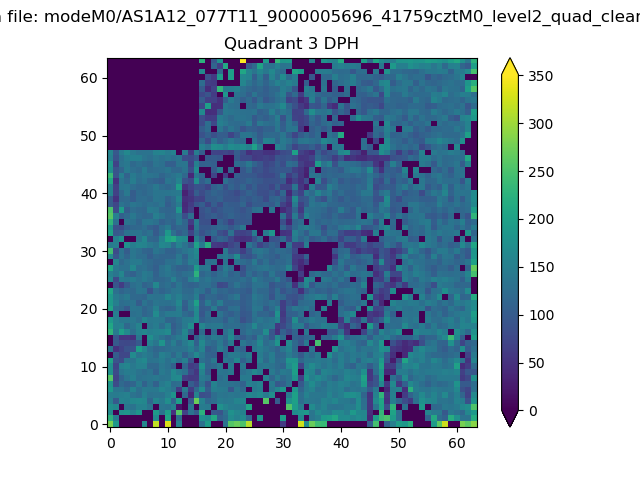 |
 |
Quadrant C |
| Plot type | Count rate plots | Images |
|---|---|---|
| Comparison with Poisson distribution Blue bars denote a histogram of data divided into 1 sec bins. Red curve is a Poisson curve with rate = median count rate of data. |
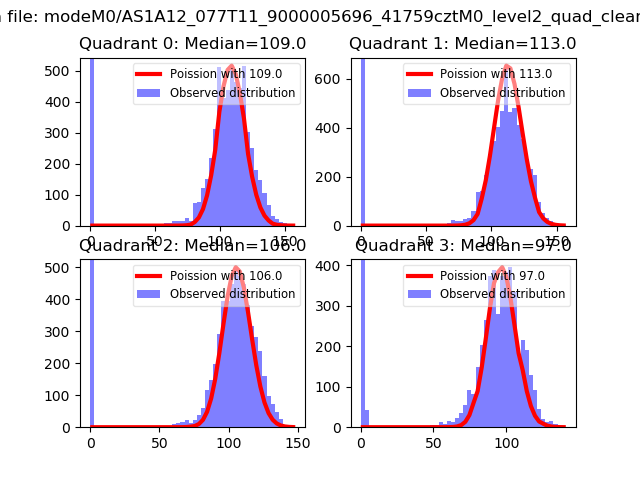 |
 |
| Quadrant-wise count rates Data is divided into 100 sec bins |
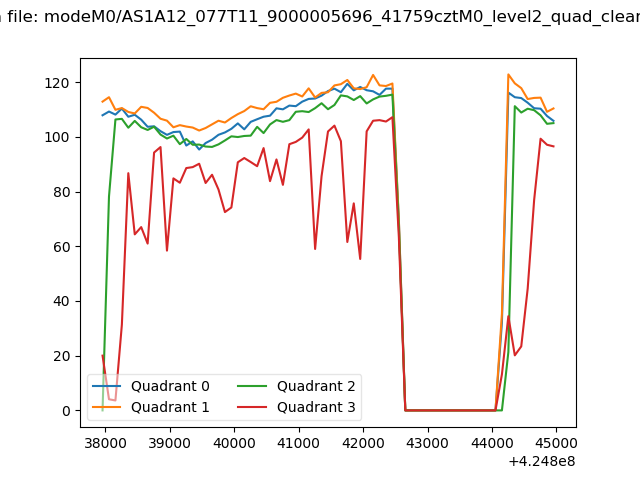 |
|
| Module-wise count rates for Quadrant A Data is divided into 100 sec bins |
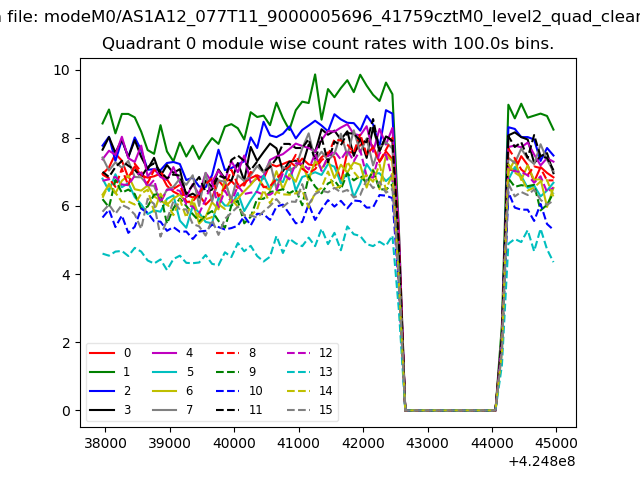 |
 |
| Module-wise count rates for Quadrant B Data is divided into 100 sec bins |
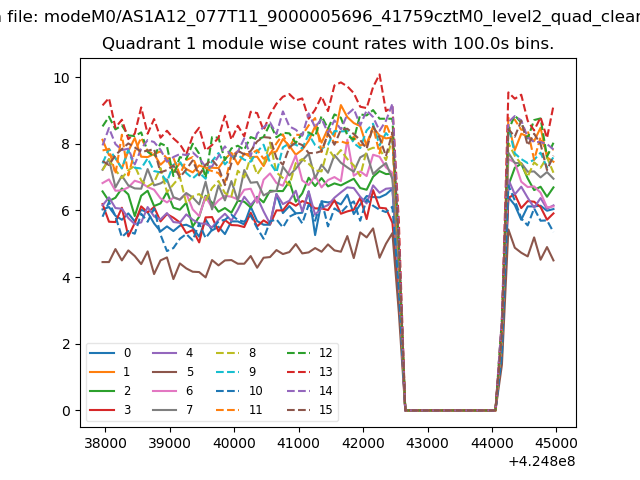 |
 |
| Module-wise count rates for Quadrant C Data is divided into 100 sec bins |
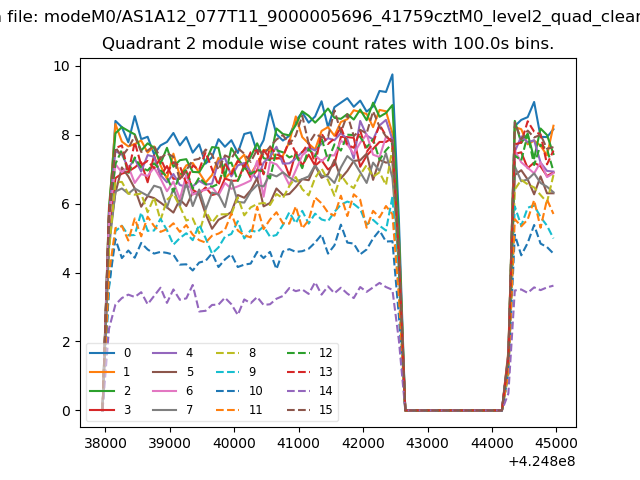 |
 |
| Module-wise count rates for Quadrant D Data is divided into 100 sec bins |
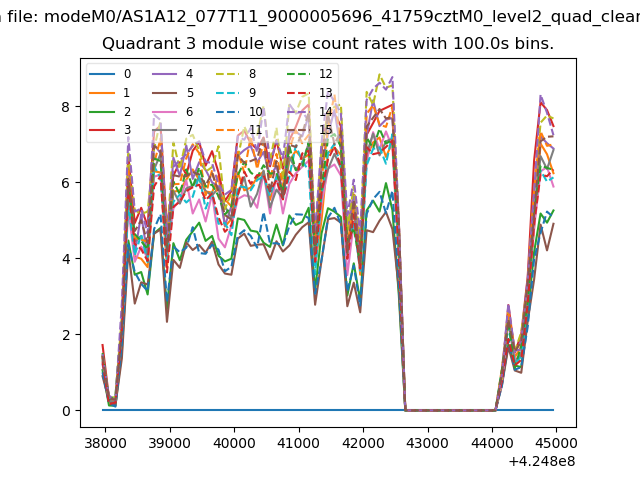 |
 |
| Parameter | Plot |
|---|---|
| CZT HV Monitor | 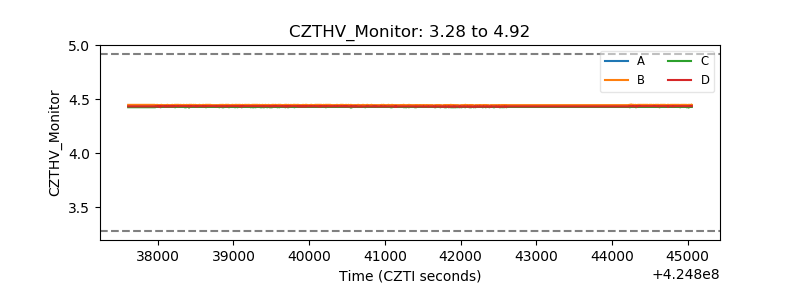 |
| D_VDD | 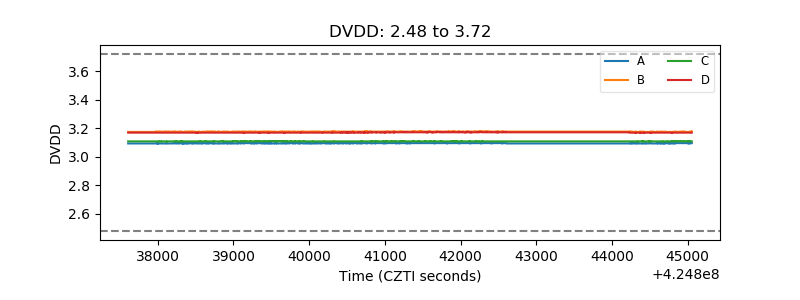 |
| Temperature 1 | 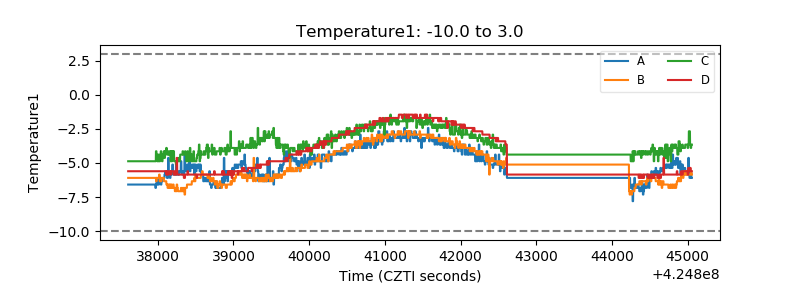 |
| Veto HV Monitor | 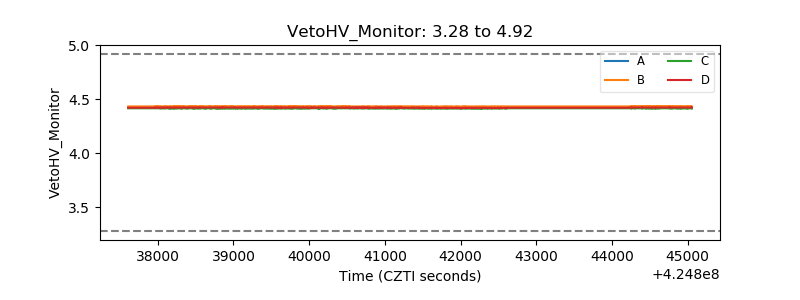 |
| Veto LLD | 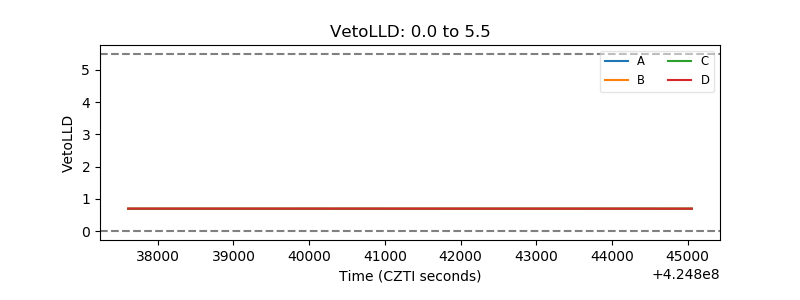 |
| Alpha Counter |  |
| _CPM_Rate | 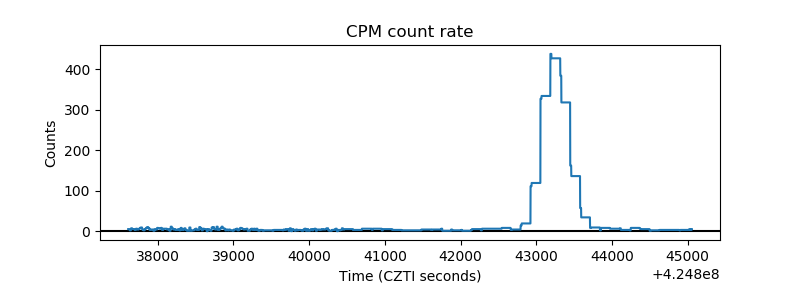 |
| CZT Counter |  |
| +2.5 Volts monitor | 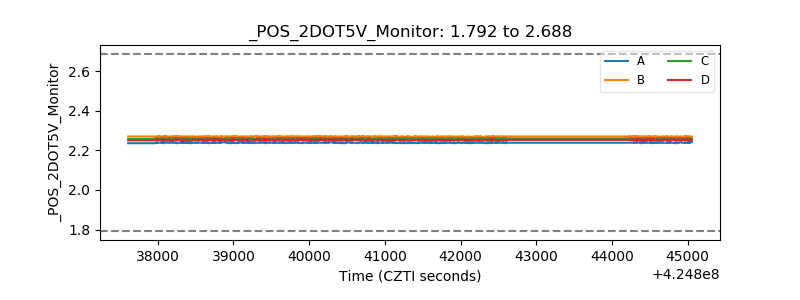 |
| +5 Volts monitor | 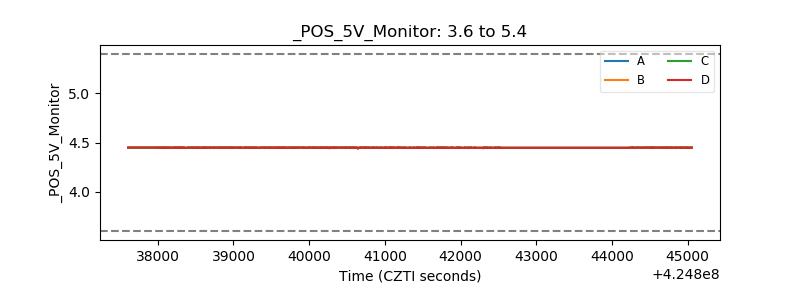 |
| _ROLL_ROT | 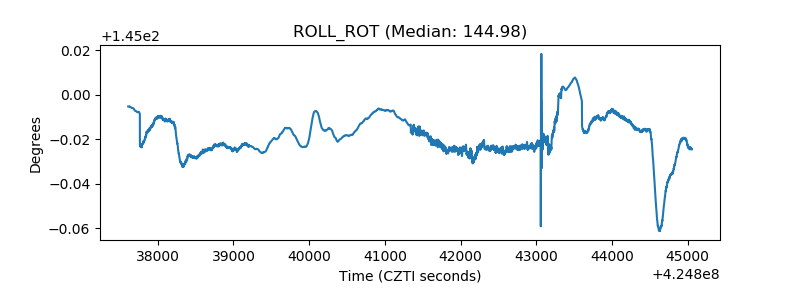 |
| _Roll_DEC | 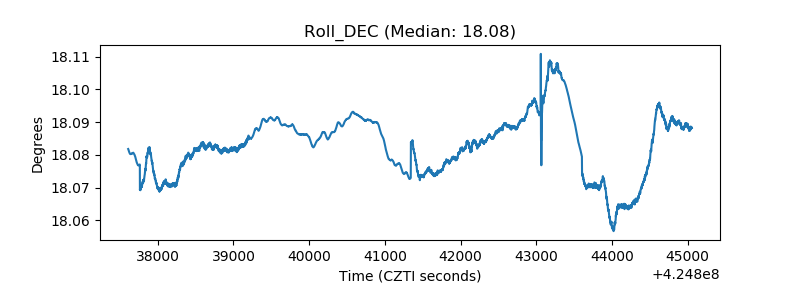 |
| _Roll_RA |  |
| Veto Counter | 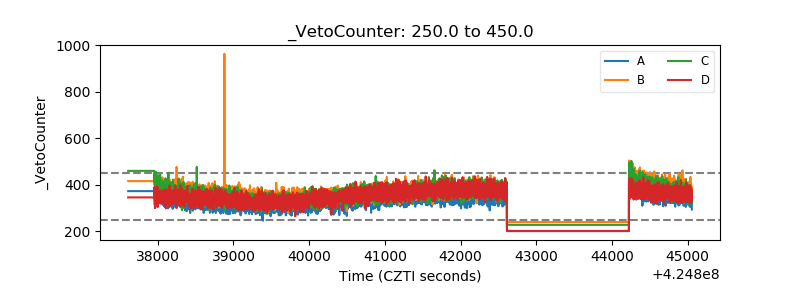 |