| Param | Original file | Final file |
|---|---|---|
| Filename | modeM0/AS1A12_077T11_9000005696_41761cztM0_level2.fits | modeM0/AS1A12_077T11_9000005696_41761cztM0_level2_quad_clean.evt |
| Size (bytes) | 331,511,040 | 63,426,240 |
| Size | 316.2 MB | 60.5 MB |
| Events in quadrant A | 2,520,775 | 441,066 |
| Events in quadrant B | 1,793,159 | 456,862 |
| Events in quadrant C | 2,265,351 | 415,663 |
| Events in quadrant D | 5,379,186 | 323,939 |
| Mode M9 | |||
|---|---|---|---|
| Quadrant | BADHDUFLAG | Total packets | Discarded packets |
| A | 0 | 3 | 0 |
| B | 0 | 4 | 0 |
| C | 0 | 4 | 0 |
| D | 0 | 4 | 0 |
| Mode M0 | |||
|---|---|---|---|
| Quadrant | BADHDUFLAG | Total packets | Discarded packets |
| A | 0 | 9973 | 1 |
| B | 0 | 8113 | 1 |
| C | 0 | 8988 | 1 |
| D | 0 | 18805 | 1 |
| Mode SS | |||
|---|---|---|---|
| Quadrant | BADHDUFLAG | Total packets | Discarded packets |
| A | 0 | 80 | 0 |
| B | 0 | 80 | 0 |
| C | 0 | 80 | 0 |
| D | 0 | 80 | 0 |
| Quadrant | Total seconds | Saturated seconds | Saturation percentage |
|---|---|---|---|
| A | 4016 | 42 | 1.045817% |
| B | 4016 | 7 | 0.174303% |
| C | 4016 | 115 | 2.863546% |
| D | 4016 | 866 | 21.563745% |
Noise dominated data is calculated using 1-second bins in cleaned event files. If a bin has >2000 counts, and if more than 50% of those come from <1% of pixels, then it is considered to be noise-dominated and hence unusable.
| Quadrant | # 1 sec bins | Bins with >0 counts | Bins with >2000 counts | High rate bins dominated by noise | Noise dominated (total time) | Noise dominated (detector-on time) | Marked lightcurve |
|---|---|---|---|---|---|---|---|
| A | 4016 | 4016 | 32 | 32 | 0.80% | 0.80% | 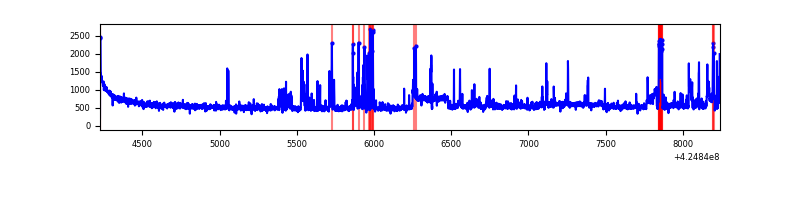 |
| B | 4016 | 4016 | 1 | 1 | 0.02% | 0.02% |  |
| C | 4015 | 4015 | 113 | 113 | 2.81% | 2.81% |  |
| D | 4015 | 4015 | 936 | 936 | 23.31% | 23.31% | 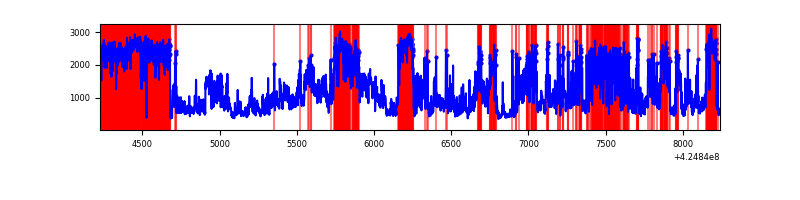 |
Top three noisy pixels from each quadrant. If the there are fewer than three noisy pixels in the level2.evt file, extra rows are filled as -1
| Pixel properties | Quadrant properties | ||||||
|---|---|---|---|---|---|---|---|
| Quadrant | DetID | PixID | Counts | Sigma | Mean | Median | Sigma |
| A | 10 | 83 | 348288 | 3727.3 | 449 | 440 | 93.3 |
| A | 6 | 10 | 188814 | 2018.49 | 449 | 440 | 93.3 |
| A | 13 | 248 | 146649 | 1566.67 | 449 | 440 | 93.3 |
| B | 0 | 245 | 20356 | 225.73 | 444 | 432 | 88.3 |
| B | 12 | 111 | 11055 | 120.35 | 444 | 432 | 88.3 |
| B | 11 | 111 | 10487 | 113.92 | 444 | 432 | 88.3 |
| C | 0 | 10 | 422546 | 4180.31 | 427 | 428 | 101.0 |
| C | 15 | 214 | 172776 | 1706.79 | 427 | 428 | 101.0 |
| C | 13 | 61 | 2811 | 23.6 | 427 | 428 | 101.0 |
| D | 12 | 79 | 2927044 | 28511.12 | 404 | 390 | 102.6 |
| D | 2 | 249 | 470594 | 4580.67 | 404 | 390 | 102.6 |
| D | 12 | 6 | 205310 | 1996.31 | 404 | 390 | 102.6 |
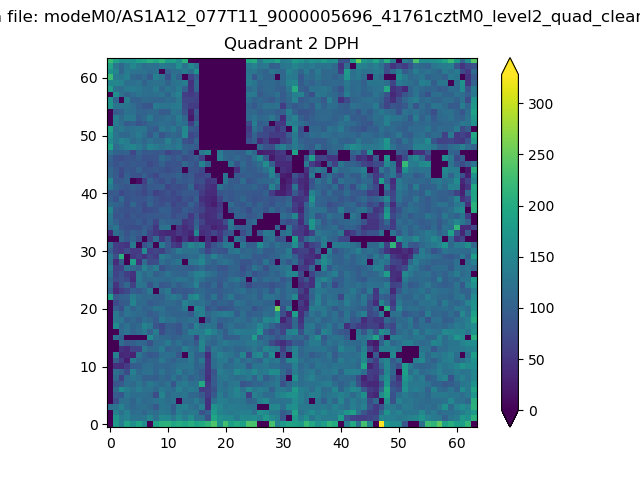
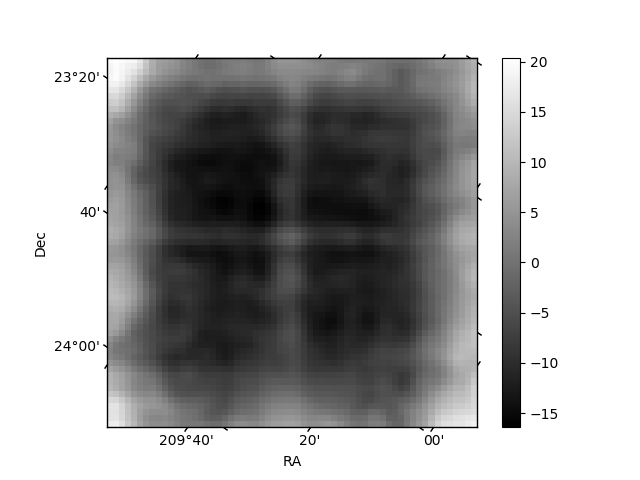
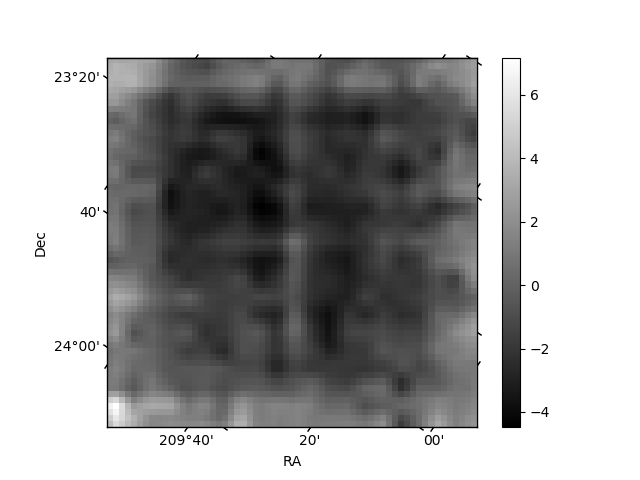
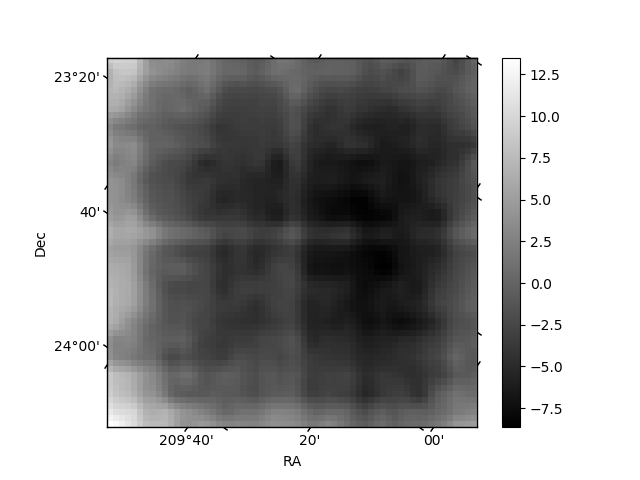
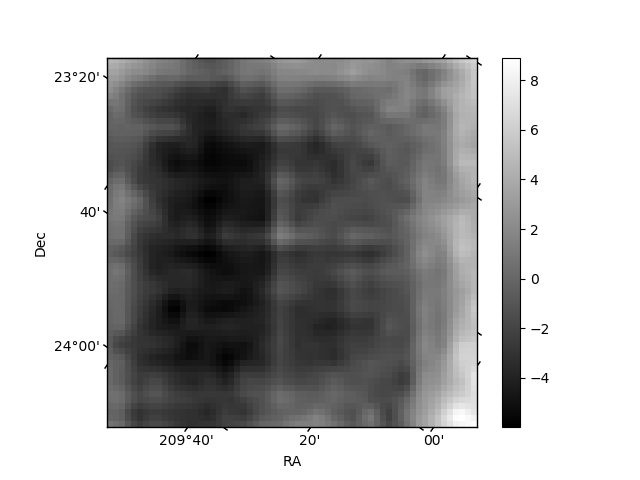
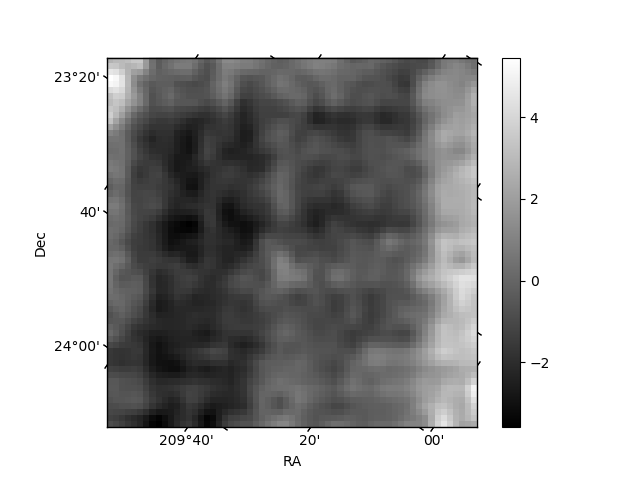
Histogram calculated using DETX and DETY for each event in the final _common_clean file
| Quadrant A | 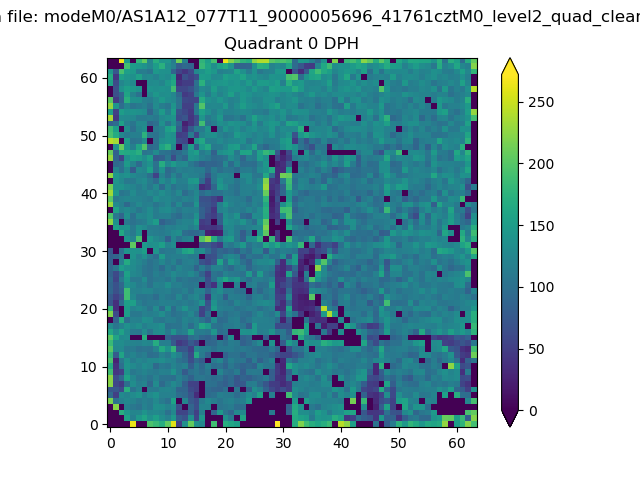 |
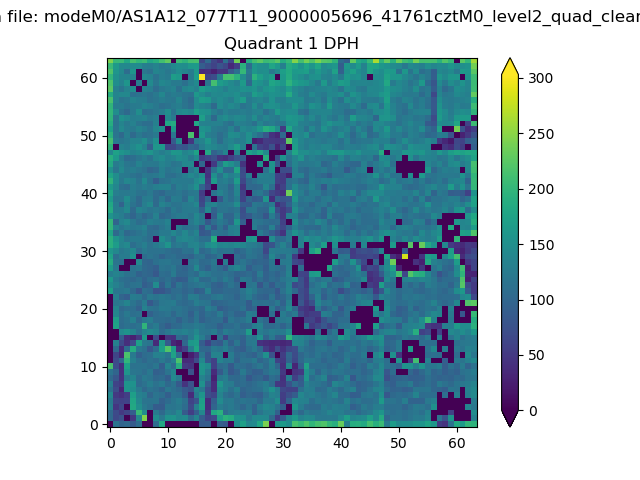 |
Quadrant B |
|---|---|---|---|
| Quadrant D | 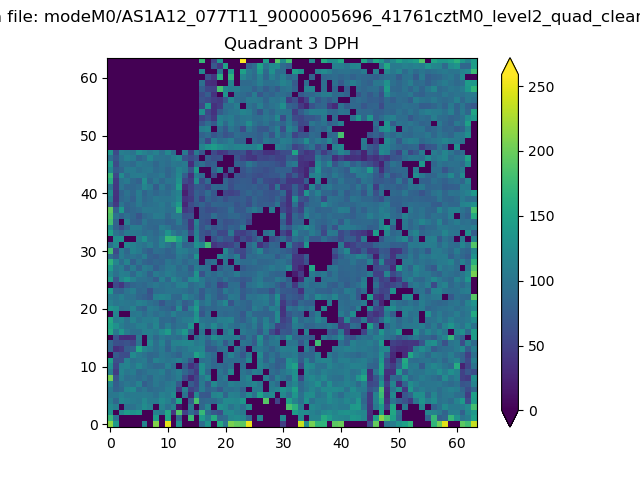 |
 |
Quadrant C |
| Plot type | Count rate plots | Images |
|---|---|---|
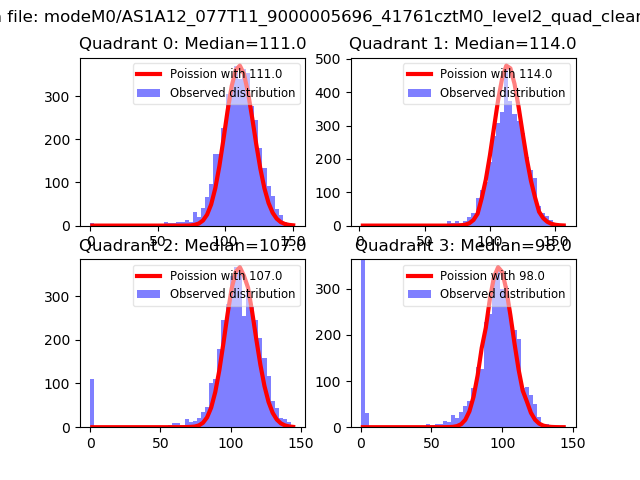
| Comparison with Poisson distribution Blue bars denote a histogram of data divided into 1 sec bins. Red curve is a Poisson curve with rate = median count rate of data. |
 |
 |
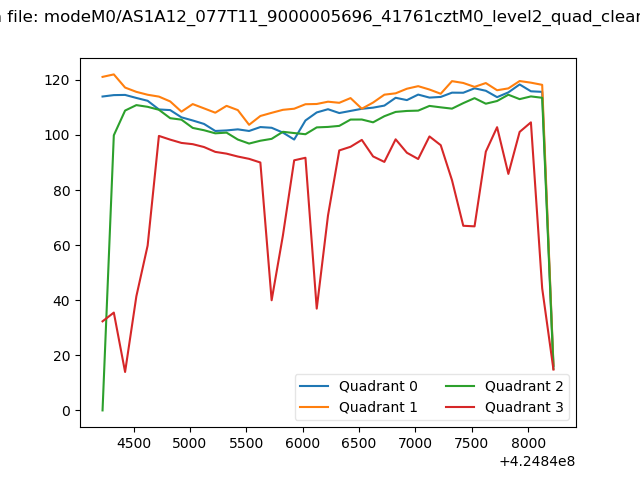
| Quadrant-wise count rates Data is divided into 100 sec bins |
 |
|
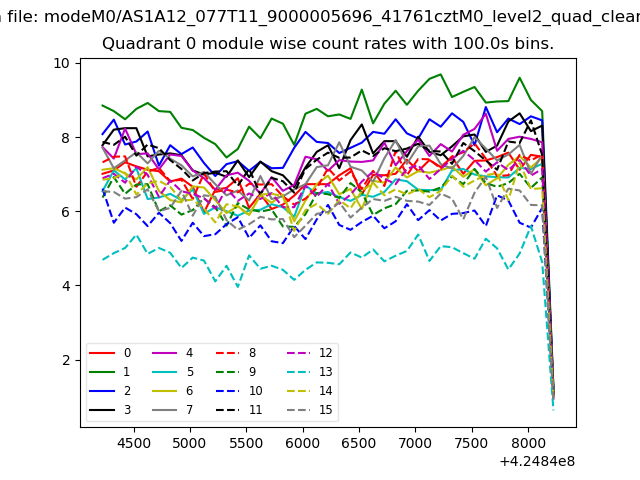
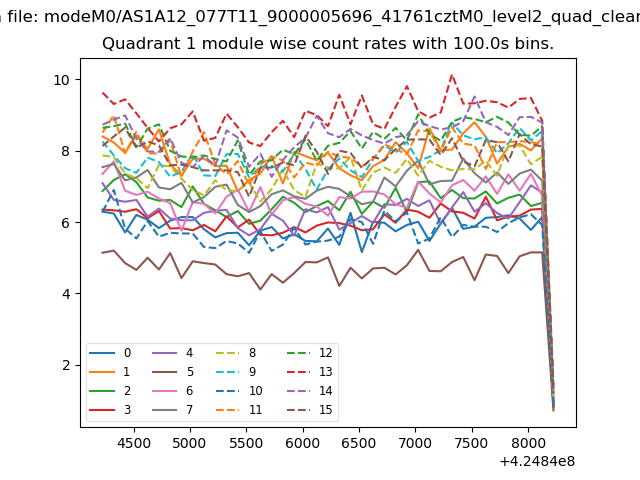
| Module-wise count rates for Quadrant A Data is divided into 100 sec bins |
 |
 |
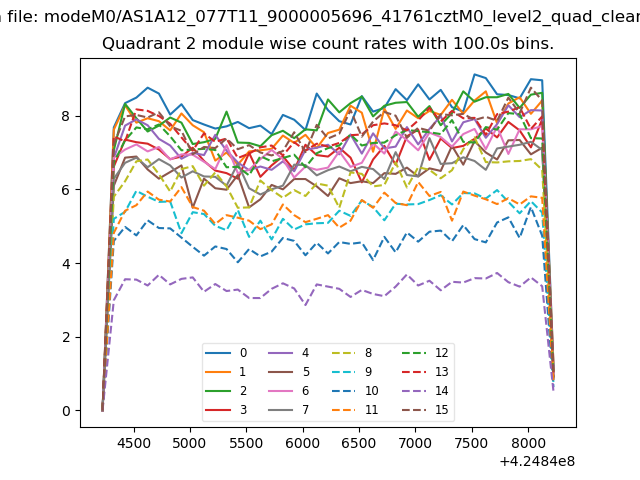
| Module-wise count rates for Quadrant B Data is divided into 100 sec bins |
 |
 |
| Module-wise count rates for Quadrant C Data is divided into 100 sec bins |
 |
 |
| Module-wise count rates for Quadrant D Data is divided into 100 sec bins |
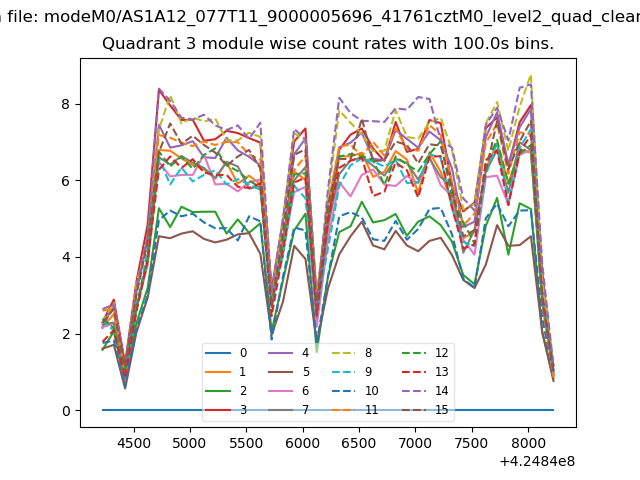 |
 |
| Parameter | Plot |
|---|---|
| CZT HV Monitor | 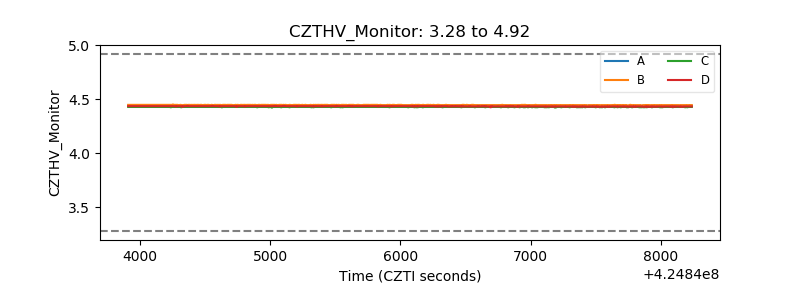 |
| D_VDD | 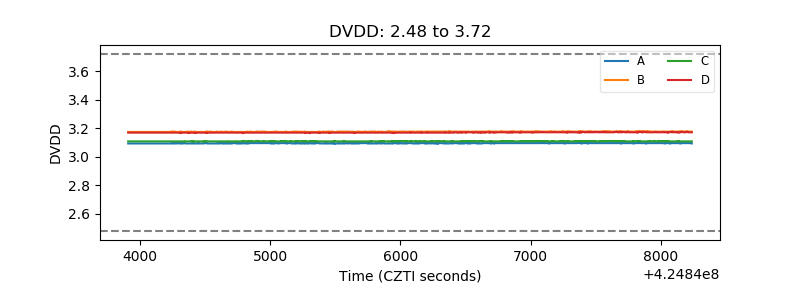 |
| Temperature 1 | 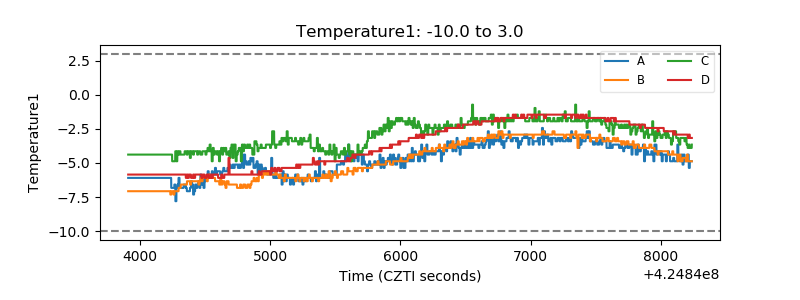 |
| Veto HV Monitor | 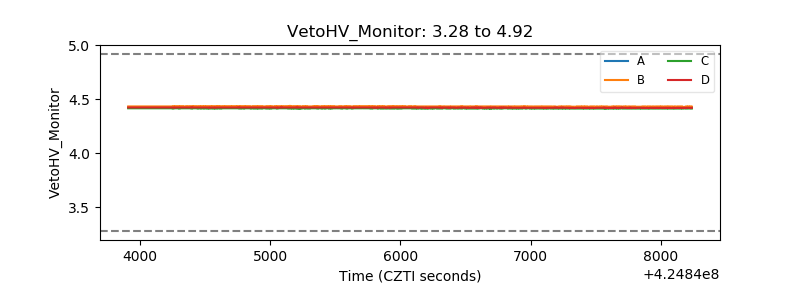 |
| Veto LLD | 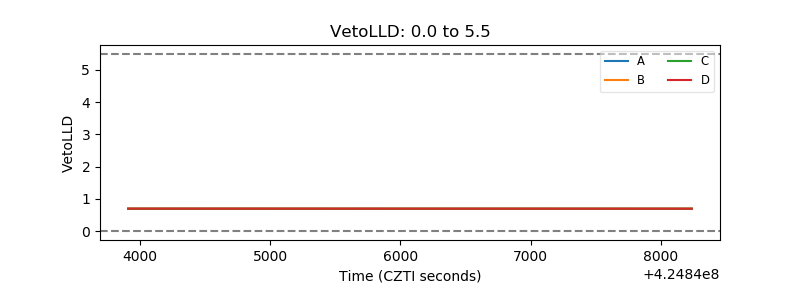 |
| Alpha Counter | 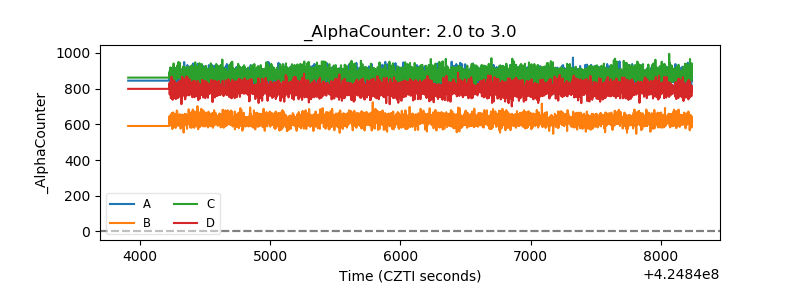 |
| _CPM_Rate | 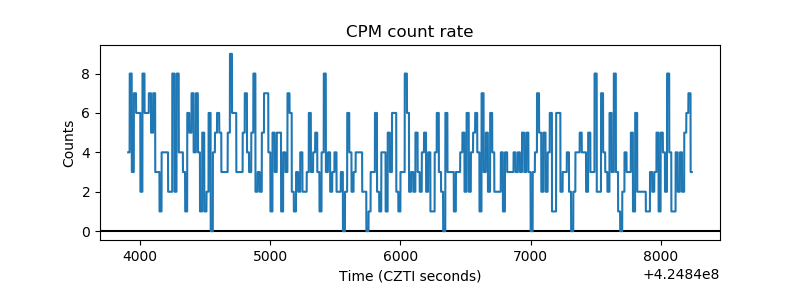 |
| CZT Counter | 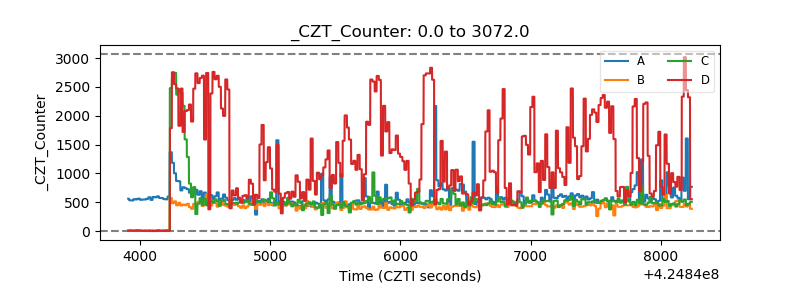 |
| +2.5 Volts monitor |  |
| +5 Volts monitor | 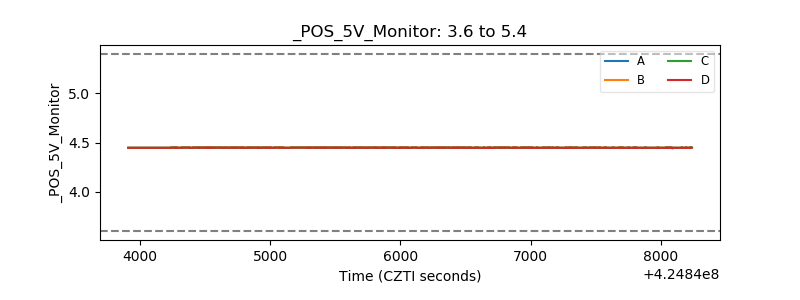 |
| _ROLL_ROT | 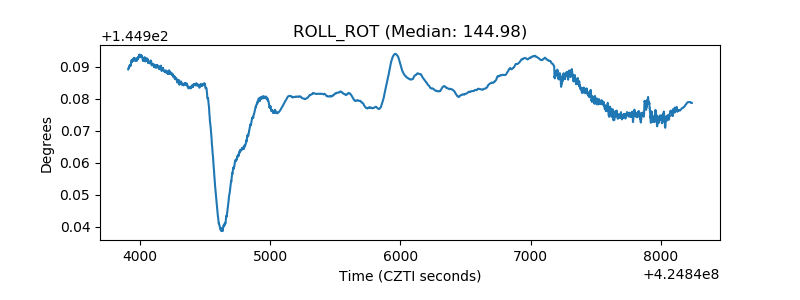 |
| _Roll_DEC | 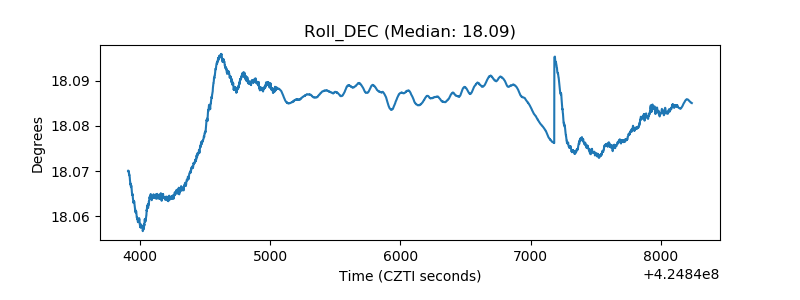 |
| _Roll_RA | 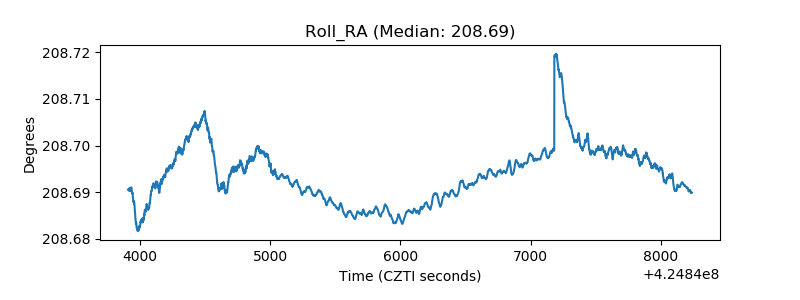 |
| Veto Counter | 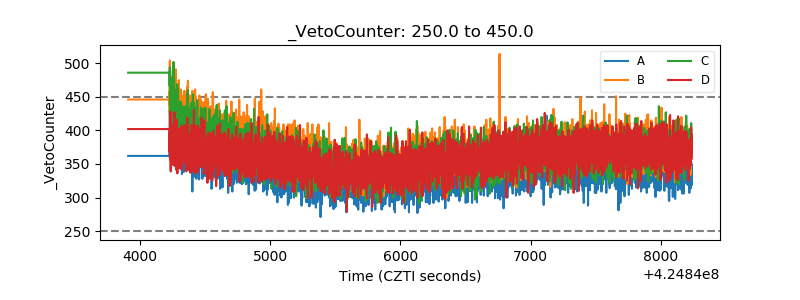 |