| Param | Original file | Final file |
|---|---|---|
| Filename | modeM0/AS1A12_044T19_9000005698_41761cztM0_level2.fits | modeM0/AS1A12_044T19_9000005698_41761cztM0_level2_quad_clean.evt |
| Size (bytes) | 87,577,920 | 15,923,520 |
| Size | 83.5 MB | 15.2 MB |
| Events in quadrant A | 878,363 | 107,760 |
| Events in quadrant B | 560,082 | 118,686 |
| Events in quadrant C | 809,936 | 92,986 |
| Events in quadrant D | 917,367 | 89,943 |
| Mode SS | |||
|---|---|---|---|
| Quadrant | BADHDUFLAG | Total packets | Discarded packets |
| A | 0 | 20 | 0 |
| B | 0 | 20 | 0 |
| C | 0 | 20 | 0 |
| D | 0 | 20 | 0 |
| Mode M0 | |||
|---|---|---|---|
| Quadrant | BADHDUFLAG | Total packets | Discarded packets |
| A | 0 | 3277 | 1 |
| B | 0 | 2225 | 1 |
| C | 0 | 2930 | 1 |
| D | 0 | 3332 | 1 |
| Mode M9 | |||
|---|---|---|---|
| Quadrant | BADHDUFLAG | Total packets | Discarded packets |
| A | 0 | 15 | 0 |
| B | 0 | 15 | 0 |
| C | 0 | 15 | 0 |
| D | 0 | 15 | 0 |
| Quadrant | Total seconds | Saturated seconds | Saturation percentage |
|---|---|---|---|
| A | 941 | 95 | 10.095643% |
| B | 941 | 17 | 1.806589% |
| C | 940 | 137 | 14.574468% |
| D | 940 | 150 | 15.957447% |
Noise dominated data is calculated using 1-second bins in cleaned event files. If a bin has >2000 counts, and if more than 50% of those come from <1% of pixels, then it is considered to be noise-dominated and hence unusable.
| Quadrant | # 1 sec bins | Bins with >0 counts | Bins with >2000 counts | High rate bins dominated by noise | Noise dominated (total time) | Noise dominated (detector-on time) | Marked lightcurve |
|---|---|---|---|---|---|---|---|
| A | 941 | 941 | 66 | 66 | 7.01% | 7.01% | 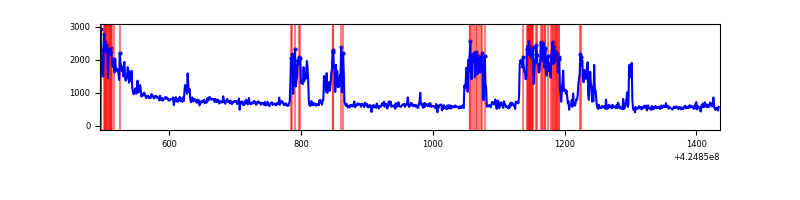 |
| B | 940 | 940 | 4 | 4 | 0.43% | 0.43% | 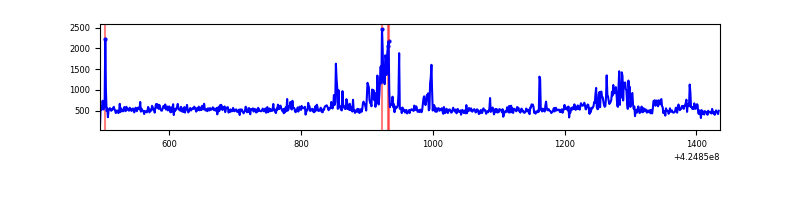 |
| C | 940 | 940 | 126 | 126 | 13.40% | 13.40% | 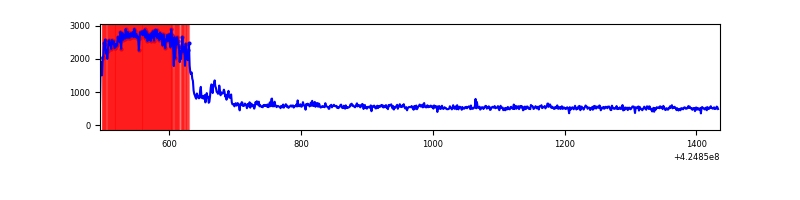 |
| D | 939 | 939 | 120 | 120 | 12.78% | 12.78% | 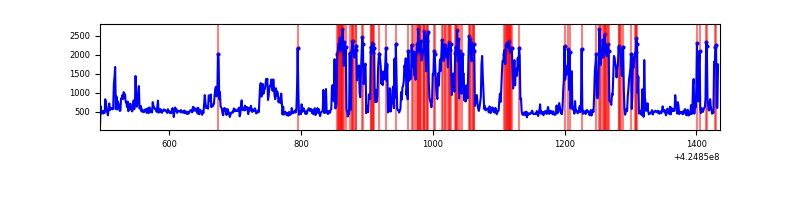 |
Top three noisy pixels from each quadrant. If the there are fewer than three noisy pixels in the level2.evt file, extra rows are filled as -1
| Pixel properties | Quadrant properties | ||||||
|---|---|---|---|---|---|---|---|
| Quadrant | DetID | PixID | Counts | Sigma | Mean | Median | Sigma |
| A | 6 | 10 | 200463 | 7945.36 | 115 | 112 | 25.2 |
| A | 10 | 83 | 143741 | 5695.93 | 115 | 112 | 25.2 |
| A | 7 | 16 | 62307 | 2466.48 | 115 | 112 | 25.2 |
| B | 5 | 255 | 57323 | 2359.04 | 115 | 112 | 24.3 |
| B | 0 | 183 | 22557 | 925.5 | 115 | 112 | 24.3 |
| B | 0 | 245 | 14052 | 574.8 | 115 | 112 | 24.3 |
| C | 0 | 10 | 372429 | 14752.04 | 100 | 100 | 25.2 |
| C | 15 | 214 | 42417 | 1676.64 | 100 | 100 | 25.2 |
| C | 0 | 207 | 897 | 31.58 | 100 | 100 | 25.2 |
| D | 2 | 120 | 284236 | 10097.97 | 108 | 104 | 28.1 |
| D | 12 | 6 | 193051 | 6857.28 | 108 | 104 | 28.1 |
| D | 2 | 249 | 22831 | 807.71 | 108 | 104 | 28.1 |
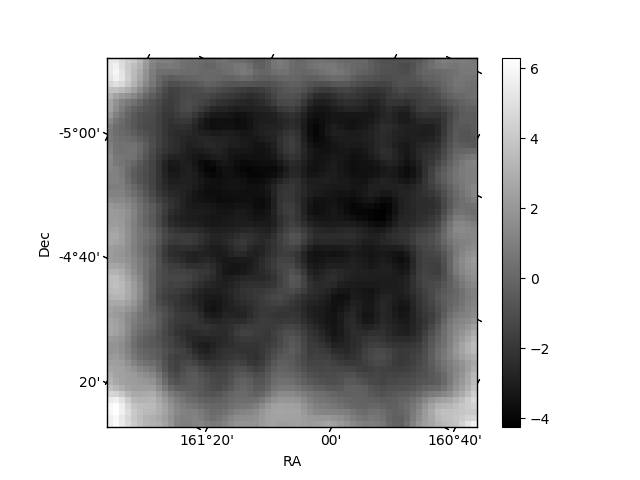
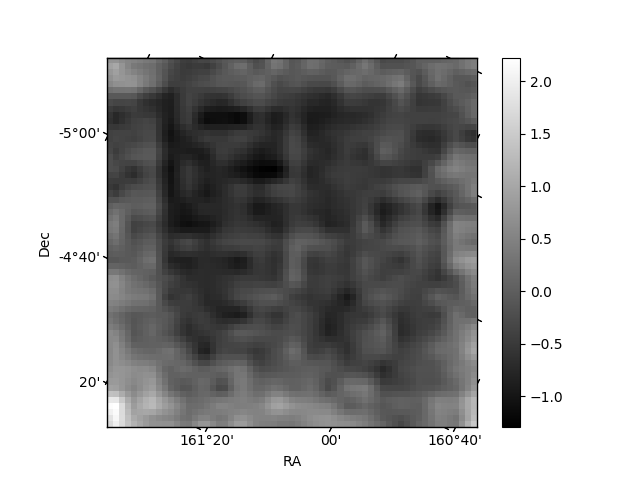
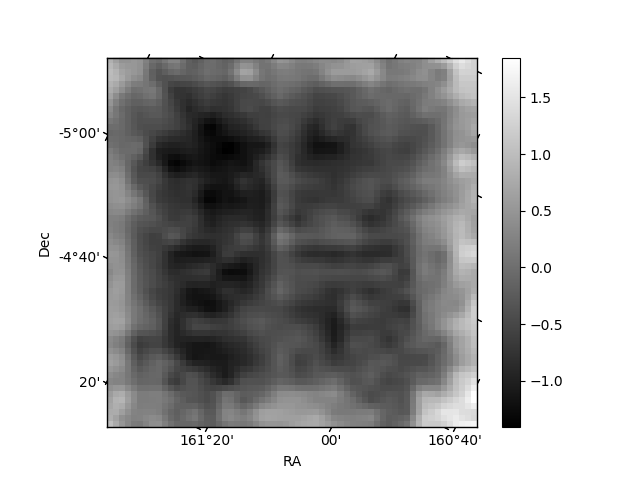
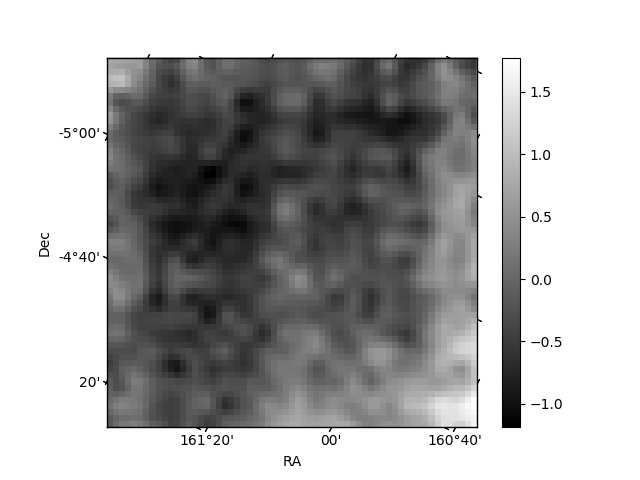
Histogram calculated using DETX and DETY for each event in the final _common_clean file
| Quadrant A | 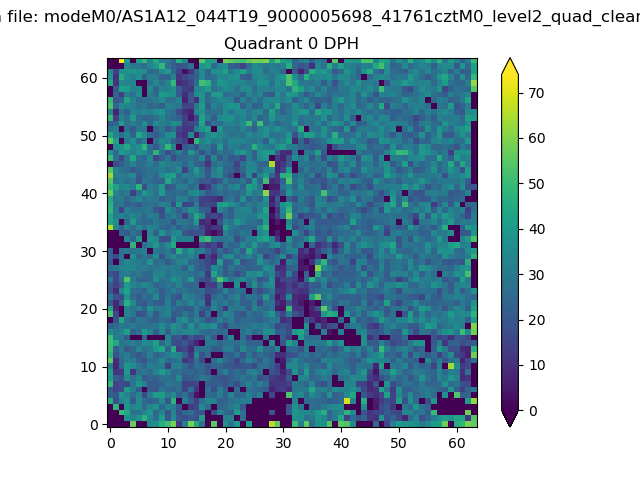 |
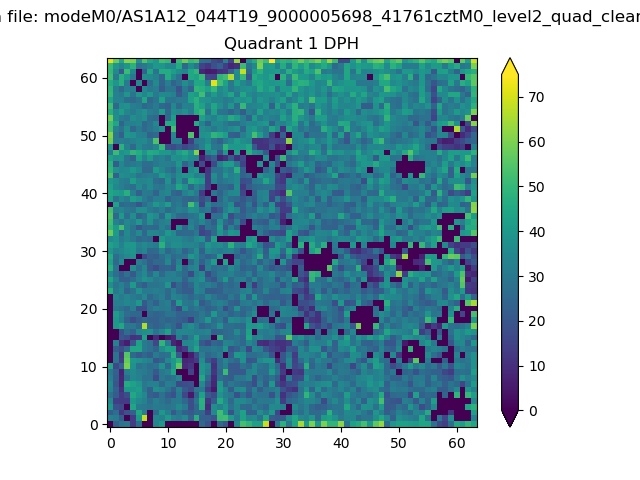 |
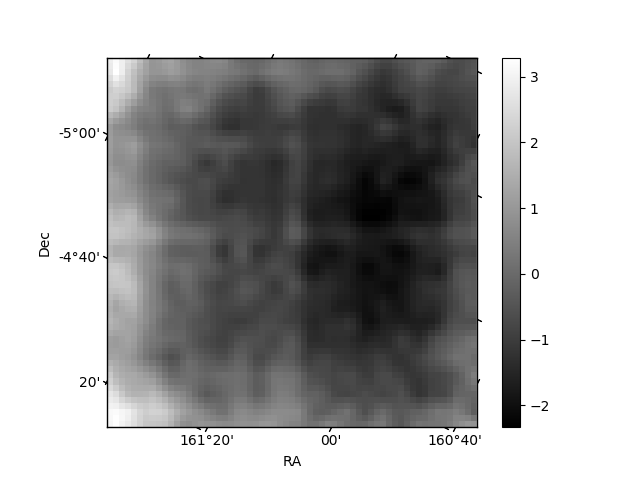
Quadrant B |
|---|---|---|---|
| Quadrant D | 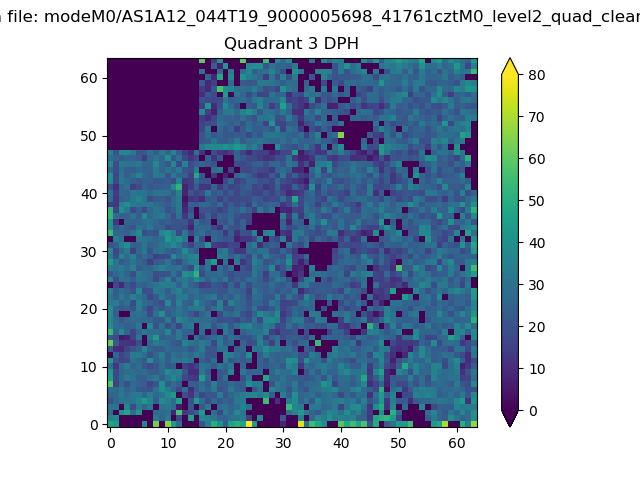 |
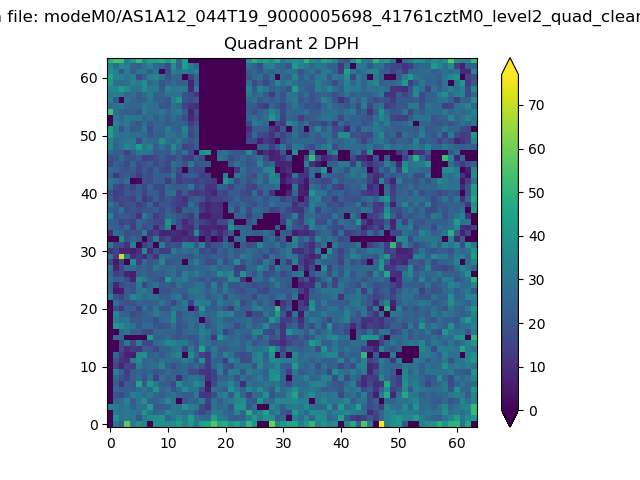 |
Quadrant C |
| Plot type | Count rate plots | Images |
|---|---|---|
| Comparison with Poisson distribution Blue bars denote a histogram of data divided into 1 sec bins. Red curve is a Poisson curve with rate = median count rate of data. |
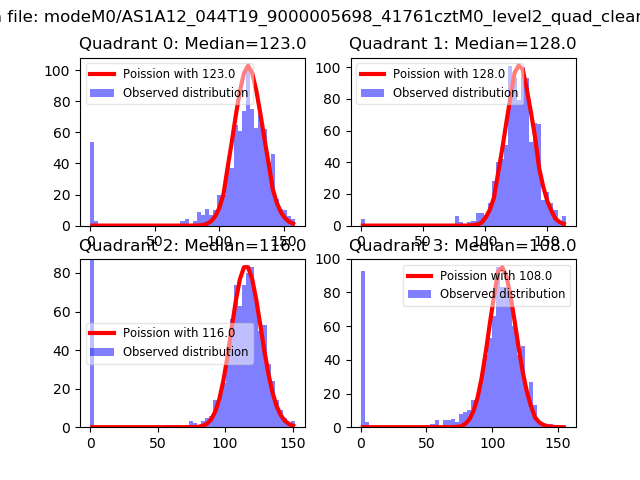 |
 |
| Quadrant-wise count rates Data is divided into 100 sec bins |
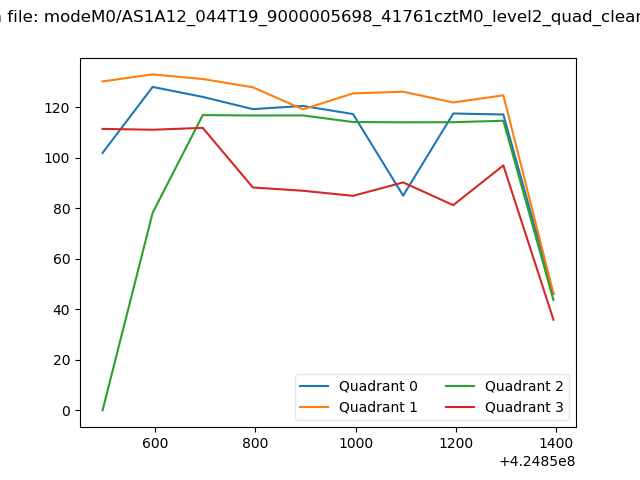 |
|
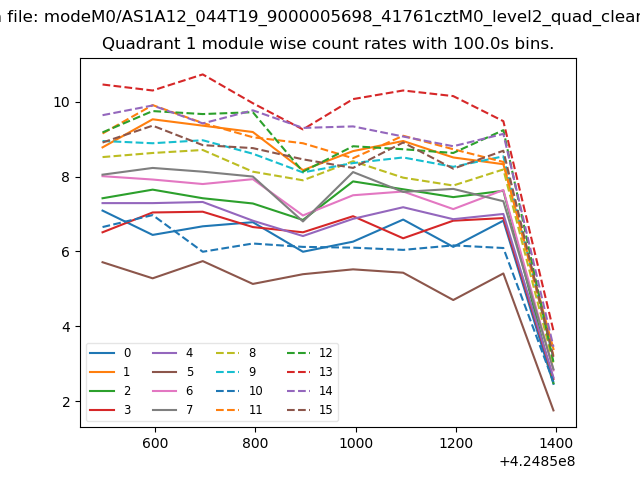
| Module-wise count rates for Quadrant A Data is divided into 100 sec bins |
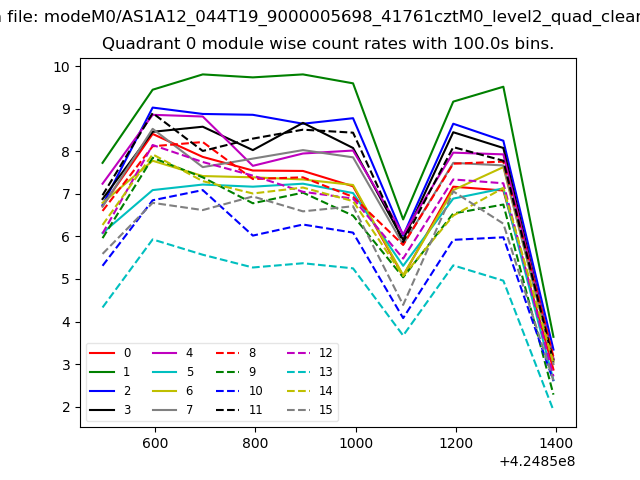 |
 |
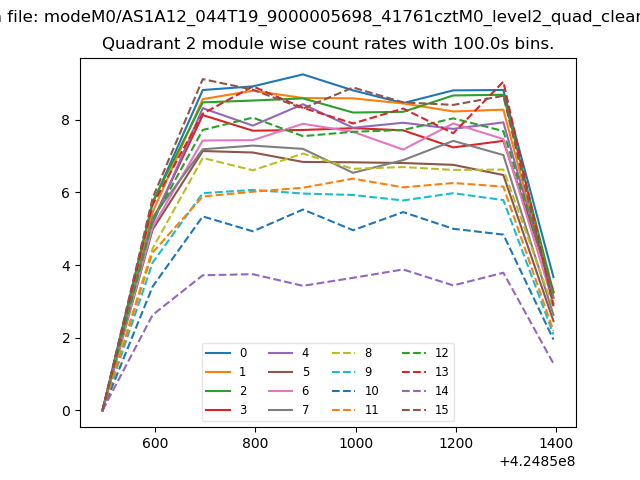
| Module-wise count rates for Quadrant B Data is divided into 100 sec bins |
 |
 |
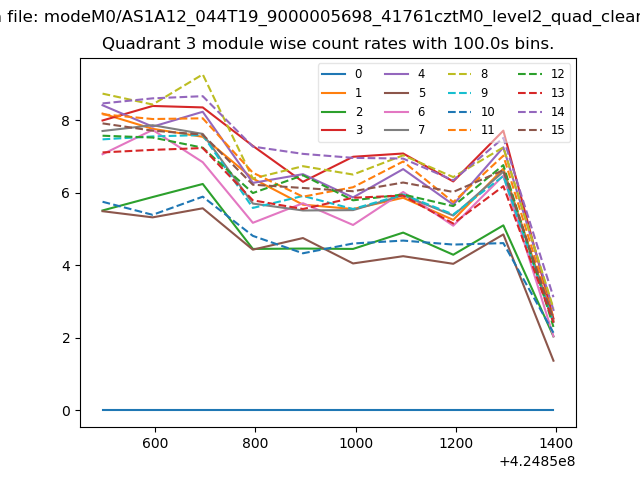
| Module-wise count rates for Quadrant C Data is divided into 100 sec bins |
 |
 |
| Module-wise count rates for Quadrant D Data is divided into 100 sec bins |
 |
 |
| Parameter | Plot |
|---|---|
| CZT HV Monitor |  |
| D_VDD | 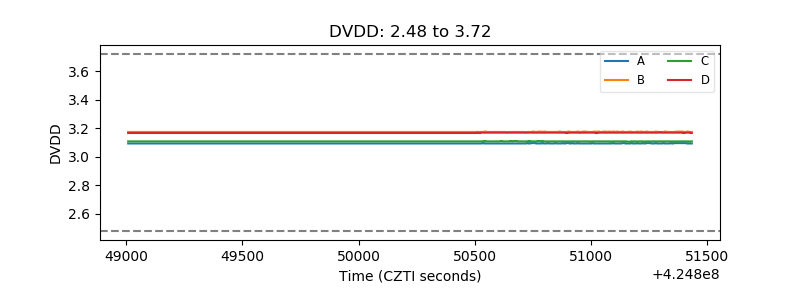 |
| Temperature 1 | 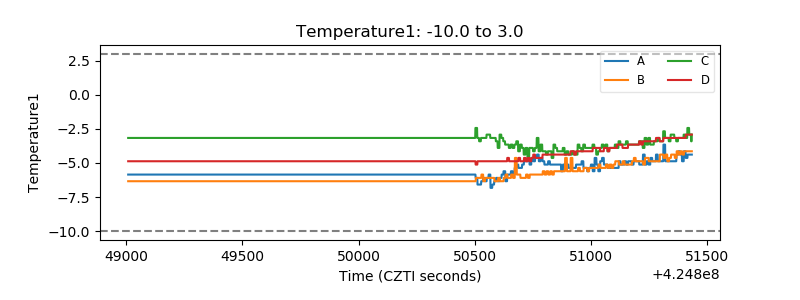 |
| Veto HV Monitor | 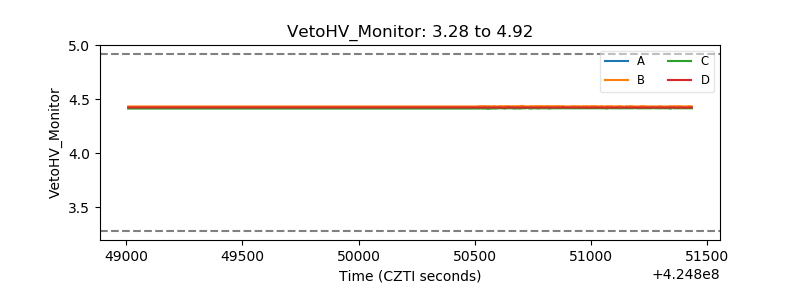 |
| Veto LLD | 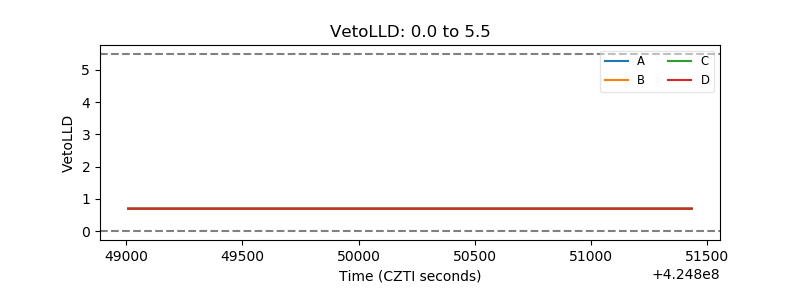 |
| Alpha Counter | 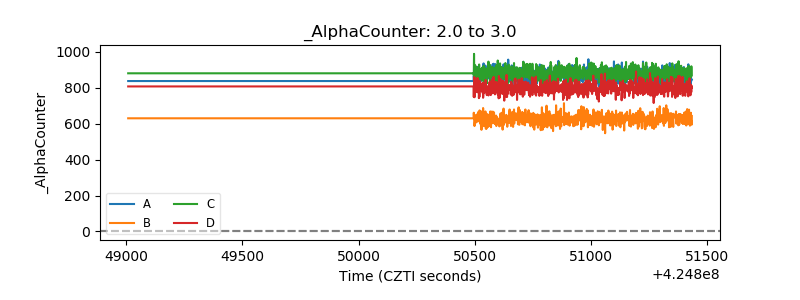 |
| _CPM_Rate | 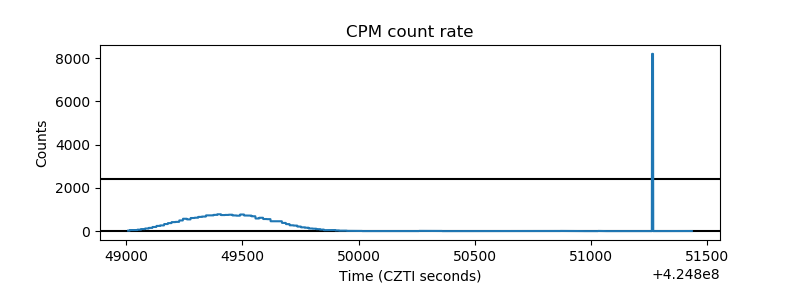 |
| CZT Counter | 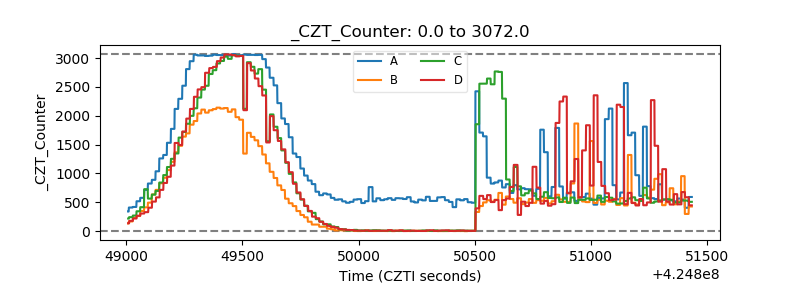 |
| +2.5 Volts monitor | 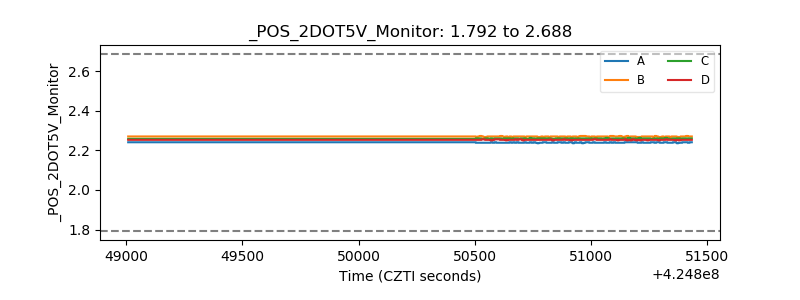 |
| +5 Volts monitor | 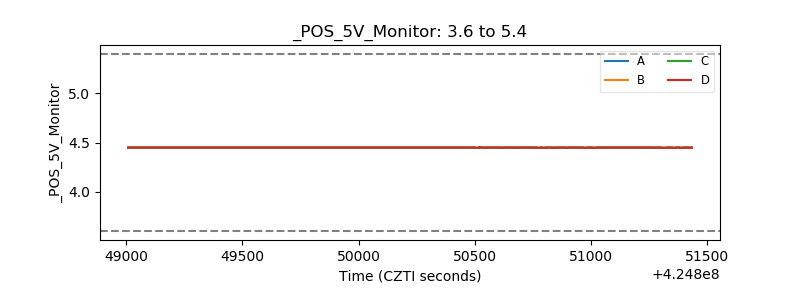 |
| _ROLL_ROT | 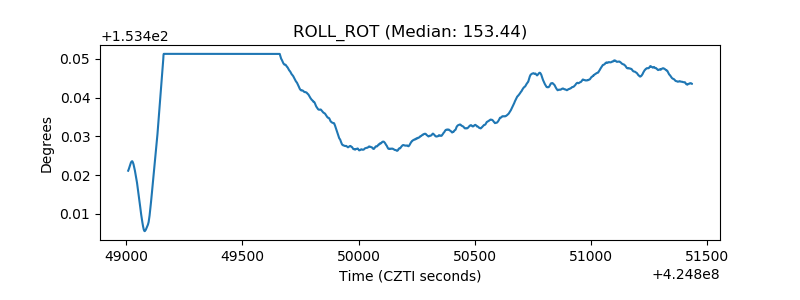 |
| _Roll_DEC | 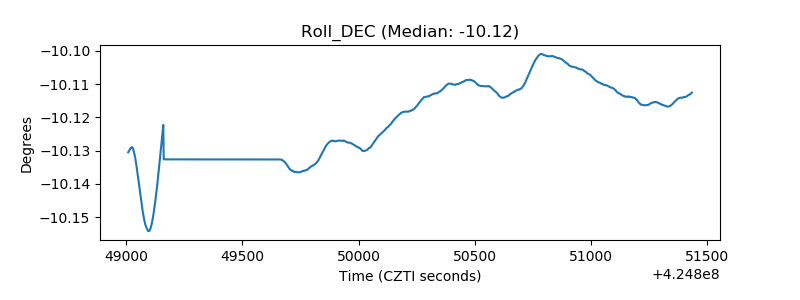 |
| _Roll_RA | 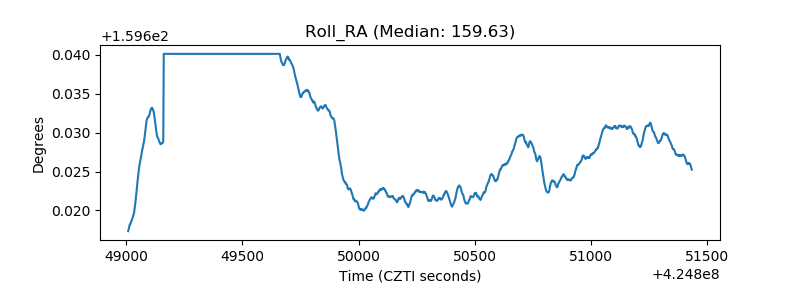 |
| Veto Counter | 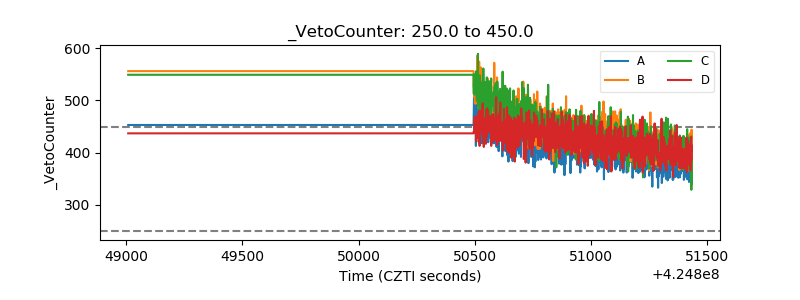 |