| Param | Original file | Final file |
|---|---|---|
| Filename | modeM0/AS1A12_044T19_9000005698_41762cztM0_level2.fits | modeM0/AS1A12_044T19_9000005698_41762cztM0_level2_quad_clean.evt |
| Size (bytes) | 370,091,520 | 89,876,160 |
| Size | 352.9 MB | 85.7 MB |
| Events in quadrant A | 3,310,025 | 617,778 |
| Events in quadrant B | 2,731,703 | 637,683 |
| Events in quadrant C | 3,210,975 | 570,105 |
| Events in quadrant D | 4,036,915 | 527,042 |
| Mode SS | |||
|---|---|---|---|
| Quadrant | BADHDUFLAG | Total packets | Discarded packets |
| A | 0 | 108 | 0 |
| B | 0 | 108 | 0 |
| C | 0 | 108 | 0 |
| D | 0 | 108 | 0 |
| Mode M0 | |||
|---|---|---|---|
| Quadrant | BADHDUFLAG | Total packets | Discarded packets |
| A | 0 | 13022 | 2 |
| B | 0 | 11463 | 2 |
| C | 0 | 12667 | 2 |
| D | 0 | 15478 | 5 |
| Mode M9 | |||
|---|---|---|---|
| Quadrant | BADHDUFLAG | Total packets | Discarded packets |
| A | 0 | 26 | 0 |
| B | 0 | 27 | 0 |
| C | 0 | 27 | 0 |
| D | 0 | 27 | 0 |
| Quadrant | Total seconds | Saturated seconds | Saturation percentage |
|---|---|---|---|
| A | 5267 | 111 | 2.107462% |
| B | 5267 | 43 | 0.816404% |
| C | 5267 | 261 | 4.955383% |
| D | 5266 | 385 | 7.311052% |
Noise dominated data is calculated using 1-second bins in cleaned event files. If a bin has >2000 counts, and if more than 50% of those come from <1% of pixels, then it is considered to be noise-dominated and hence unusable.
| Quadrant | # 1 sec bins | Bins with >0 counts | Bins with >2000 counts | High rate bins dominated by noise | Noise dominated (total time) | Noise dominated (detector-on time) | Marked lightcurve |
|---|---|---|---|---|---|---|---|
| A | 7120 | 5268 | 71 | 71 | 1.00% | 1.35% | 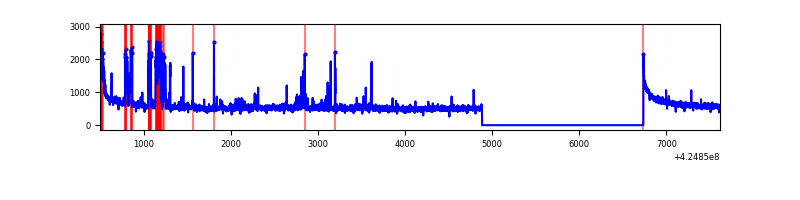 |
| B | 7119 | 5267 | 17 | 17 | 0.24% | 0.32% | 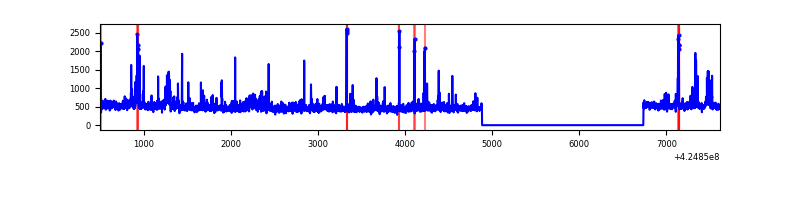 |
| C | 7120 | 5267 | 247 | 247 | 3.47% | 4.69% | 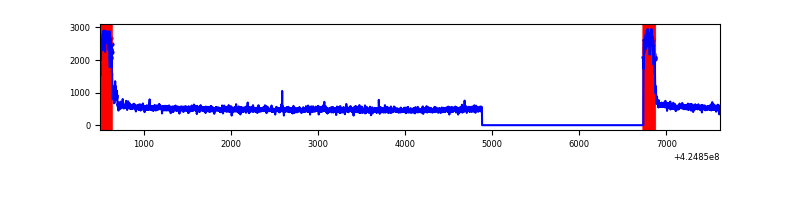 |
| D | 7118 | 5265 | 328 | 328 | 4.61% | 6.23% | 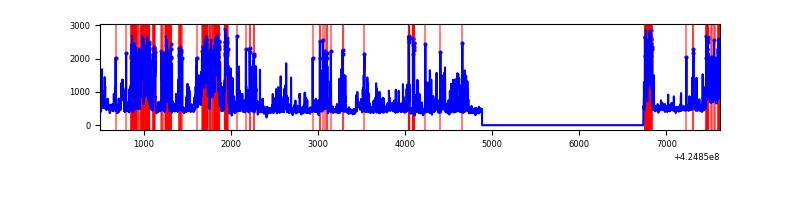 |
Top three noisy pixels from each quadrant. If the there are fewer than three noisy pixels in the level2.evt file, extra rows are filled as -1
| Pixel properties | Quadrant properties | ||||||
|---|---|---|---|---|---|---|---|
| Quadrant | DetID | PixID | Counts | Sigma | Mean | Median | Sigma |
| A | 10 | 83 | 522970 | 4159.63 | 615 | 604 | 125.6 |
| A | 6 | 10 | 211114 | 1676.3 | 615 | 604 | 125.6 |
| A | 2 | 79 | 116733 | 924.74 | 615 | 604 | 125.6 |
| B | 5 | 255 | 151341 | 1283.75 | 604 | 588 | 117.4 |
| B | 3 | 112 | 77609 | 655.88 | 604 | 588 | 117.4 |
| B | 0 | 245 | 61248 | 516.55 | 604 | 588 | 117.4 |
| C | 0 | 10 | 752923 | 5643.12 | 569 | 573 | 133.3 |
| C | 15 | 214 | 224477 | 1679.43 | 569 | 573 | 133.3 |
| C | 14 | 67 | 13547 | 97.31 | 569 | 573 | 133.3 |
| D | 2 | 120 | 647642 | 4458.5 | 584 | 566 | 145.1 |
| D | 2 | 249 | 586176 | 4034.99 | 584 | 566 | 145.1 |
| D | 12 | 6 | 343243 | 2361.12 | 584 | 566 | 145.1 |
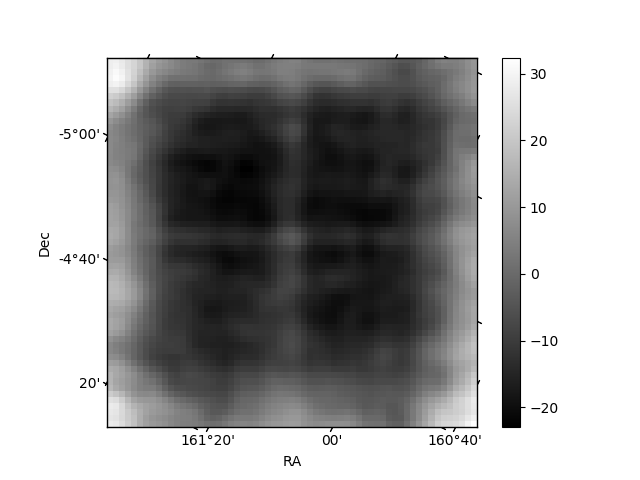
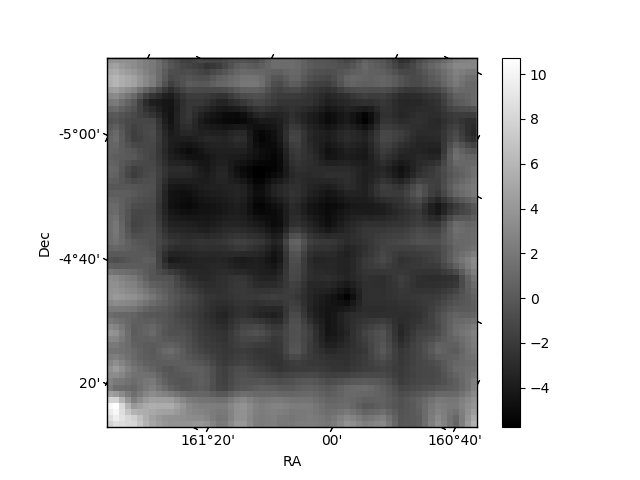
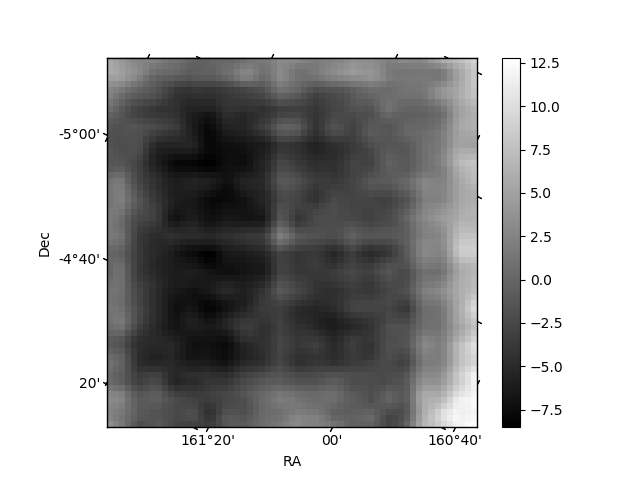
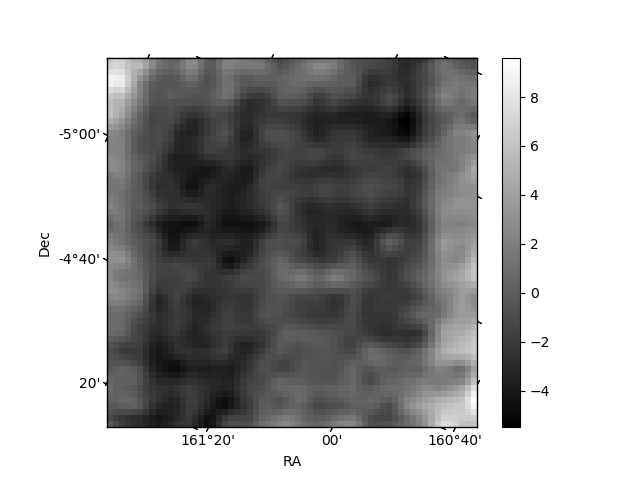
Histogram calculated using DETX and DETY for each event in the final _common_clean file
| Quadrant A | 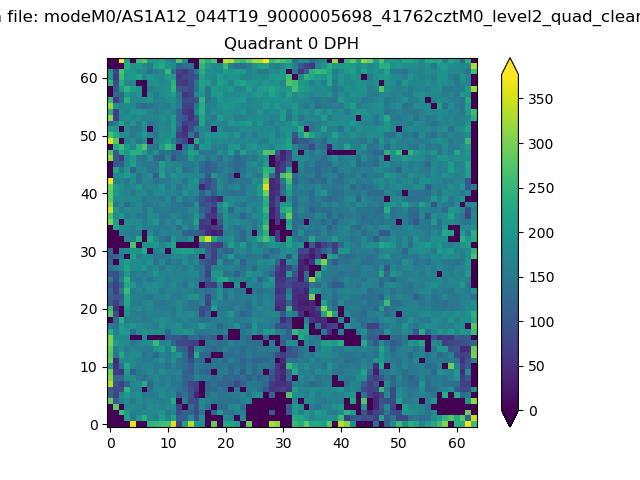 |
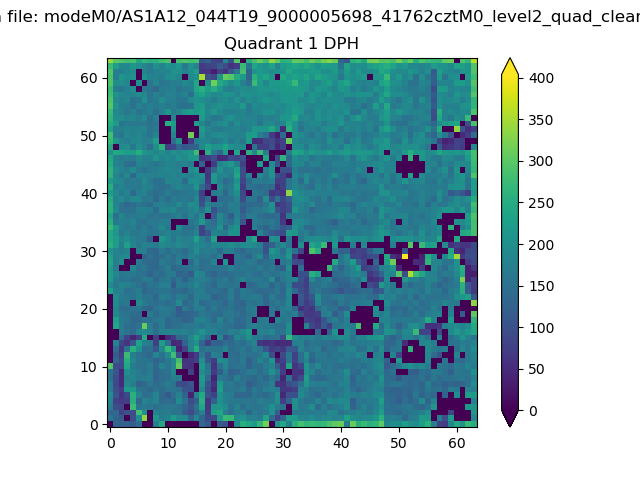 |
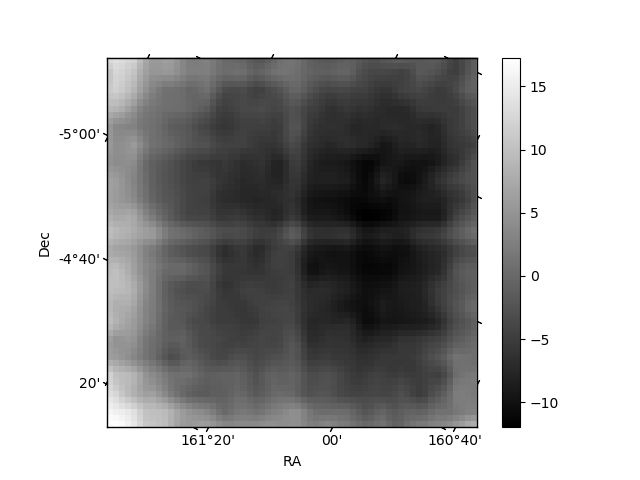
Quadrant B |
|---|---|---|---|
| Quadrant D | 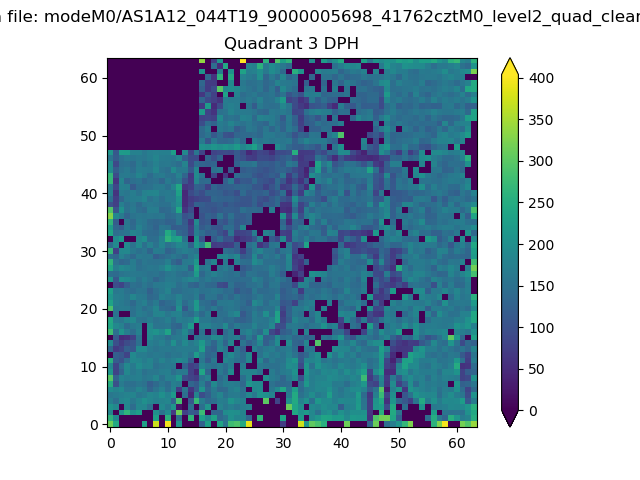 |
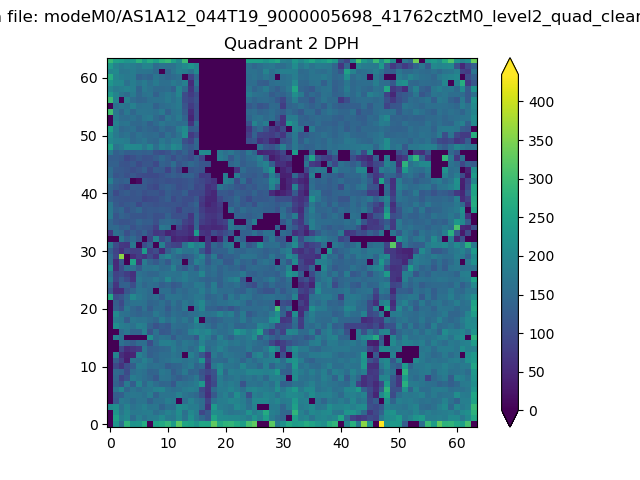 |
Quadrant C |
| Plot type | Count rate plots | Images |
|---|---|---|
| Comparison with Poisson distribution Blue bars denote a histogram of data divided into 1 sec bins. Red curve is a Poisson curve with rate = median count rate of data. |
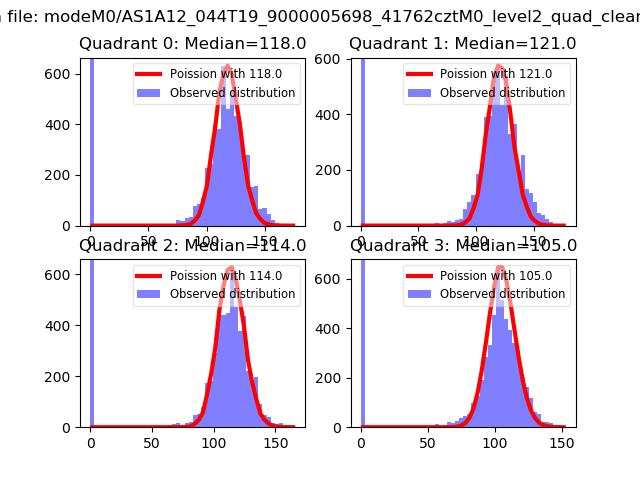 |
 |
| Quadrant-wise count rates Data is divided into 100 sec bins |
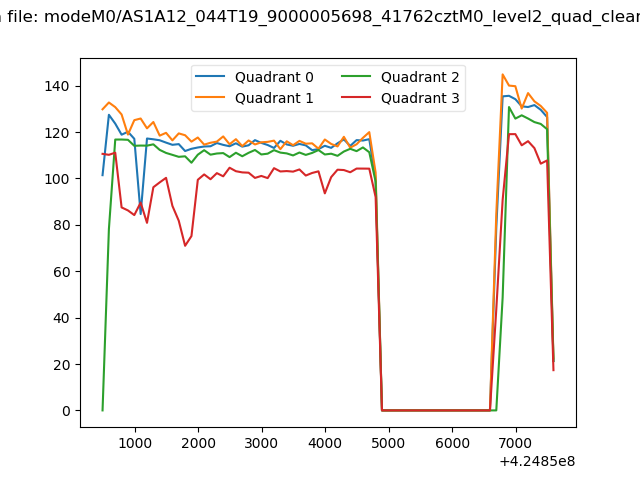 |
|
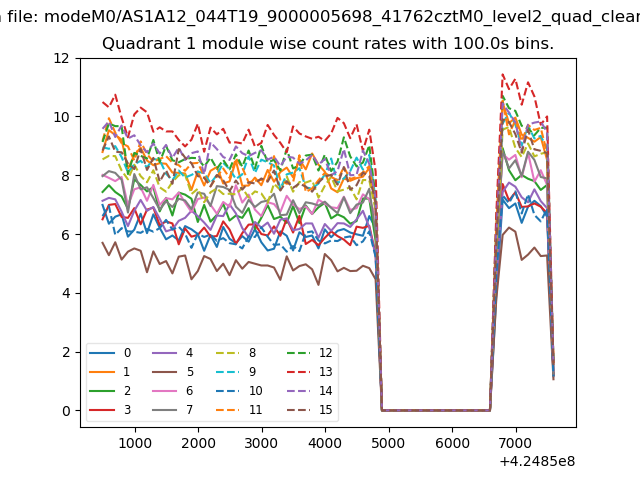
| Module-wise count rates for Quadrant A Data is divided into 100 sec bins |
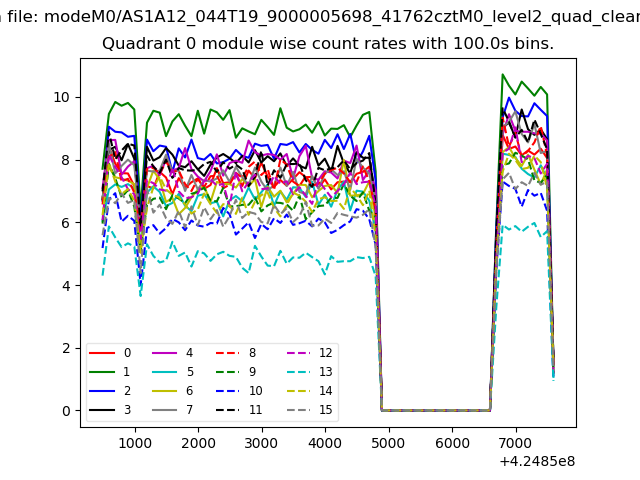 |
 |
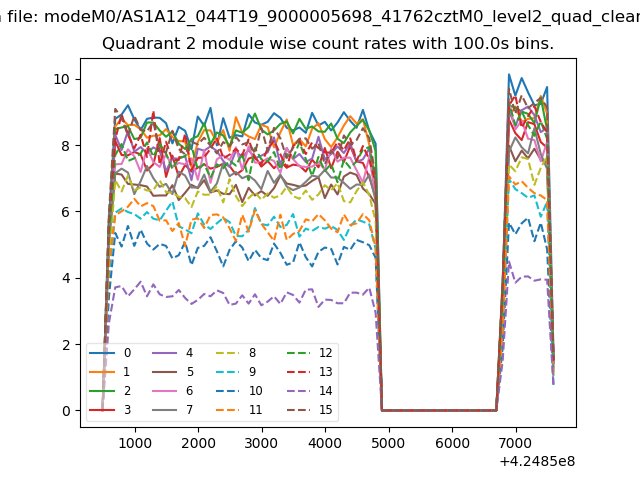
| Module-wise count rates for Quadrant B Data is divided into 100 sec bins |
 |
 |
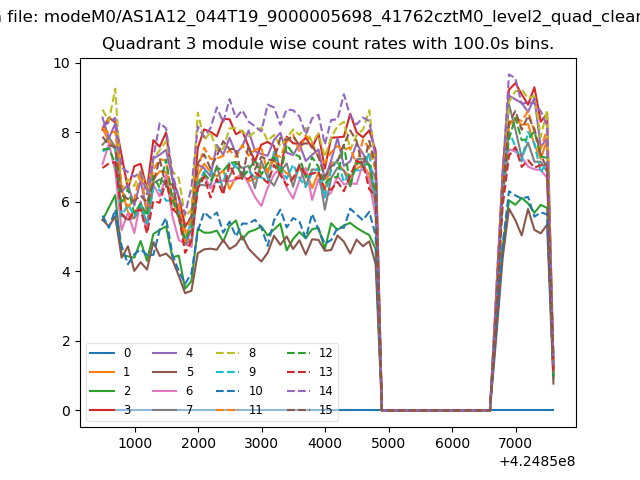
| Module-wise count rates for Quadrant C Data is divided into 100 sec bins |
 |
 |
| Module-wise count rates for Quadrant D Data is divided into 100 sec bins |
 |
 |
| Parameter | Plot |
|---|---|
| CZT HV Monitor | 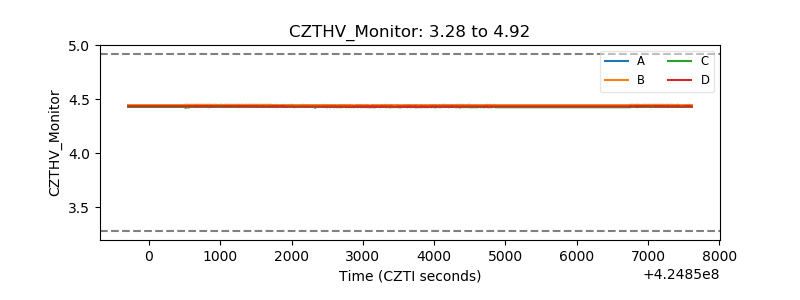 |
| D_VDD | 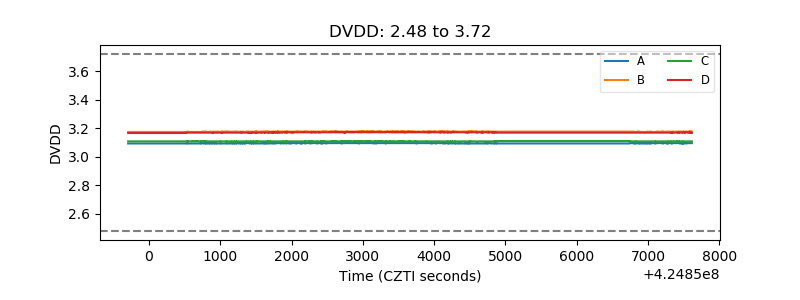 |
| Temperature 1 | 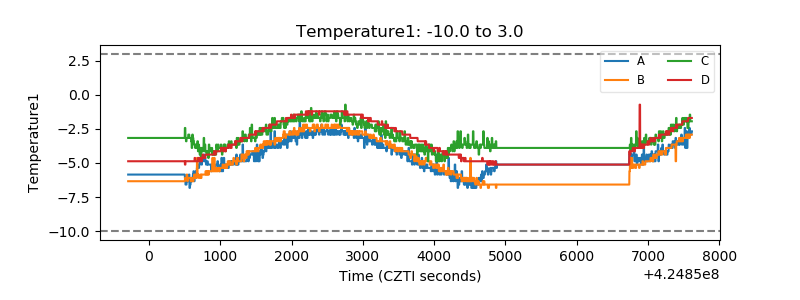 |
| Veto HV Monitor | 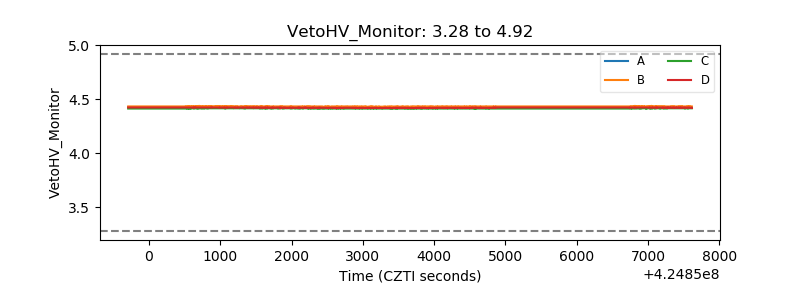 |
| Veto LLD | 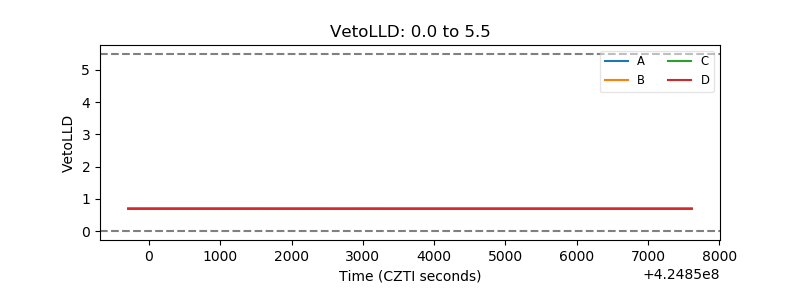 |
| Alpha Counter | 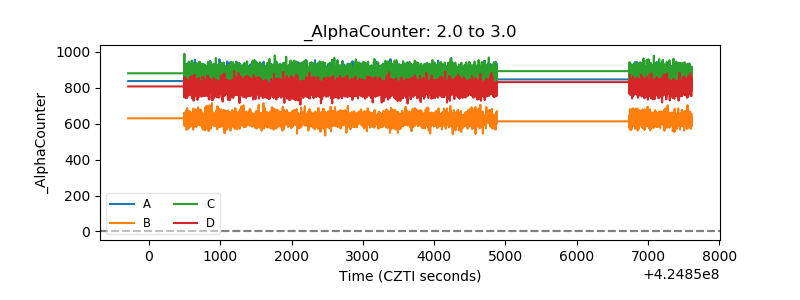 |
| _CPM_Rate | 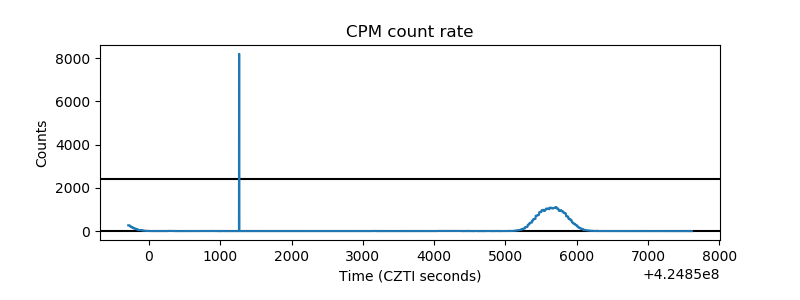 |
| CZT Counter | 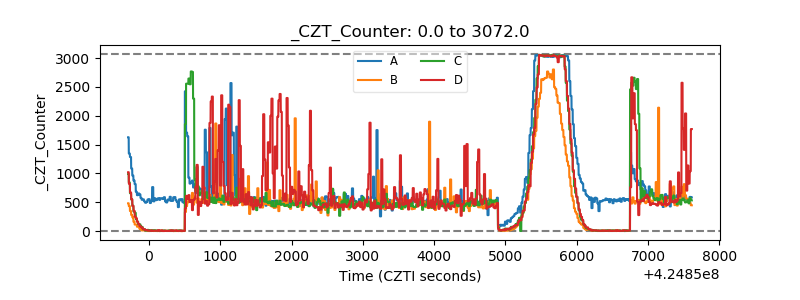 |
| +2.5 Volts monitor | 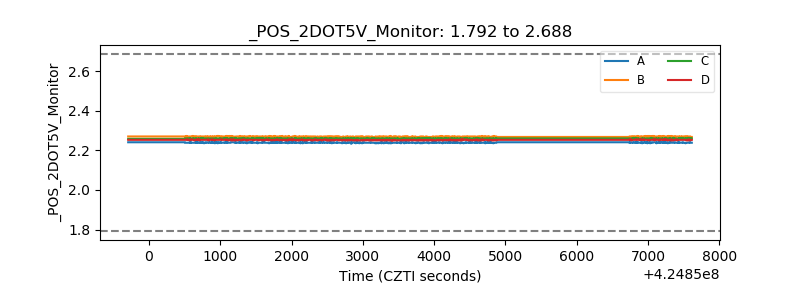 |
| +5 Volts monitor | 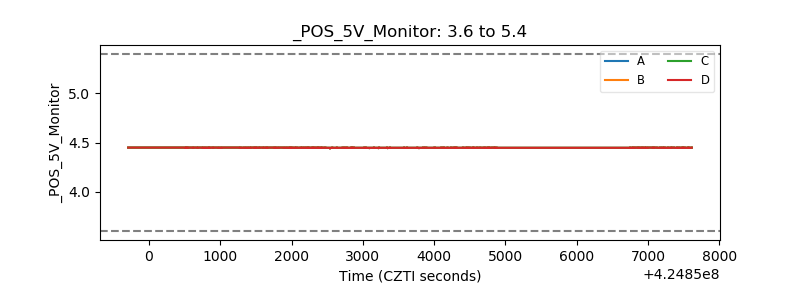 |
| _ROLL_ROT | 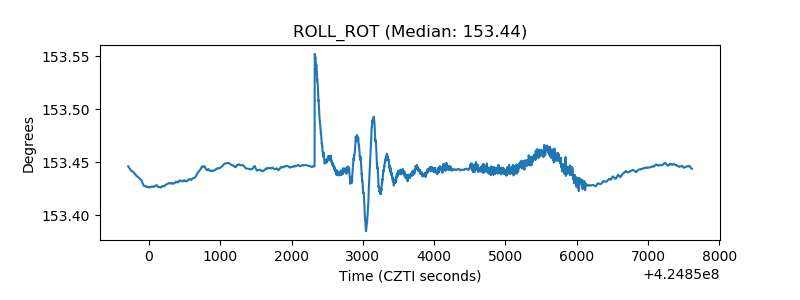 |
| _Roll_DEC | 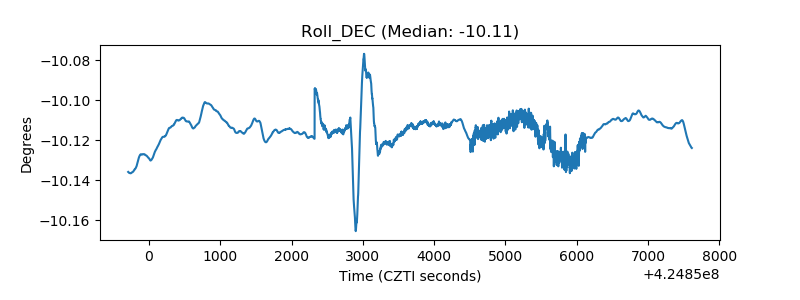 |
| _Roll_RA | 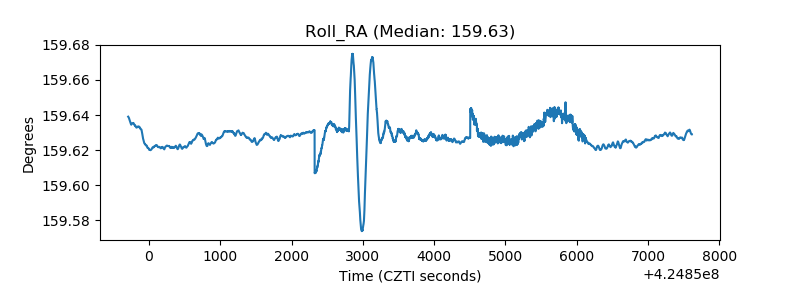 |
| Veto Counter | 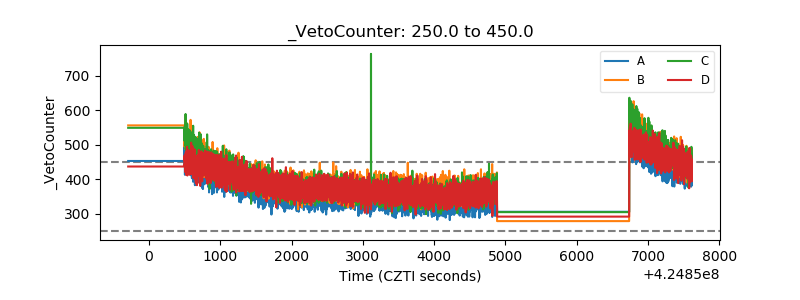 |