| Param | Original file | Final file |
|---|---|---|
| Filename | modeM0/AS1A12_044T19_9000005698_41763cztM0_level2.fits | modeM0/AS1A12_044T19_9000005698_41763cztM0_level2_quad_clean.evt |
| Size (bytes) | 360,449,280 | 95,091,840 |
| Size | 343.8 MB | 90.7 MB |
| Events in quadrant A | 3,086,236 | 660,402 |
| Events in quadrant B | 2,856,701 | 667,519 |
| Events in quadrant C | 3,094,167 | 613,689 |
| Events in quadrant D | 3,892,035 | 565,454 |
| Mode SS | |||
|---|---|---|---|
| Quadrant | BADHDUFLAG | Total packets | Discarded packets |
| A | 0 | 110 | 0 |
| B | 0 | 110 | 0 |
| C | 0 | 110 | 0 |
| D | 0 | 110 | 0 |
| Mode M0 | |||
|---|---|---|---|
| Quadrant | BADHDUFLAG | Total packets | Discarded packets |
| A | 0 | 12293 | 1 |
| B | 0 | 11685 | 1 |
| C | 0 | 12347 | 1 |
| D | 0 | 15195 | 1 |
| Mode M9 | |||
|---|---|---|---|
| Quadrant | BADHDUFLAG | Total packets | Discarded packets |
| A | 0 | 19 | 0 |
| B | 0 | 19 | 0 |
| C | 0 | 19 | 0 |
| D | 0 | 19 | 0 |
| Quadrant | Total seconds | Saturated seconds | Saturation percentage |
|---|---|---|---|
| A | 5314 | 8 | 0.150546% |
| B | 5314 | 29 | 0.545728% |
| C | 5314 | 154 | 2.898005% |
| D | 5315 | 269 | 5.061148% |
Noise dominated data is calculated using 1-second bins in cleaned event files. If a bin has >2000 counts, and if more than 50% of those come from <1% of pixels, then it is considered to be noise-dominated and hence unusable.
| Quadrant | # 1 sec bins | Bins with >0 counts | Bins with >2000 counts | High rate bins dominated by noise | Noise dominated (total time) | Noise dominated (detector-on time) | Marked lightcurve |
|---|---|---|---|---|---|---|---|
| A | 7287 | 5315 | 4 | 4 | 0.05% | 0.08% | 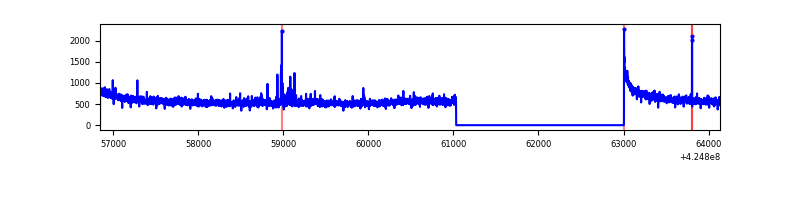 |
| B | 7287 | 5314 | 17 | 17 | 0.23% | 0.32% | 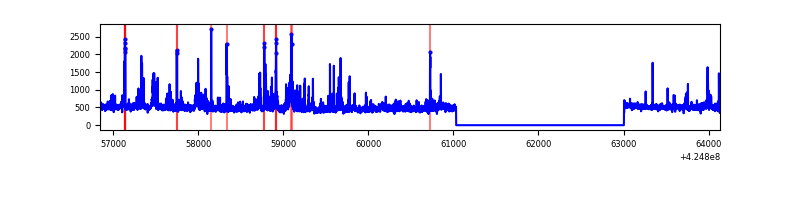 |
| C | 7287 | 5315 | 154 | 154 | 2.11% | 2.90% | 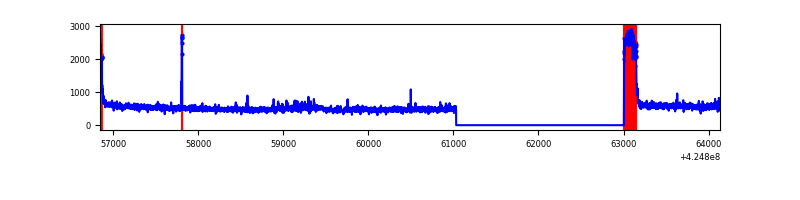 |
| D | 7288 | 5316 | 248 | 248 | 3.40% | 4.67% | 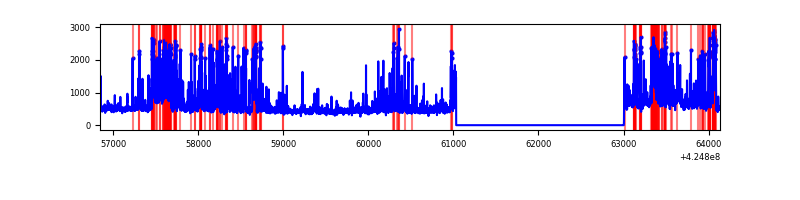 |
Top three noisy pixels from each quadrant. If the there are fewer than three noisy pixels in the level2.evt file, extra rows are filled as -1
| Pixel properties | Quadrant properties | ||||||
|---|---|---|---|---|---|---|---|
| Quadrant | DetID | PixID | Counts | Sigma | Mean | Median | Sigma |
| A | 10 | 83 | 507153 | 3858.26 | 637 | 624 | 131.3 |
| A | 15 | 223 | 63264 | 477.13 | 637 | 624 | 131.3 |
| A | 13 | 248 | 27663 | 205.96 | 637 | 624 | 131.3 |
| B | 5 | 255 | 126607 | 1043.06 | 622 | 606 | 120.8 |
| B | 0 | 245 | 102355 | 842.29 | 622 | 606 | 120.8 |
| B | 3 | 112 | 61730 | 505.99 | 622 | 606 | 120.8 |
| C | 0 | 10 | 512349 | 3689.73 | 596 | 600 | 138.7 |
| C | 15 | 214 | 228083 | 1640.16 | 596 | 600 | 138.7 |
| C | 12 | 249 | 17051 | 118.61 | 596 | 600 | 138.7 |
| D | 2 | 249 | 754043 | 5066.49 | 608 | 593 | 148.7 |
| D | 13 | 249 | 397182 | 2666.82 | 608 | 593 | 148.7 |
| D | 12 | 79 | 168075 | 1126.21 | 608 | 593 | 148.7 |
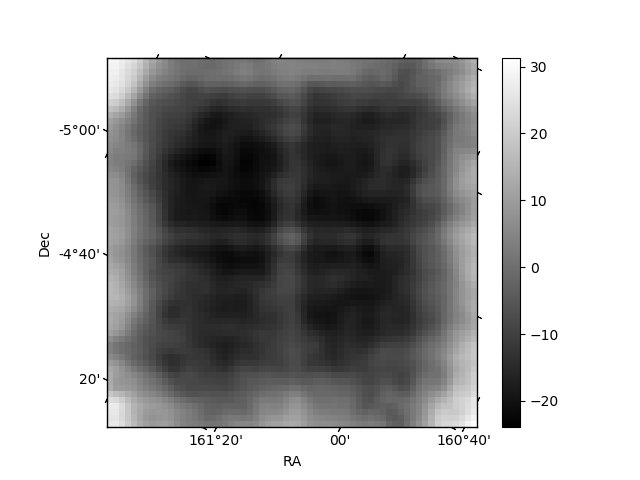
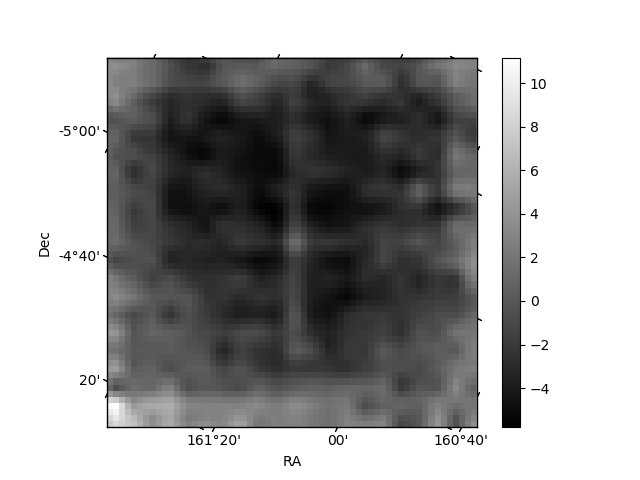
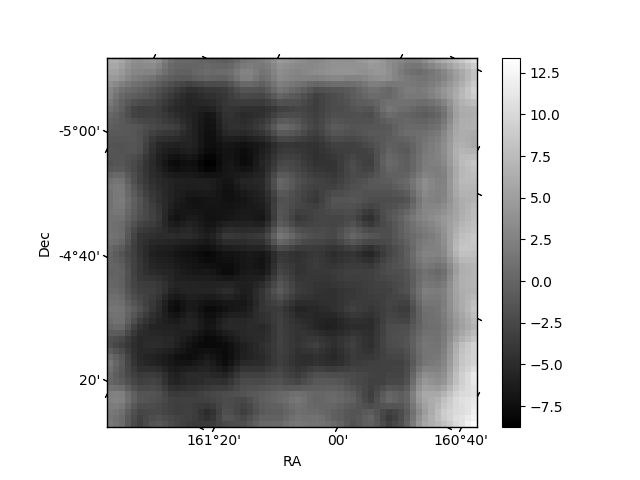
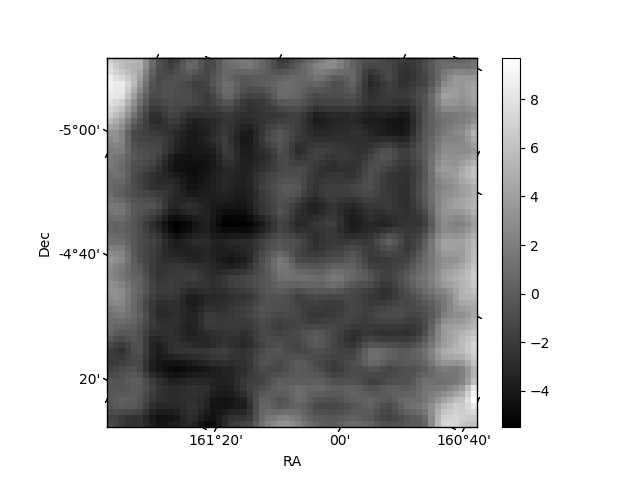
Histogram calculated using DETX and DETY for each event in the final _common_clean file
| Quadrant A | 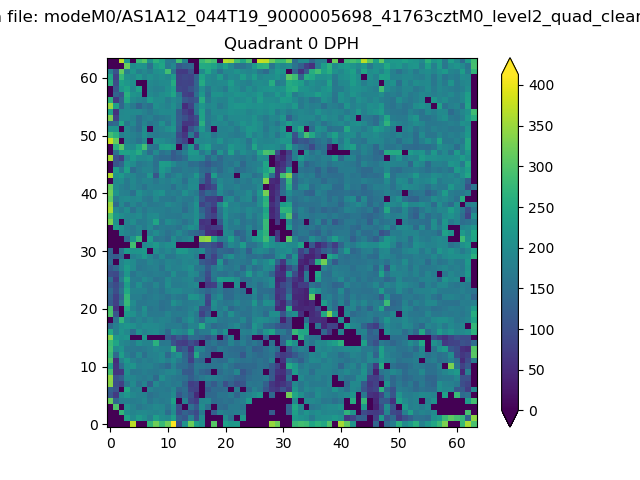 |
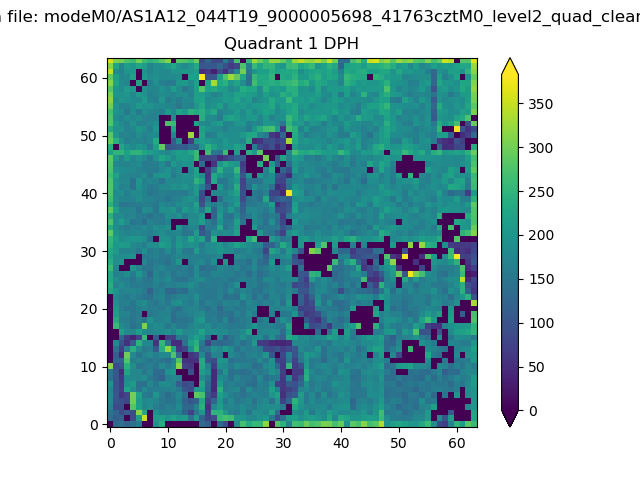 |
Quadrant B |
|---|---|---|---|
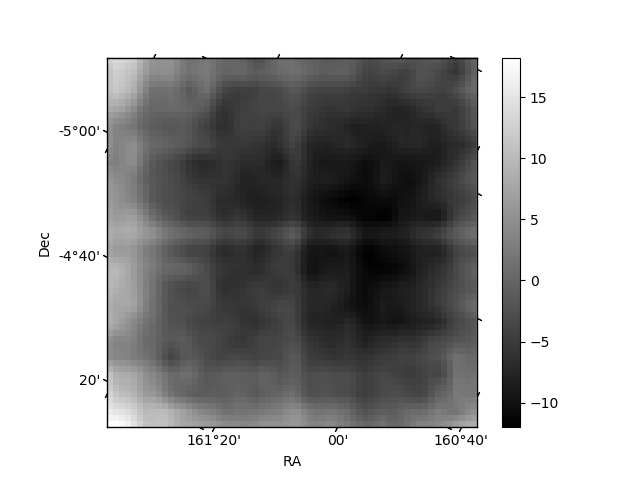
| Quadrant D | 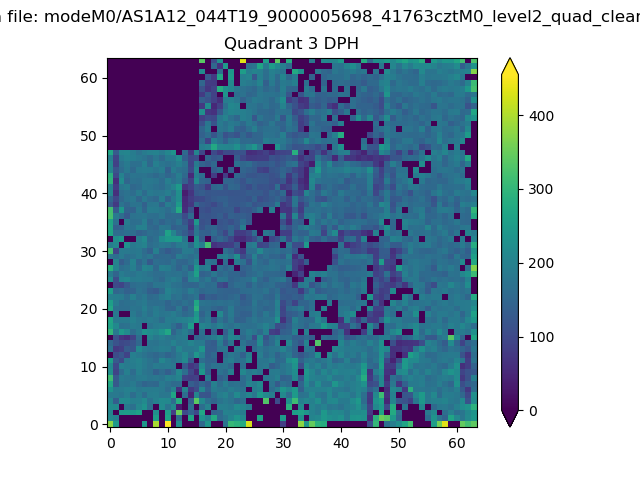 |
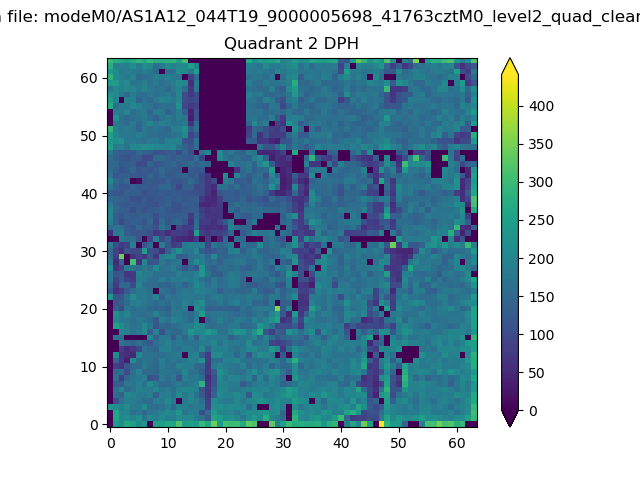 |
Quadrant C |
| Plot type | Count rate plots | Images |
|---|---|---|
| Comparison with Poisson distribution Blue bars denote a histogram of data divided into 1 sec bins. Red curve is a Poisson curve with rate = median count rate of data. |
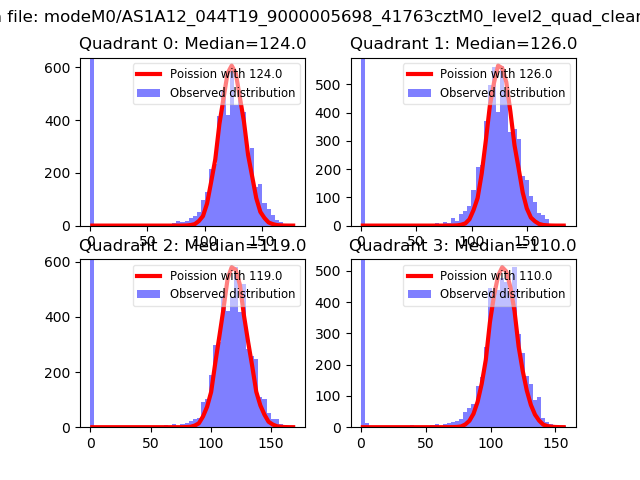 |
 |
| Quadrant-wise count rates Data is divided into 100 sec bins |
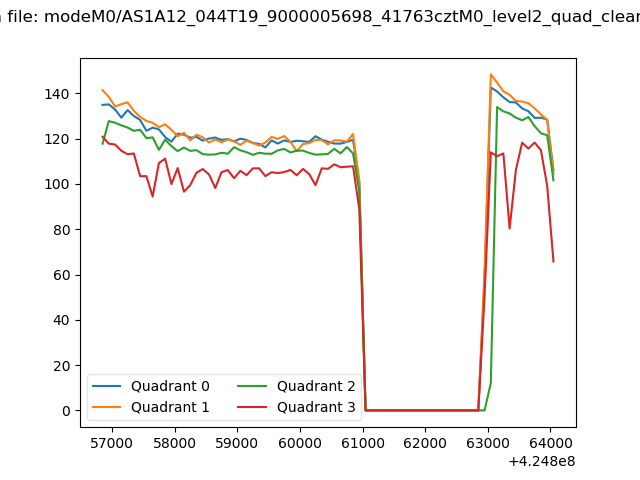 |
|
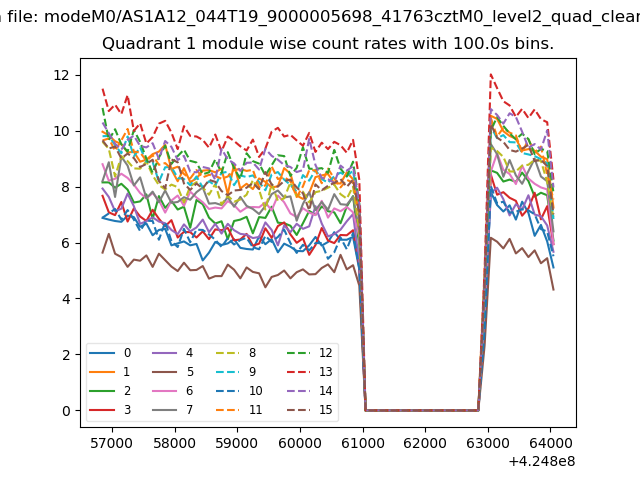
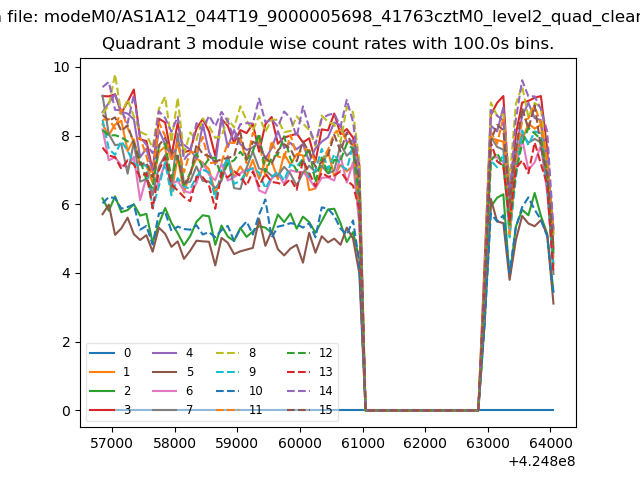
| Module-wise count rates for Quadrant A Data is divided into 100 sec bins |
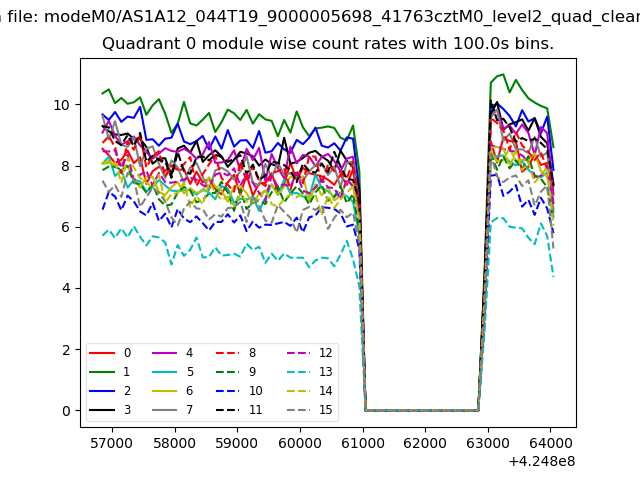 |
 |
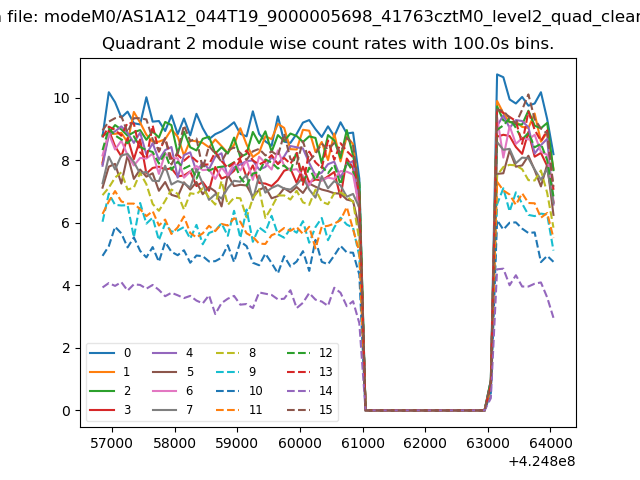
| Module-wise count rates for Quadrant B Data is divided into 100 sec bins |
 |
 |
| Module-wise count rates for Quadrant C Data is divided into 100 sec bins |
 |
 |
| Module-wise count rates for Quadrant D Data is divided into 100 sec bins |
 |
 |
| Parameter | Plot |
|---|---|
| CZT HV Monitor | 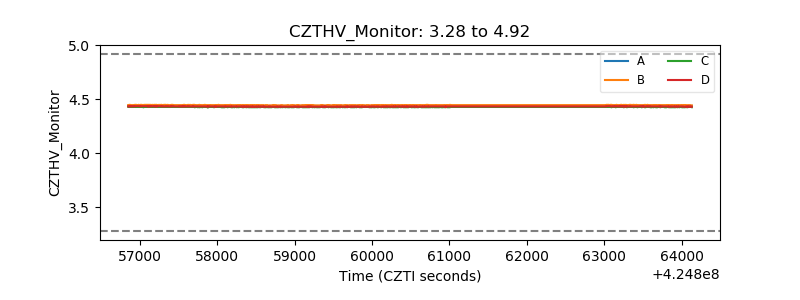 |
| D_VDD | 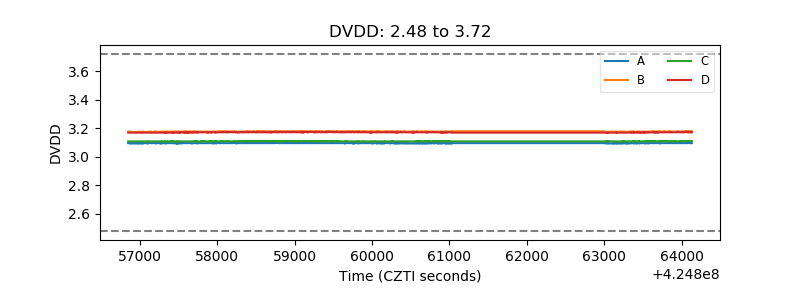 |
| Temperature 1 | 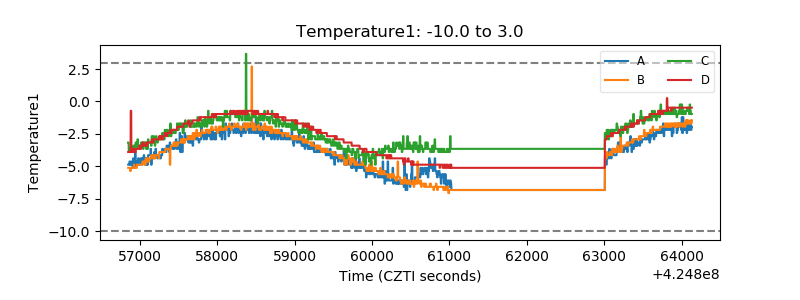 |
| Veto HV Monitor | 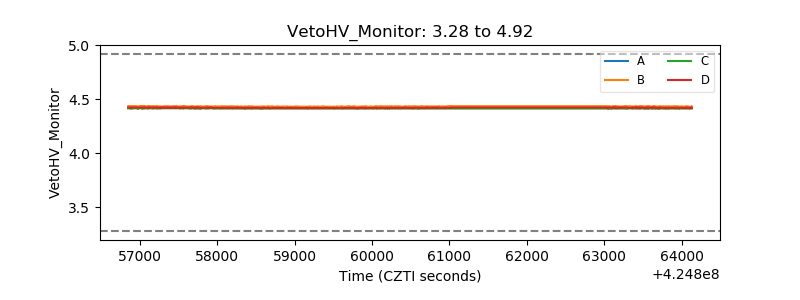 |
| Veto LLD | 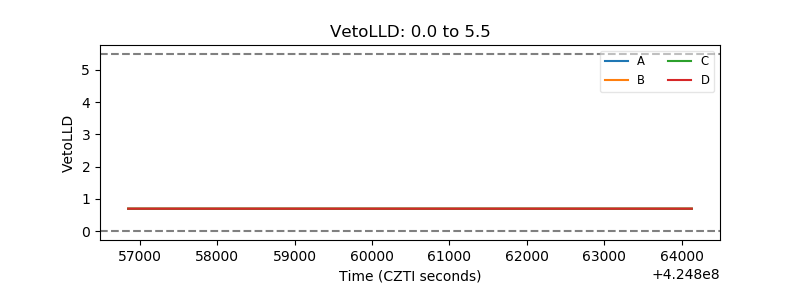 |
| Alpha Counter | 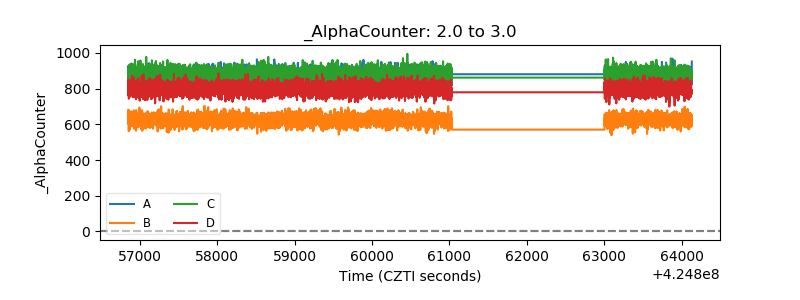 |
| _CPM_Rate | 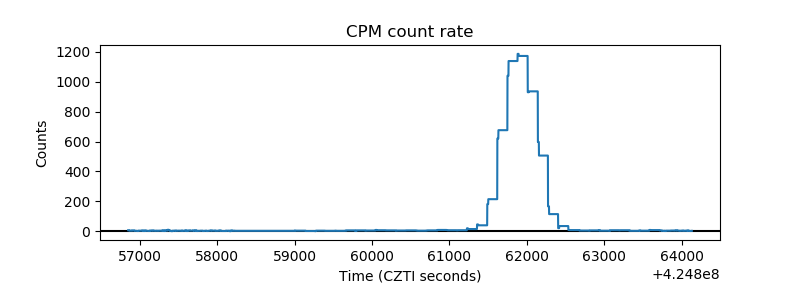 |
| CZT Counter | 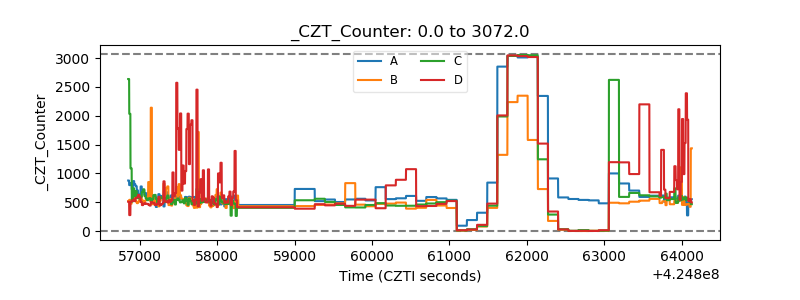 |
| +2.5 Volts monitor |  |
| +5 Volts monitor | 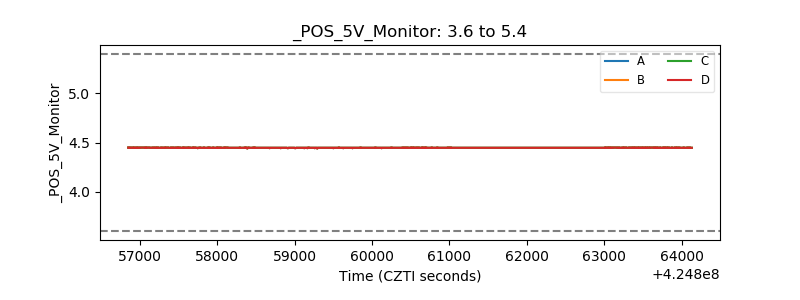 |
| _ROLL_ROT | 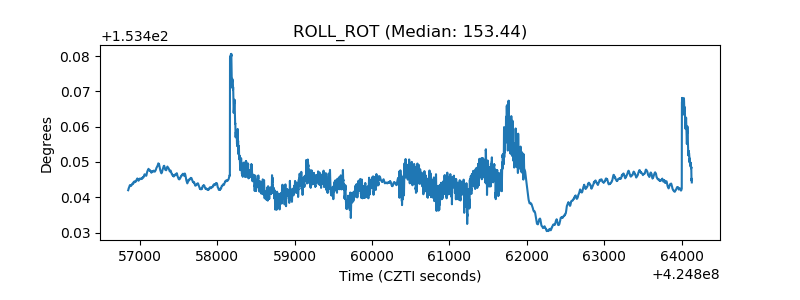 |
| _Roll_DEC | 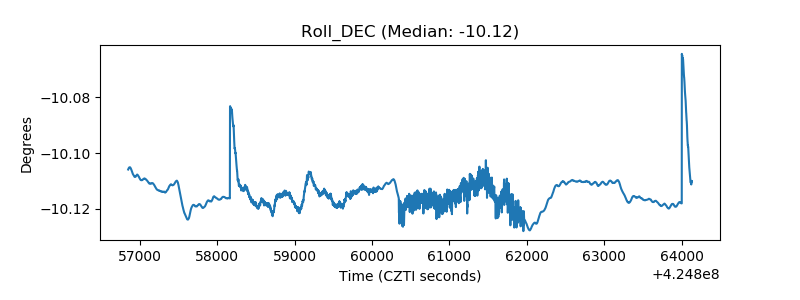 |
| _Roll_RA | 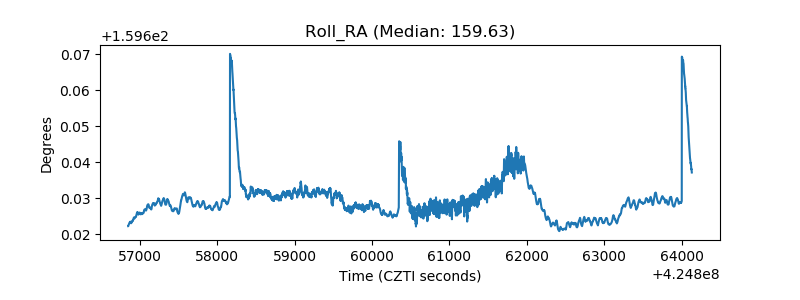 |
| Veto Counter | 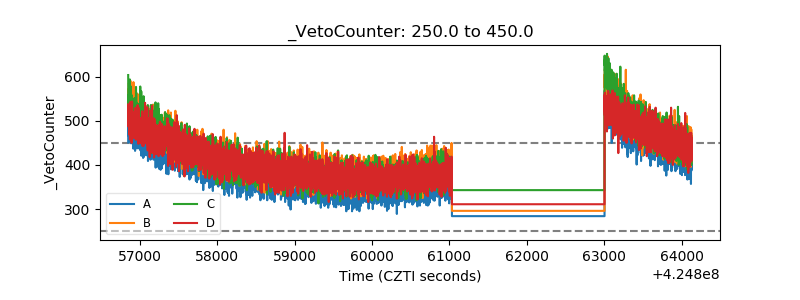 |