| Param | Original file | Final file |
|---|---|---|
| Filename | modeM0/AS1A12_044T19_9000005698_41764cztM0_level2.fits | modeM0/AS1A12_044T19_9000005698_41764cztM0_level2_quad_clean.evt |
| Size (bytes) | 396,648,000 | 94,069,440 |
| Size | 378.3 MB | 89.7 MB |
| Events in quadrant A | 3,101,081 | 669,428 |
| Events in quadrant B | 2,817,491 | 670,298 |
| Events in quadrant C | 3,365,774 | 603,290 |
| Events in quadrant D | 4,984,769 | 532,988 |
| Mode SS | |||
|---|---|---|---|
| Quadrant | BADHDUFLAG | Total packets | Discarded packets |
| A | 0 | 110 | 0 |
| B | 0 | 110 | 0 |
| C | 0 | 110 | 0 |
| D | 0 | 110 | 0 |
| Mode M0 | |||
|---|---|---|---|
| Quadrant | BADHDUFLAG | Total packets | Discarded packets |
| A | 0 | 12391 | 3 |
| B | 0 | 11610 | 2 |
| C | 0 | 13105 | 2 |
| D | 0 | 18385 | 2 |
| Mode M9 | |||
|---|---|---|---|
| Quadrant | BADHDUFLAG | Total packets | Discarded packets |
| A | 0 | 20 | 0 |
| B | 0 | 20 | 0 |
| C | 0 | 20 | 0 |
| D | 0 | 21 | 0 |
| Quadrant | Total seconds | Saturated seconds | Saturation percentage |
|---|---|---|---|
| A | 5316 | 15 | 0.282167% |
| B | 5316 | 36 | 0.677201% |
| C | 5316 | 270 | 5.079007% |
| D | 5316 | 654 | 12.302483% |
Noise dominated data is calculated using 1-second bins in cleaned event files. If a bin has >2000 counts, and if more than 50% of those come from <1% of pixels, then it is considered to be noise-dominated and hence unusable.
| Quadrant | # 1 sec bins | Bins with >0 counts | Bins with >2000 counts | High rate bins dominated by noise | Noise dominated (total time) | Noise dominated (detector-on time) | Marked lightcurve |
|---|---|---|---|---|---|---|---|
| A | 7379 | 5317 | 4 | 4 | 0.05% | 0.08% | 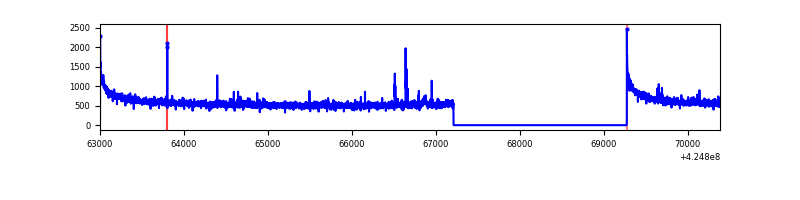 |
| B | 7378 | 5315 | 15 | 15 | 0.20% | 0.28% | 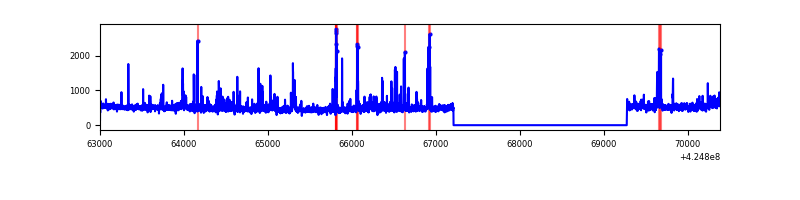 |
| C | 7379 | 5317 | 268 | 268 | 3.63% | 5.04% | 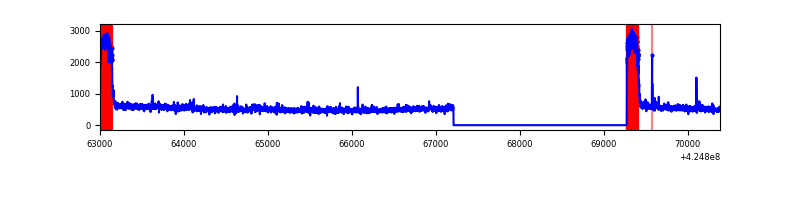 |
| D | 7379 | 5317 | 659 | 659 | 8.93% | 12.39% | 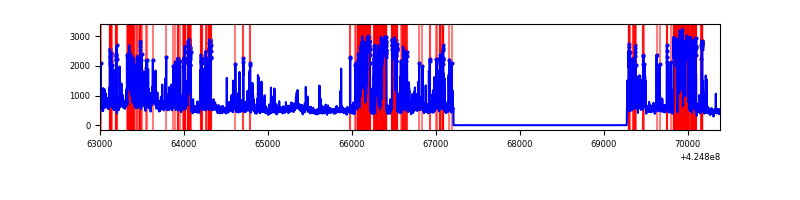 |
Top three noisy pixels from each quadrant. If the there are fewer than three noisy pixels in the level2.evt file, extra rows are filled as -1
| Pixel properties | Quadrant properties | ||||||
|---|---|---|---|---|---|---|---|
| Quadrant | DetID | PixID | Counts | Sigma | Mean | Median | Sigma |
| A | 10 | 83 | 566444 | 4355.58 | 638 | 627 | 129.9 |
| A | 7 | 16 | 23563 | 176.56 | 638 | 627 | 129.9 |
| A | 2 | 79 | 23138 | 173.29 | 638 | 627 | 129.9 |
| B | 3 | 112 | 112786 | 940.81 | 622 | 607 | 119.2 |
| B | 0 | 245 | 100729 | 839.69 | 622 | 607 | 119.2 |
| B | 15 | 54 | 36742 | 303.05 | 622 | 607 | 119.2 |
| C | 0 | 10 | 823271 | 6082.0 | 583 | 586 | 135.3 |
| C | 15 | 214 | 228891 | 1687.83 | 583 | 586 | 135.3 |
| C | 15 | 111 | 11071 | 77.51 | 583 | 586 | 135.3 |
| D | 13 | 249 | 1630344 | 11420.16 | 580 | 565 | 142.7 |
| D | 2 | 249 | 509888 | 3568.92 | 580 | 565 | 142.7 |
| D | 12 | 79 | 345806 | 2419.17 | 580 | 565 | 142.7 |
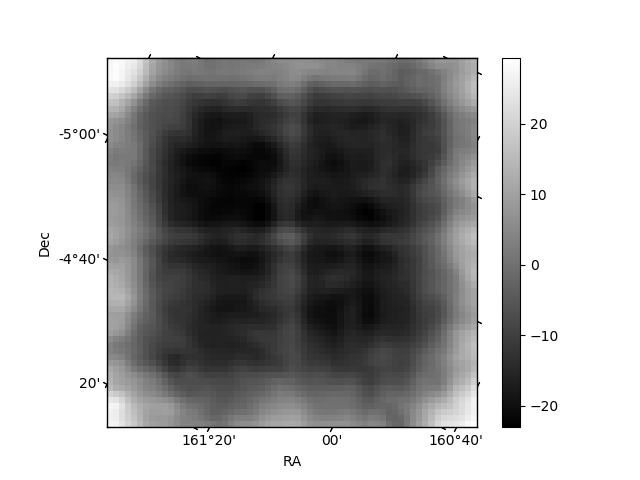
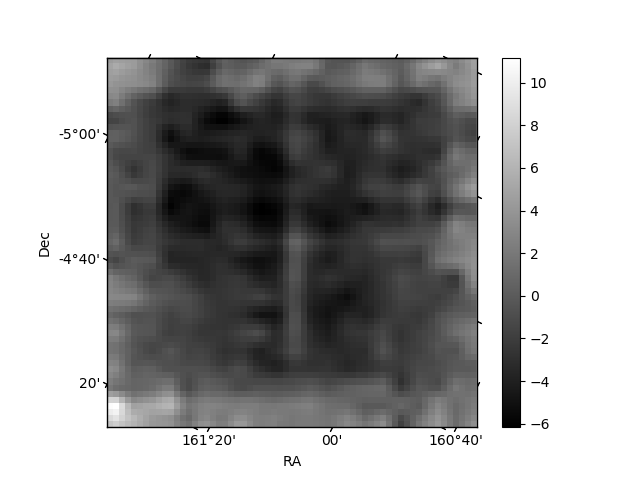
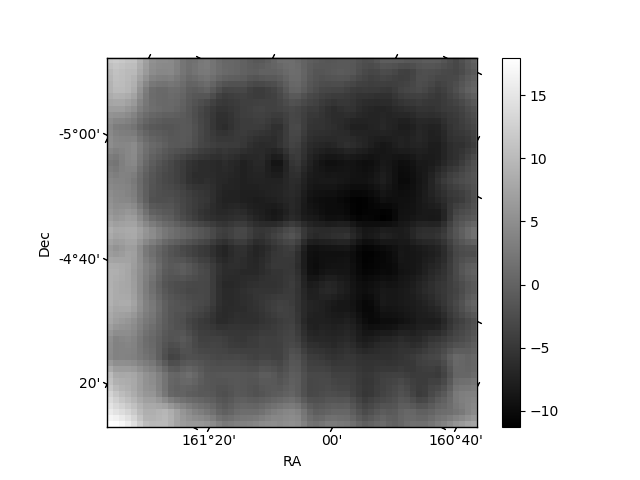
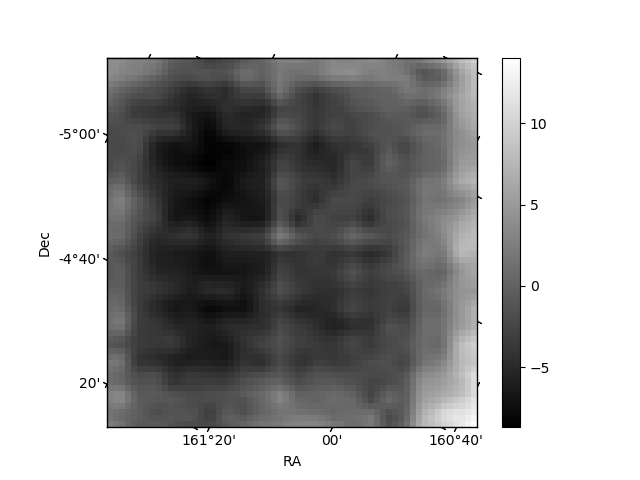
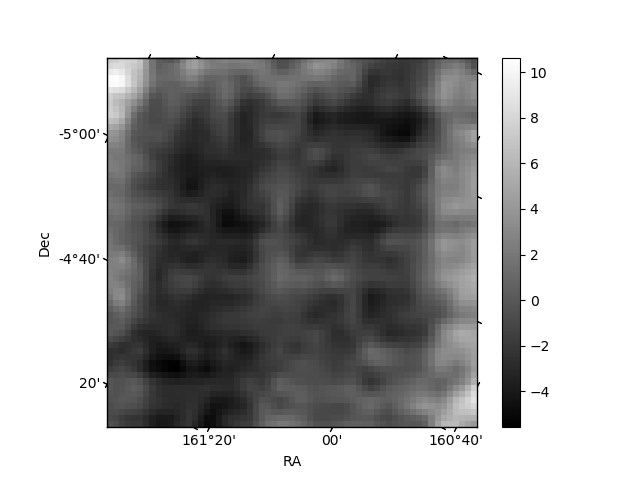
Histogram calculated using DETX and DETY for each event in the final _common_clean file
| Quadrant A | 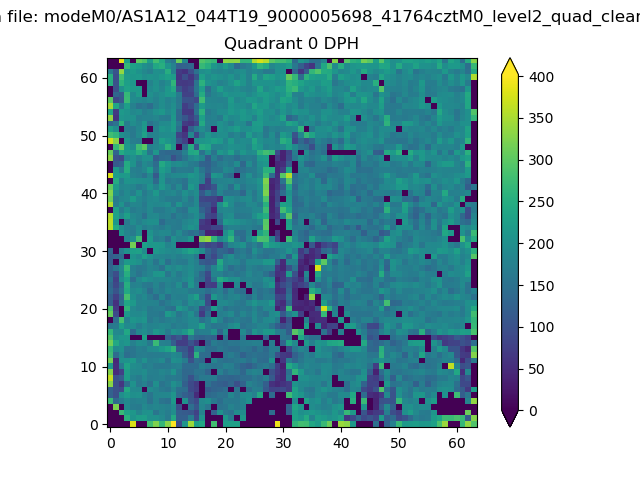 |
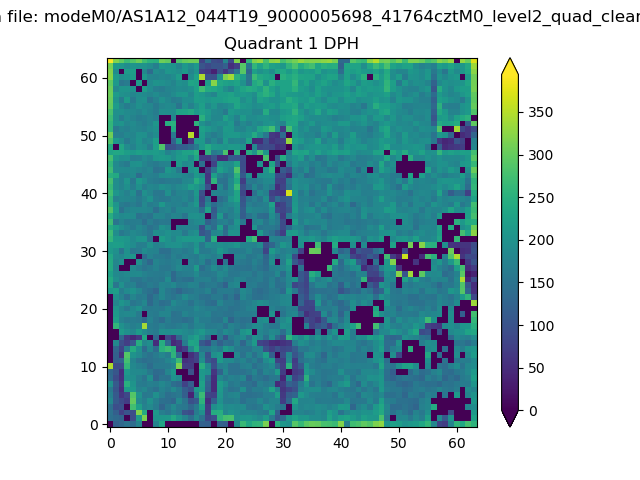 |
Quadrant B |
|---|---|---|---|
| Quadrant D | 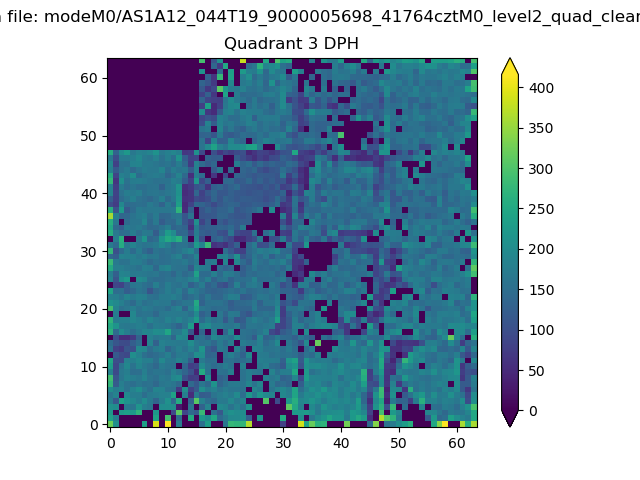 |
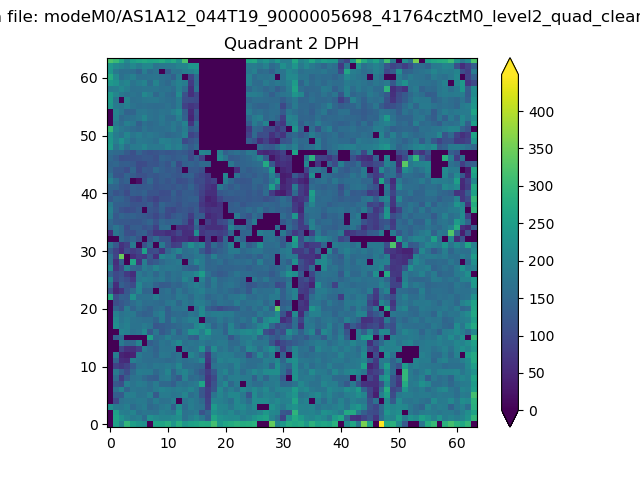 |
Quadrant C |
| Plot type | Count rate plots | Images |
|---|---|---|
| Comparison with Poisson distribution Blue bars denote a histogram of data divided into 1 sec bins. Red curve is a Poisson curve with rate = median count rate of data. |
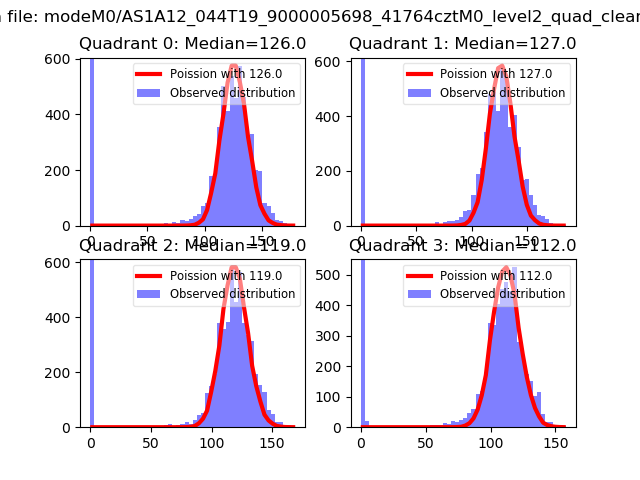 |
 |
| Quadrant-wise count rates Data is divided into 100 sec bins |
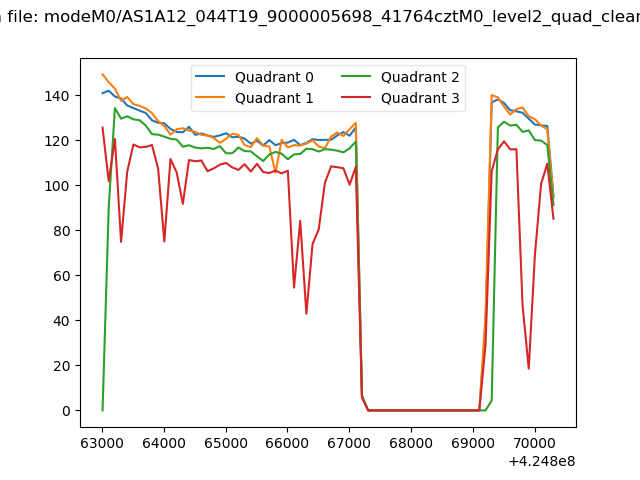 |
|
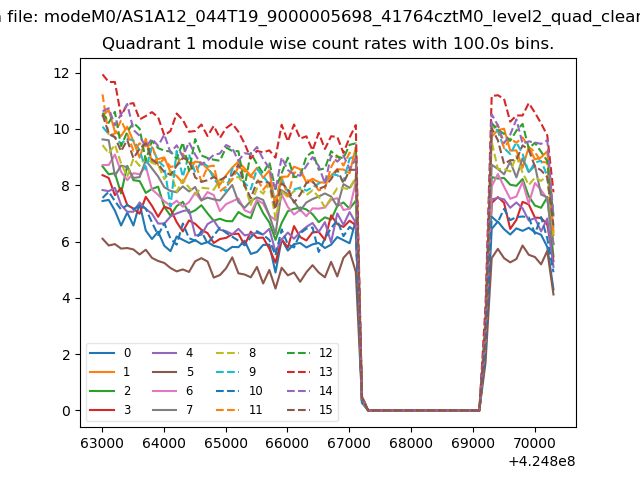
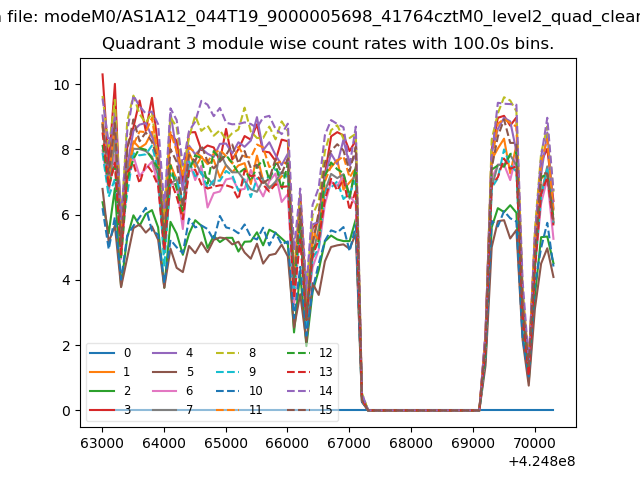
| Module-wise count rates for Quadrant A Data is divided into 100 sec bins |
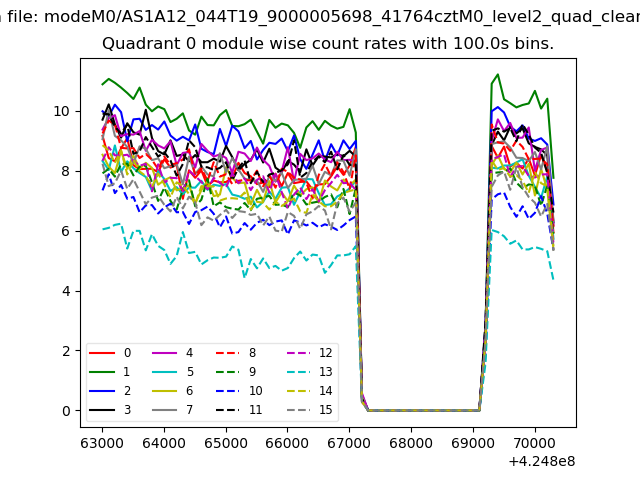 |
 |
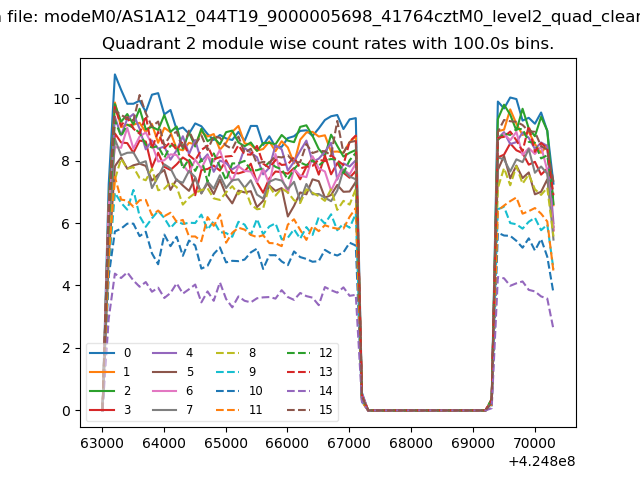
| Module-wise count rates for Quadrant B Data is divided into 100 sec bins |
 |
 |
| Module-wise count rates for Quadrant C Data is divided into 100 sec bins |
 |
 |
| Module-wise count rates for Quadrant D Data is divided into 100 sec bins |
 |
 |
| Parameter | Plot |
|---|---|
| CZT HV Monitor | 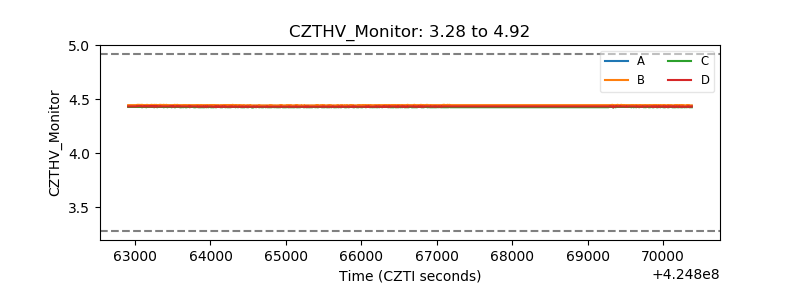 |
| D_VDD | 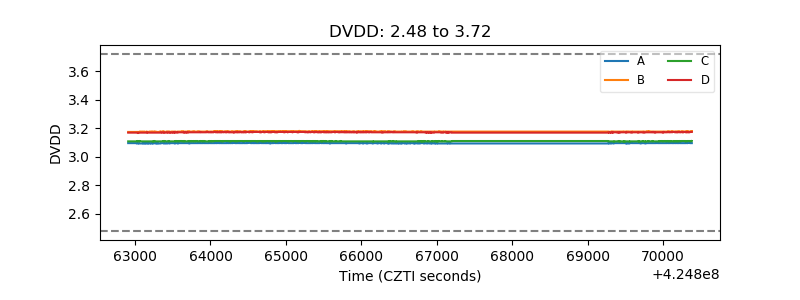 |
| Temperature 1 | 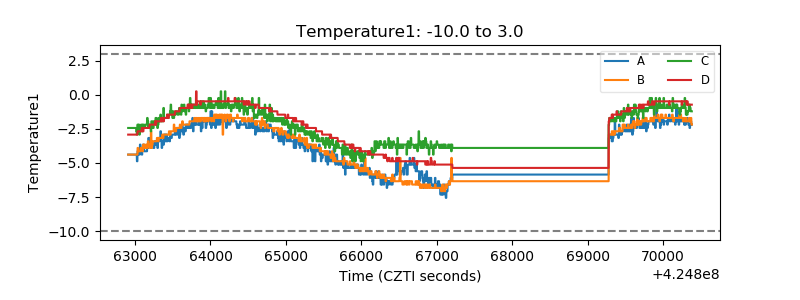 |
| Veto HV Monitor |  |
| Veto LLD | 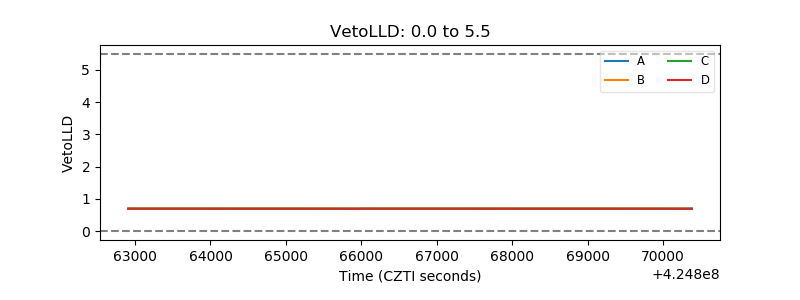 |
| Alpha Counter | 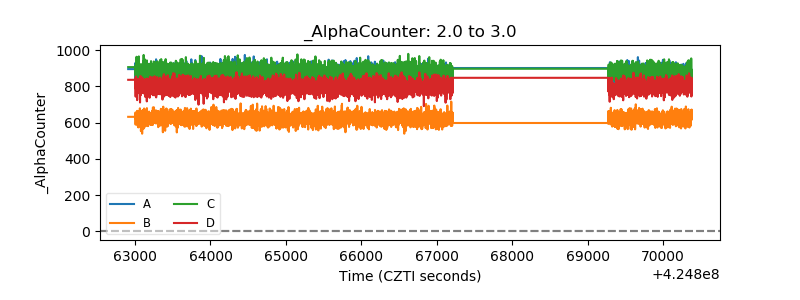 |
| _CPM_Rate | 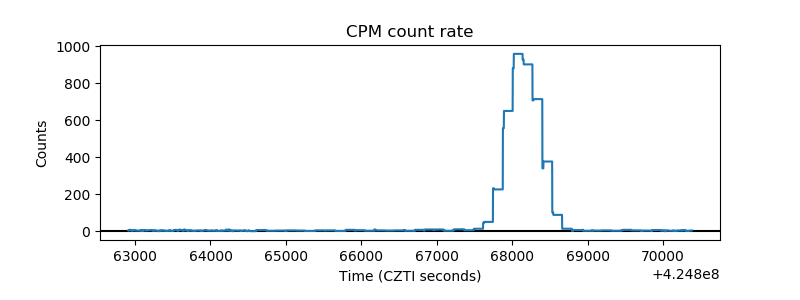 |
| CZT Counter | 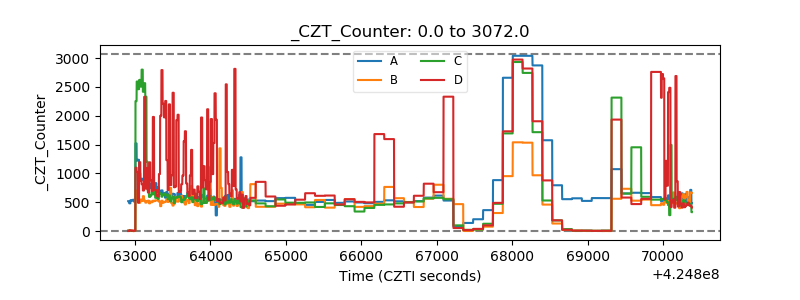 |
| +2.5 Volts monitor | 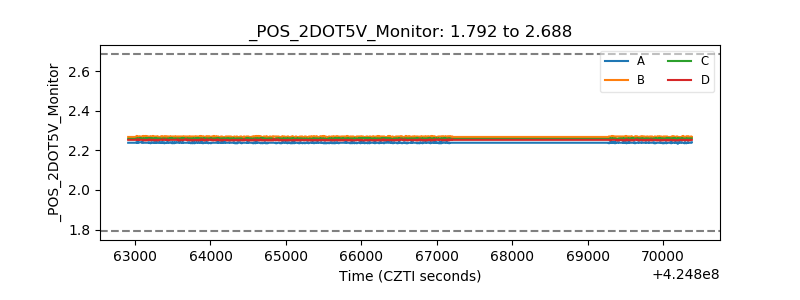 |
| +5 Volts monitor | 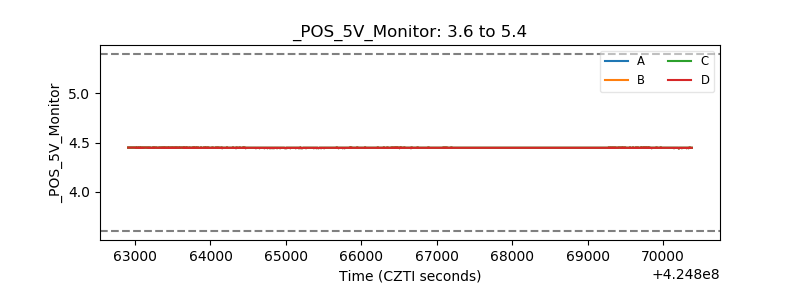 |
| _ROLL_ROT | 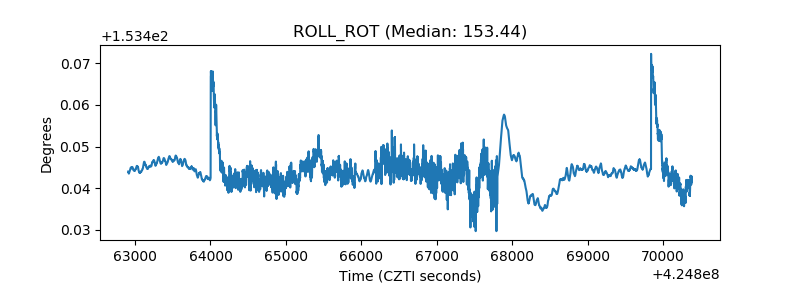 |
| _Roll_DEC | 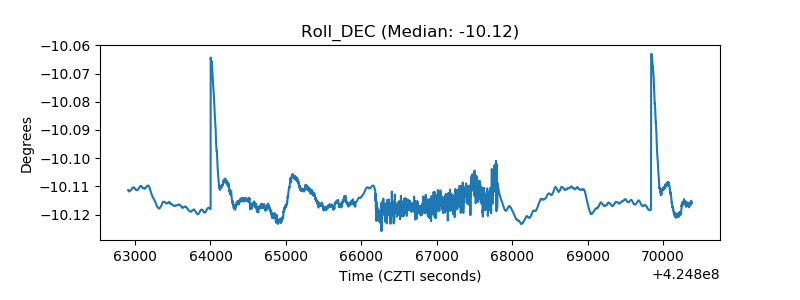 |
| _Roll_RA | 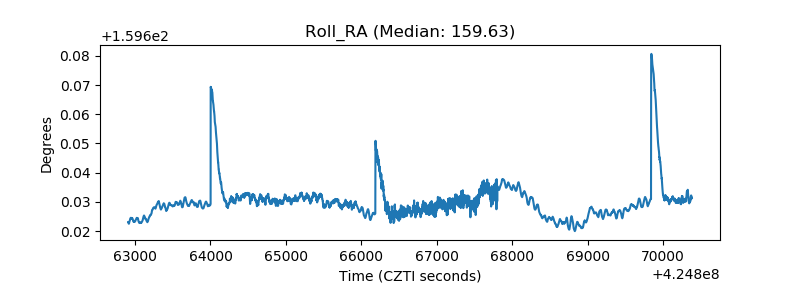 |
| Veto Counter | 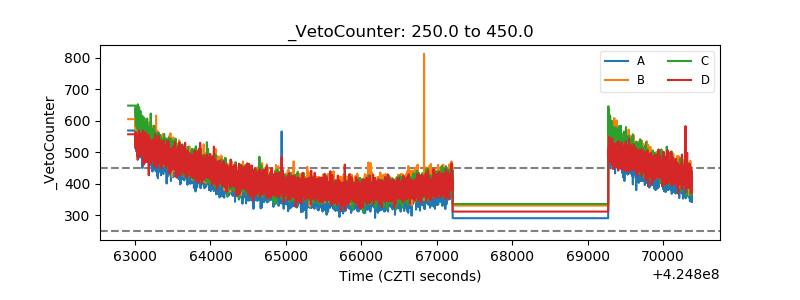 |