| Param | Original file | Final file |
|---|---|---|
| Filename | modeM0/AS1A12_044T19_9000005698_41765cztM0_level2.fits | modeM0/AS1A12_044T19_9000005698_41765cztM0_level2_quad_clean.evt |
| Size (bytes) | 409,887,360 | 86,224,320 |
| Size | 390.9 MB | 82.2 MB |
| Events in quadrant A | 2,929,252 | 625,509 |
| Events in quadrant B | 2,621,371 | 627,969 |
| Events in quadrant C | 3,161,753 | 565,956 |
| Events in quadrant D | 6,061,587 | 432,347 |
| Mode SS | |||
|---|---|---|---|
| Quadrant | BADHDUFLAG | Total packets | Discarded packets |
| A | 0 | 106 | 0 |
| B | 0 | 106 | 0 |
| C | 0 | 106 | 0 |
| D | 0 | 106 | 0 |
| Mode M0 | |||
|---|---|---|---|
| Quadrant | BADHDUFLAG | Total packets | Discarded packets |
| A | 0 | 11764 | 2 |
| B | 0 | 10971 | 2 |
| C | 0 | 12554 | 2 |
| D | 0 | 21525 | 6 |
| Mode M9 | |||
|---|---|---|---|
| Quadrant | BADHDUFLAG | Total packets | Discarded packets |
| A | 0 | 25 | 0 |
| B | 0 | 26 | 0 |
| C | 0 | 26 | 0 |
| D | 0 | 26 | 0 |
| Quadrant | Total seconds | Saturated seconds | Saturation percentage |
|---|---|---|---|
| A | 5121 | 14 | 0.273384% |
| B | 5121 | 18 | 0.351494% |
| C | 5121 | 256 | 4.999024% |
| D | 5120 | 1321 | 25.800781% |
Noise dominated data is calculated using 1-second bins in cleaned event files. If a bin has >2000 counts, and if more than 50% of those come from <1% of pixels, then it is considered to be noise-dominated and hence unusable.
| Quadrant | # 1 sec bins | Bins with >0 counts | Bins with >2000 counts | High rate bins dominated by noise | Noise dominated (total time) | Noise dominated (detector-on time) | Marked lightcurve |
|---|---|---|---|---|---|---|---|
| A | 7243 | 5122 | 3 | 3 | 0.04% | 0.06% | 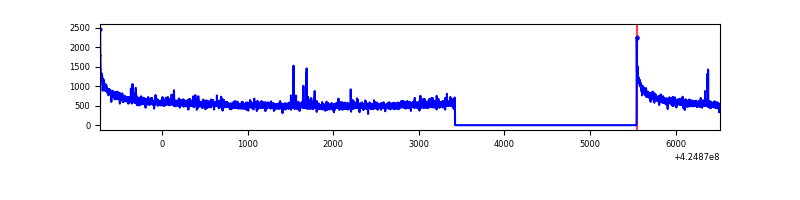 |
| B | 7242 | 5120 | 11 | 11 | 0.15% | 0.21% | 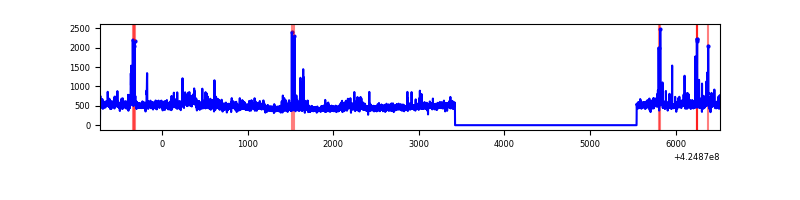 |
| C | 7243 | 5122 | 256 | 256 | 3.53% | 5.00% | 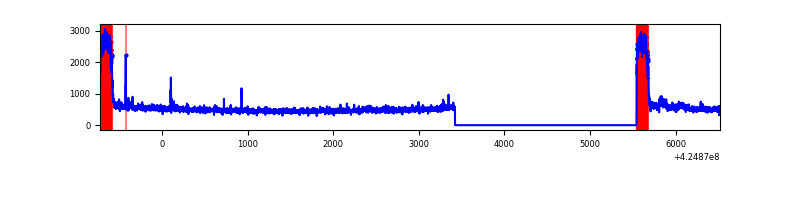 |
| D | 7242 | 5121 | 1353 | 1353 | 18.68% | 26.42% | 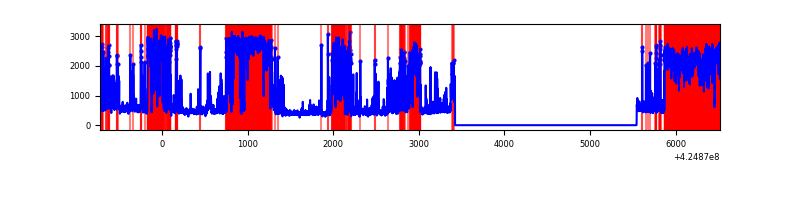 |
Top three noisy pixels from each quadrant. If the there are fewer than three noisy pixels in the level2.evt file, extra rows are filled as -1
| Pixel properties | Quadrant properties | ||||||
|---|---|---|---|---|---|---|---|
| Quadrant | DetID | PixID | Counts | Sigma | Mean | Median | Sigma |
| A | 10 | 83 | 559493 | 4547.45 | 596 | 584 | 122.9 |
| A | 2 | 79 | 33074 | 264.35 | 596 | 584 | 122.9 |
| A | 13 | 6 | 16717 | 131.26 | 596 | 584 | 122.9 |
| B | 0 | 186 | 104031 | 914.55 | 584 | 568 | 113.1 |
| B | 0 | 245 | 84041 | 737.85 | 584 | 568 | 113.1 |
| B | 3 | 112 | 43278 | 377.53 | 584 | 568 | 113.1 |
| C | 0 | 10 | 774467 | 6081.0 | 545 | 549 | 127.3 |
| C | 15 | 214 | 216479 | 1696.65 | 545 | 549 | 127.3 |
| C | 14 | 67 | 22878 | 175.45 | 545 | 549 | 127.3 |
| D | 13 | 249 | 2483566 | 19891.29 | 498 | 484 | 124.8 |
| D | 12 | 79 | 1206476 | 9660.87 | 498 | 484 | 124.8 |
| D | 2 | 249 | 179970 | 1437.81 | 498 | 484 | 124.8 |
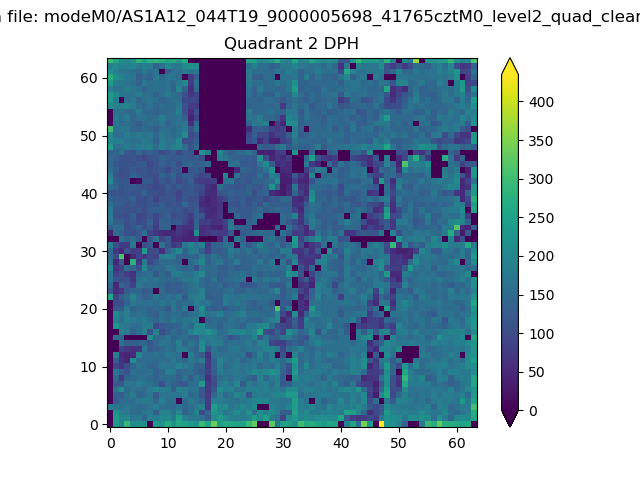
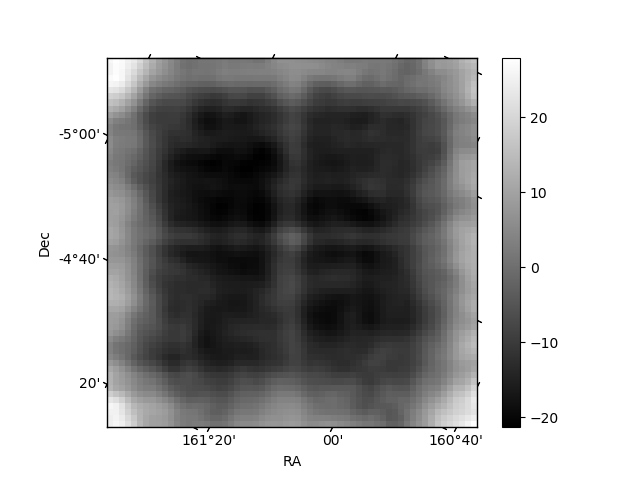
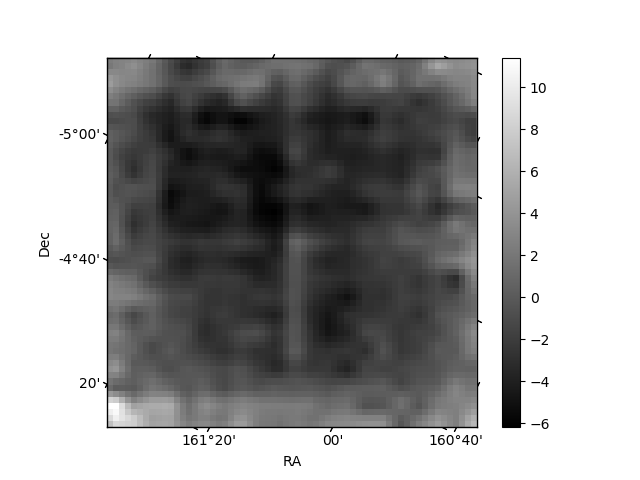
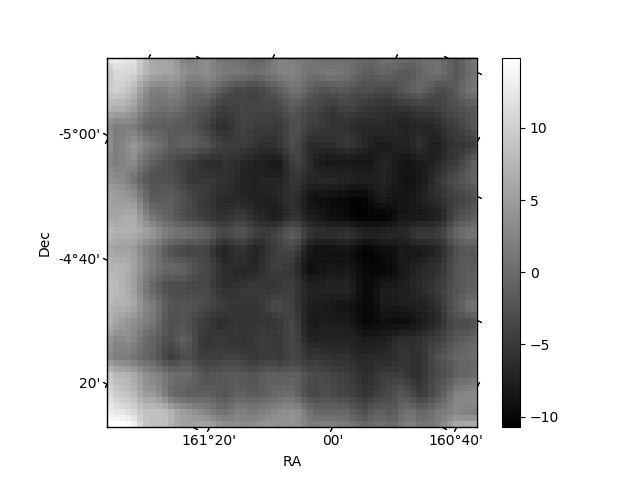
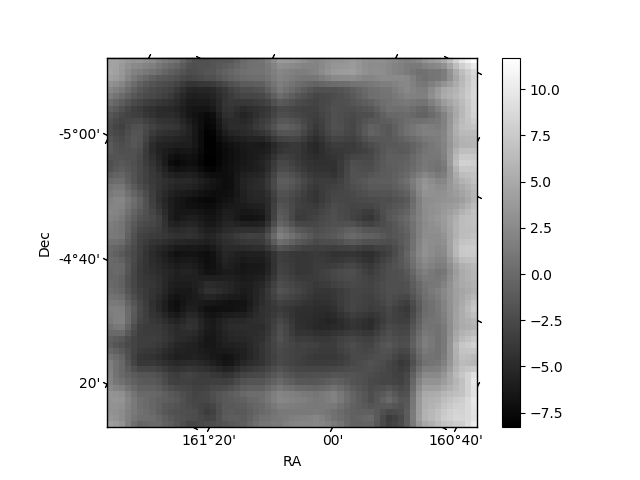
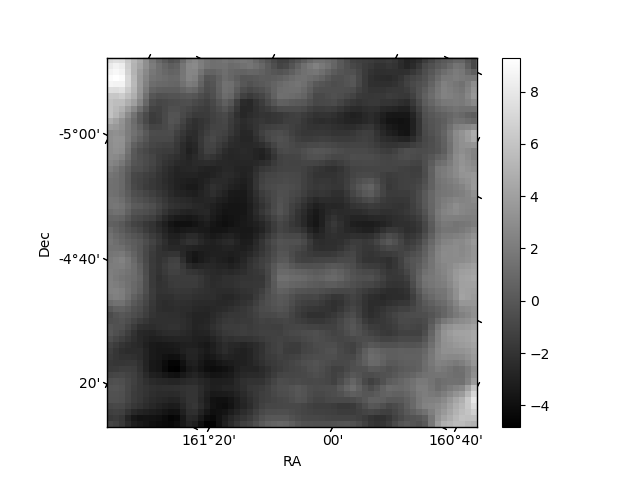
Histogram calculated using DETX and DETY for each event in the final _common_clean file
| Quadrant A | 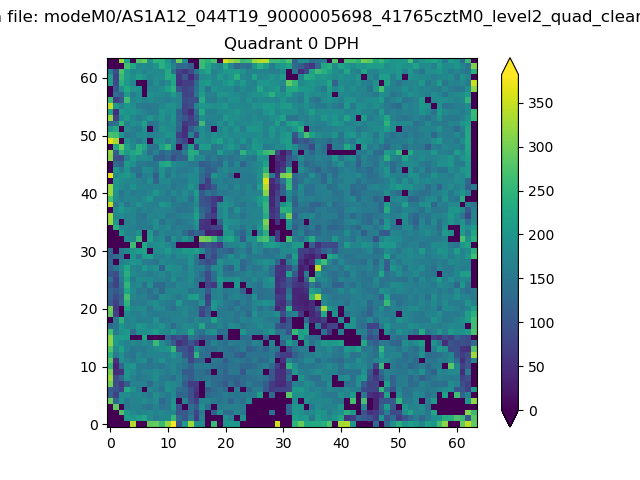 |
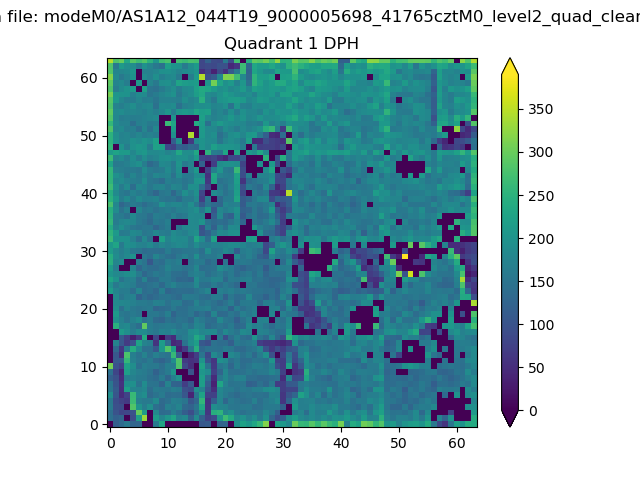 |
Quadrant B |
|---|---|---|---|
| Quadrant D | 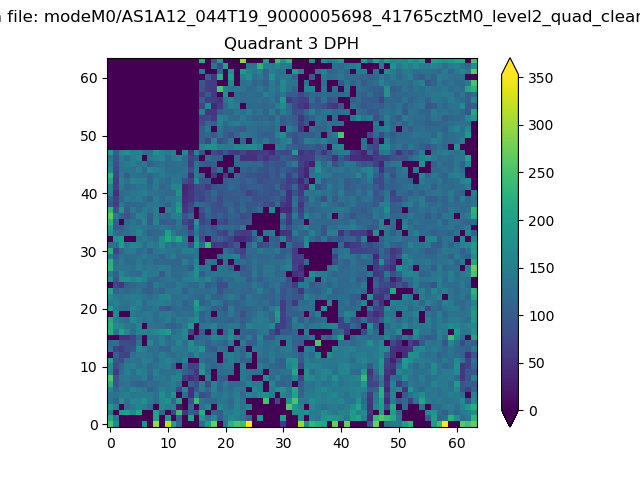 |
 |
Quadrant C |
| Plot type | Count rate plots | Images |
|---|---|---|
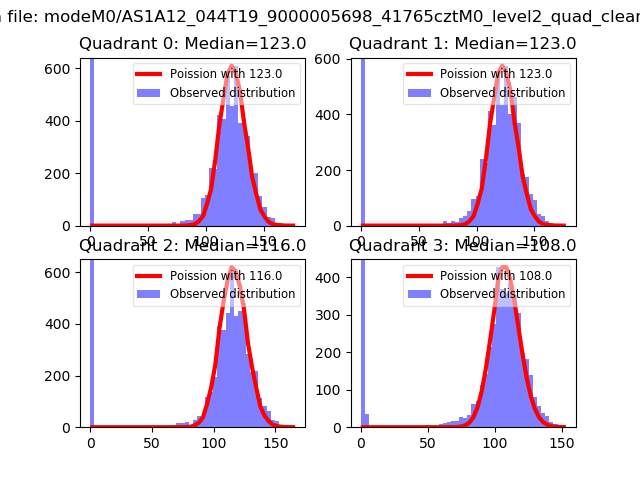
| Comparison with Poisson distribution Blue bars denote a histogram of data divided into 1 sec bins. Red curve is a Poisson curve with rate = median count rate of data. |
 |
 |
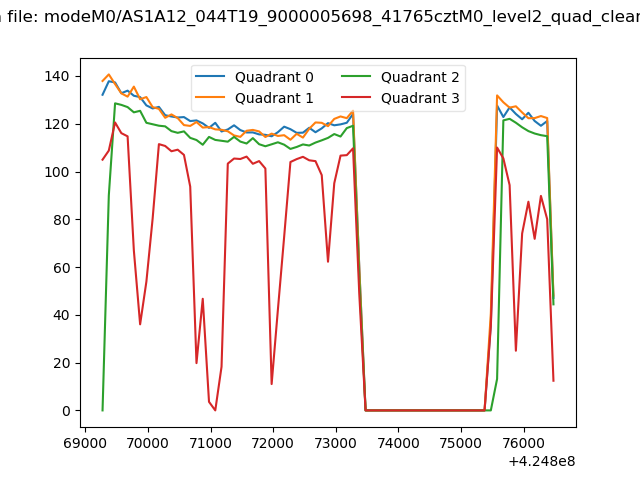
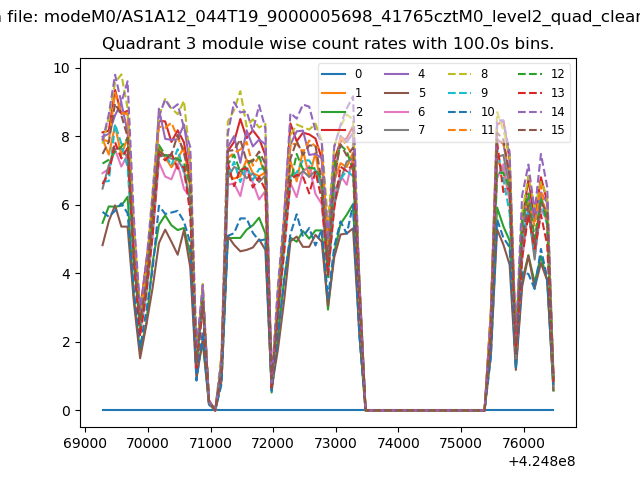
| Quadrant-wise count rates Data is divided into 100 sec bins |
 |
|
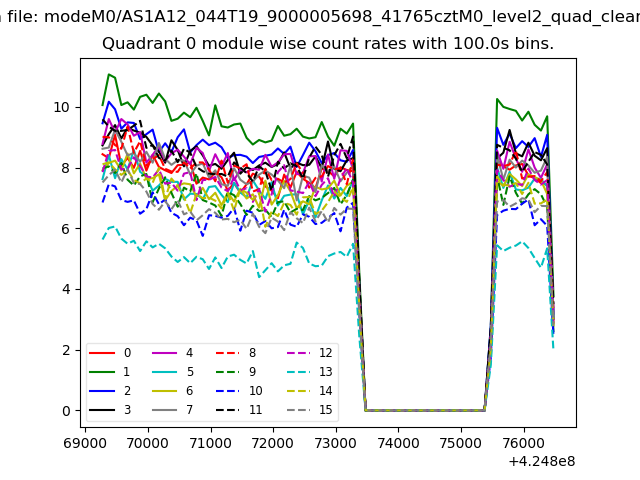
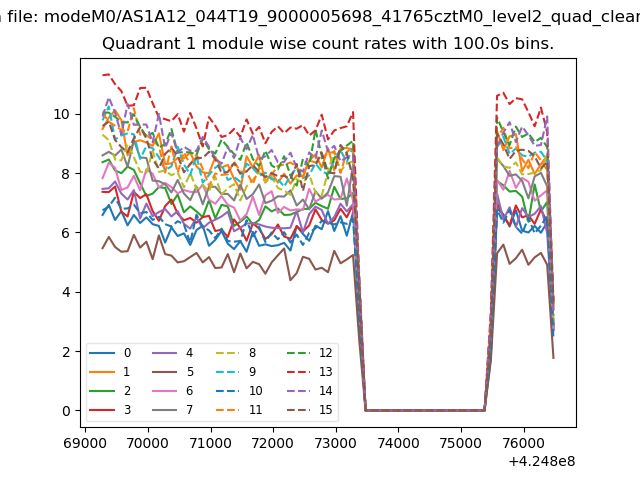
| Module-wise count rates for Quadrant A Data is divided into 100 sec bins |
 |
 |
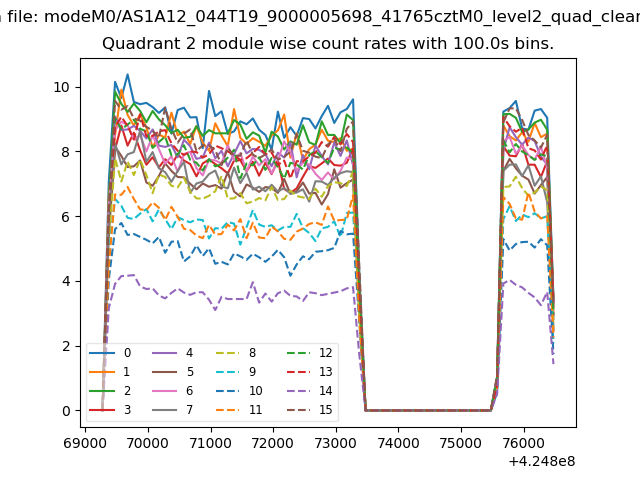
| Module-wise count rates for Quadrant B Data is divided into 100 sec bins |
 |
 |
| Module-wise count rates for Quadrant C Data is divided into 100 sec bins |
 |
 |
| Module-wise count rates for Quadrant D Data is divided into 100 sec bins |
 |
 |
| Parameter | Plot |
|---|---|
| CZT HV Monitor |  |
| D_VDD | 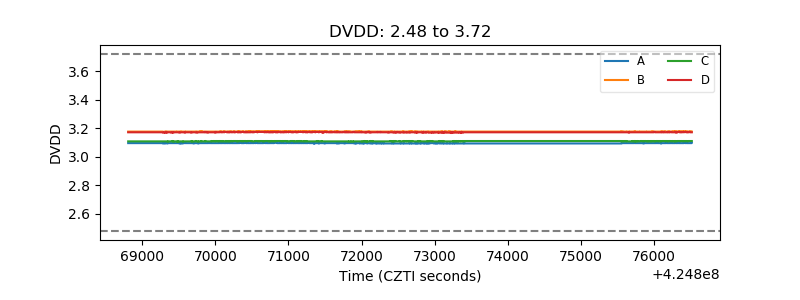 |
| Temperature 1 | 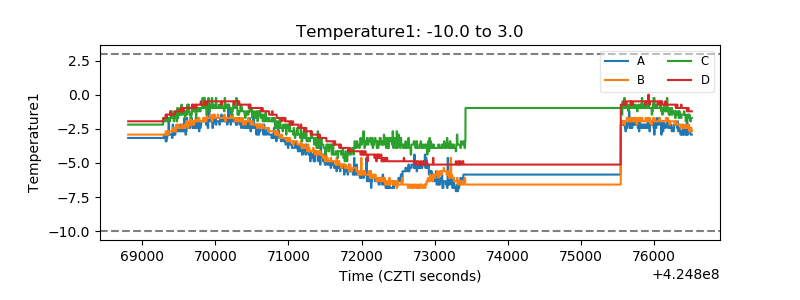 |
| Veto HV Monitor | 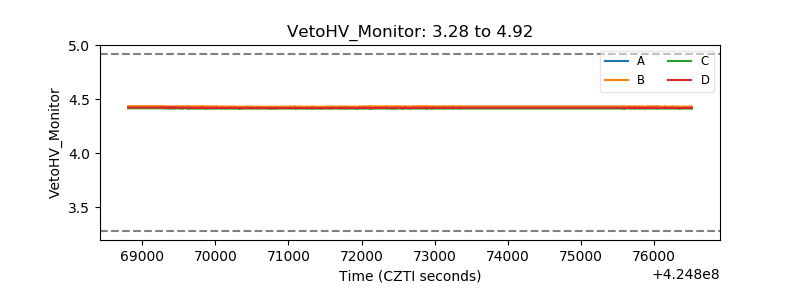 |
| Veto LLD | 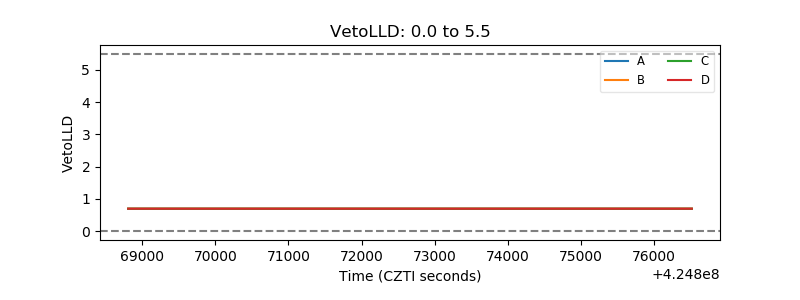 |
| Alpha Counter | 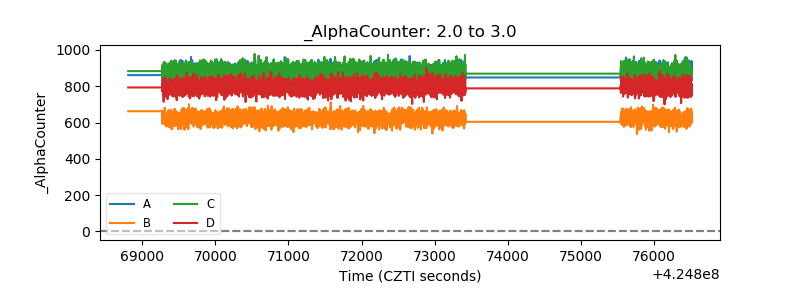 |
| _CPM_Rate | 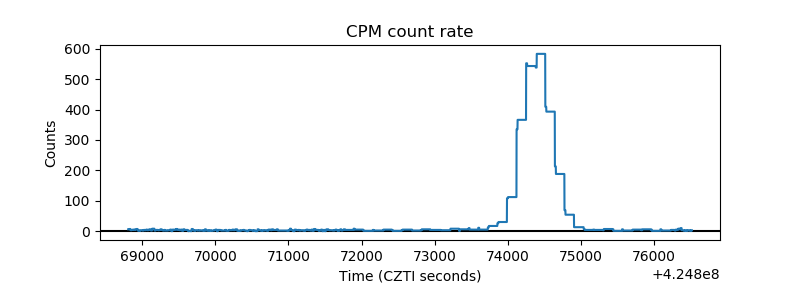 |
| CZT Counter | 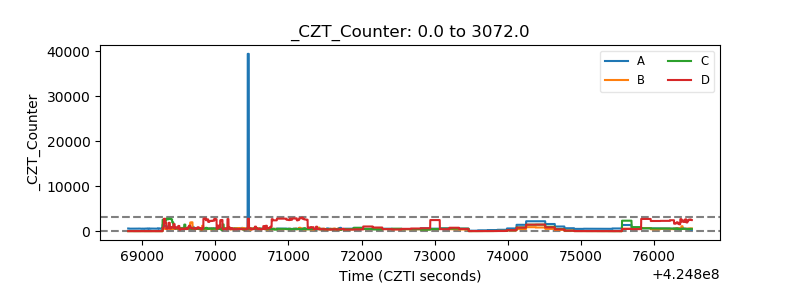 |
| +2.5 Volts monitor | 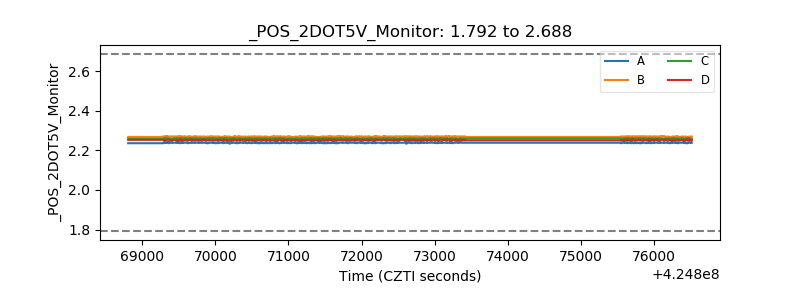 |
| +5 Volts monitor | 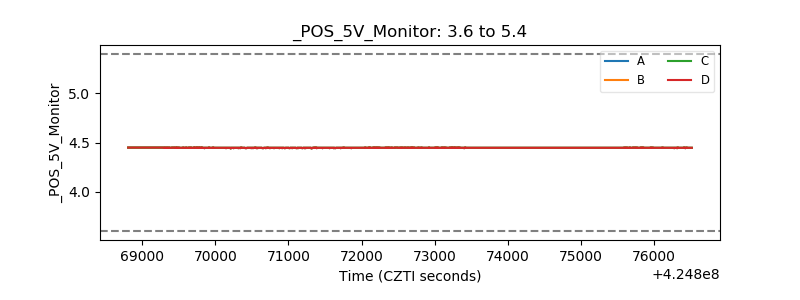 |
| _ROLL_ROT | 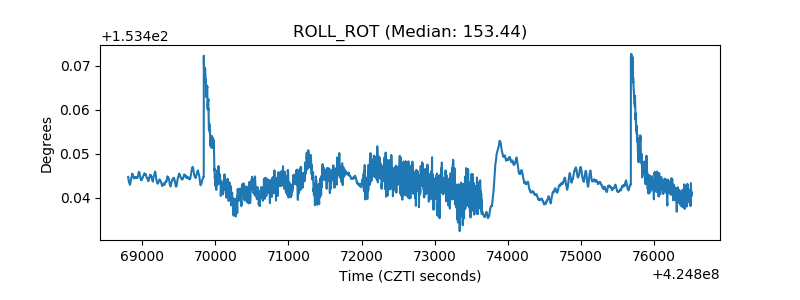 |
| _Roll_DEC | 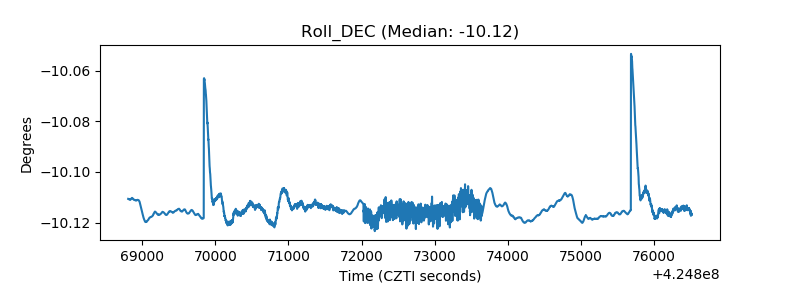 |
| _Roll_RA | 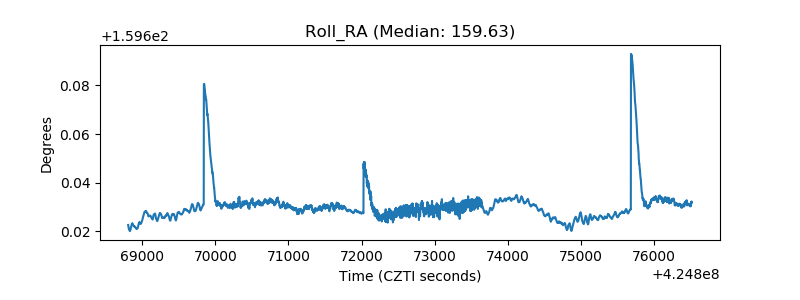 |
| Veto Counter | 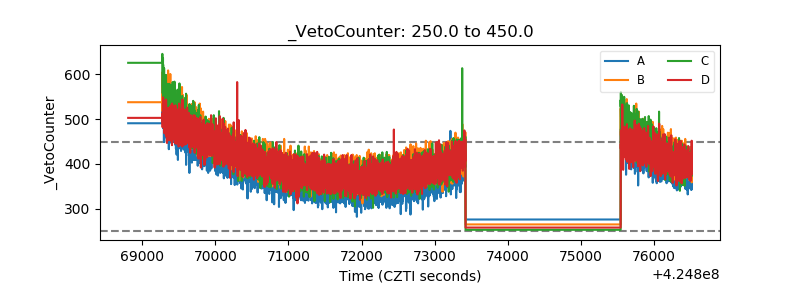 |