| Param | Original file | Final file |
|---|---|---|
| Filename | modeM0/AS1A12_044T19_9000005698_41766cztM0_level2.fits | modeM0/AS1A12_044T19_9000005698_41766cztM0_level2_quad_clean.evt |
| Size (bytes) | 370,503,360 | 83,355,840 |
| Size | 353.3 MB | 79.5 MB |
| Events in quadrant A | 2,724,785 | 581,182 |
| Events in quadrant B | 2,510,225 | 585,407 |
| Events in quadrant C | 2,967,151 | 531,134 |
| Events in quadrant D | 5,123,730 | 476,261 |
| Mode SS | |||
|---|---|---|---|
| Quadrant | BADHDUFLAG | Total packets | Discarded packets |
| A | 0 | 100 | 0 |
| B | 0 | 100 | 0 |
| C | 0 | 100 | 0 |
| D | 0 | 100 | 0 |
| Mode M0 | |||
|---|---|---|---|
| Quadrant | BADHDUFLAG | Total packets | Discarded packets |
| A | 0 | 11091 | 2 |
| B | 0 | 10733 | 2 |
| C | 0 | 11946 | 2 |
| D | 0 | 18683 | 2 |
| Mode M9 | |||
|---|---|---|---|
| Quadrant | BADHDUFLAG | Total packets | Discarded packets |
| A | 0 | 22 | 0 |
| B | 0 | 22 | 0 |
| C | 0 | 22 | 0 |
| D | 0 | 22 | 0 |
| Quadrant | Total seconds | Saturated seconds | Saturation percentage |
|---|---|---|---|
| A | 4996 | 8 | 0.160128% |
| B | 4997 | 29 | 0.580348% |
| C | 4997 | 206 | 4.122473% |
| D | 4997 | 610 | 12.207324% |
Noise dominated data is calculated using 1-second bins in cleaned event files. If a bin has >2000 counts, and if more than 50% of those come from <1% of pixels, then it is considered to be noise-dominated and hence unusable.
| Quadrant | # 1 sec bins | Bins with >0 counts | Bins with >2000 counts | High rate bins dominated by noise | Noise dominated (total time) | Noise dominated (detector-on time) | Marked lightcurve |
|---|---|---|---|---|---|---|---|
| A | 7118 | 4997 | 5 | 5 | 0.07% | 0.10% | 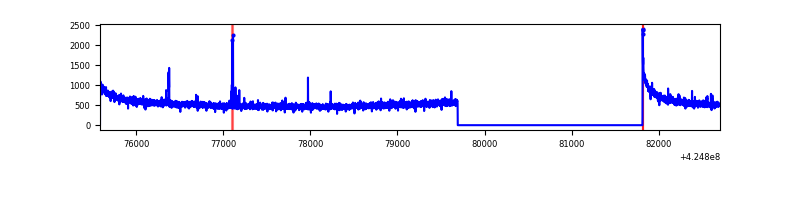 |
| B | 7119 | 4997 | 19 | 19 | 0.27% | 0.38% | 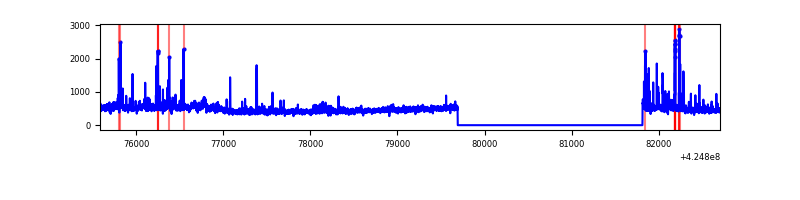 |
| C | 7119 | 4997 | 211 | 211 | 2.96% | 4.22% | 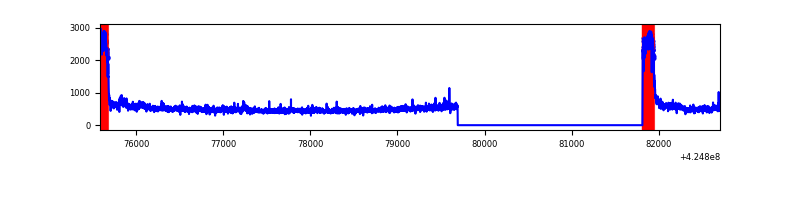 |
| D | 7119 | 4997 | 926 | 926 | 13.01% | 18.53% | 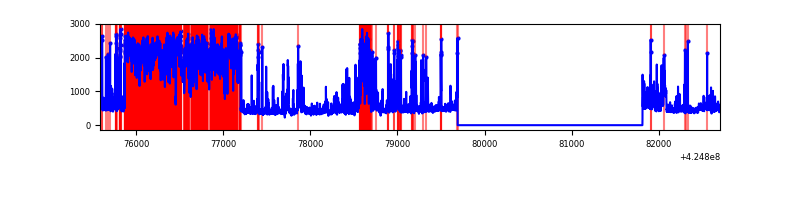 |
Top three noisy pixels from each quadrant. If the there are fewer than three noisy pixels in the level2.evt file, extra rows are filled as -1
| Pixel properties | Quadrant properties | ||||||
|---|---|---|---|---|---|---|---|
| Quadrant | DetID | PixID | Counts | Sigma | Mean | Median | Sigma |
| A | 10 | 83 | 524278 | 4521.42 | 558 | 548 | 115.8 |
| A | 2 | 79 | 31104 | 263.79 | 558 | 548 | 115.8 |
| A | 13 | 254 | 8327 | 67.16 | 558 | 548 | 115.8 |
| B | 5 | 255 | 93997 | 878.76 | 550 | 536 | 106.4 |
| B | 0 | 186 | 91272 | 853.14 | 550 | 536 | 106.4 |
| B | 0 | 245 | 88107 | 823.38 | 550 | 536 | 106.4 |
| C | 0 | 10 | 704047 | 5816.4 | 518 | 522 | 121.0 |
| C | 15 | 214 | 213603 | 1761.65 | 518 | 522 | 121.0 |
| C | 14 | 67 | 15166 | 121.07 | 518 | 522 | 121.0 |
| D | 12 | 79 | 2152669 | 16343.1 | 527 | 512 | 131.7 |
| D | 13 | 249 | 252698 | 1915.06 | 527 | 512 | 131.7 |
| D | 2 | 120 | 245216 | 1858.24 | 527 | 512 | 131.7 |
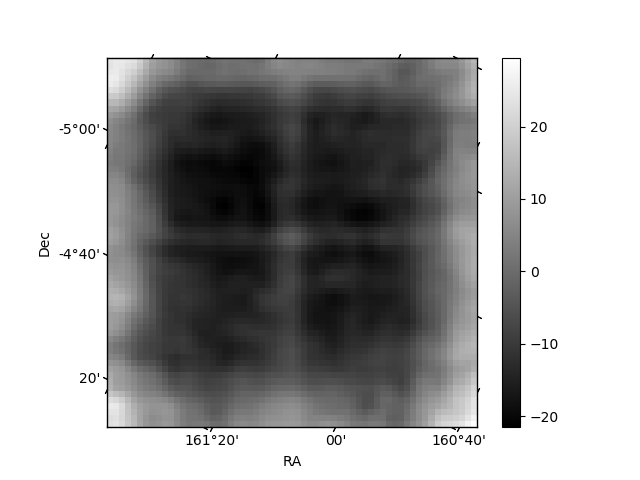
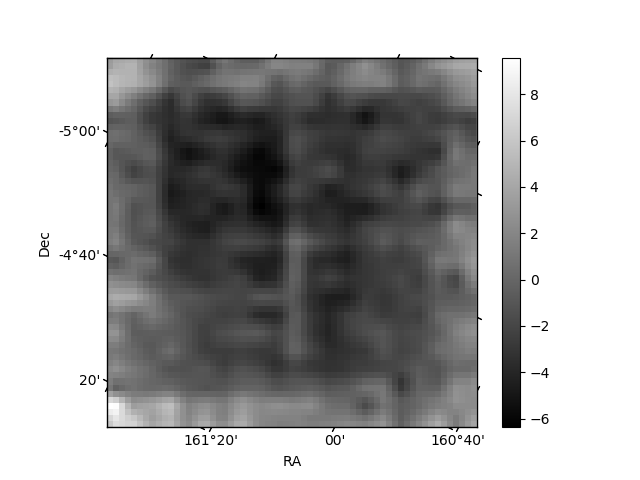
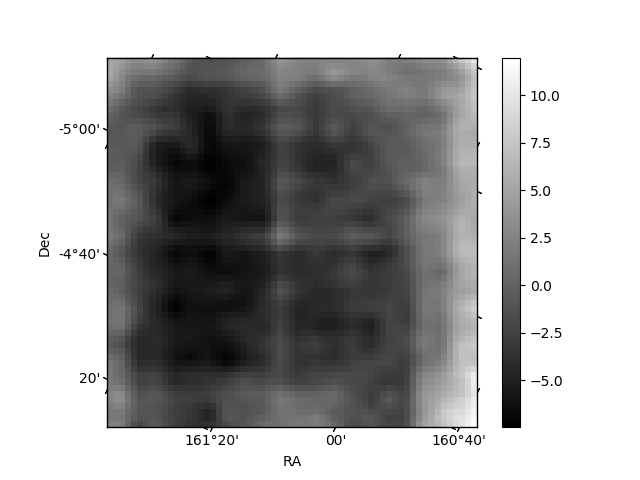
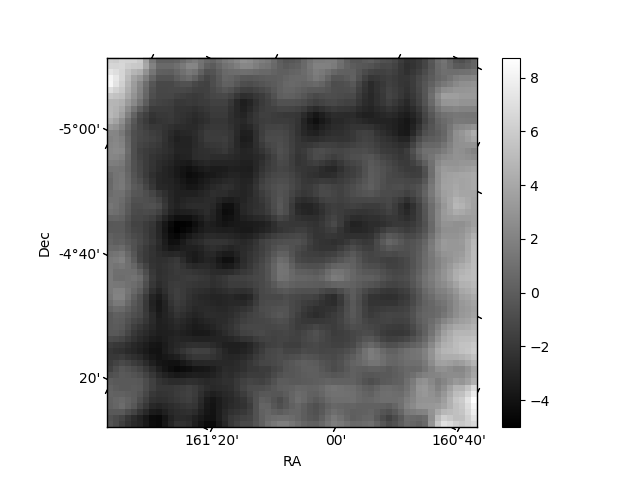
Histogram calculated using DETX and DETY for each event in the final _common_clean file
| Quadrant A | 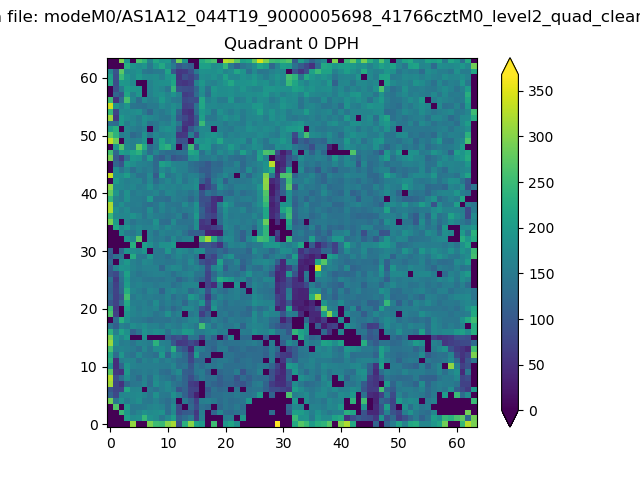 |
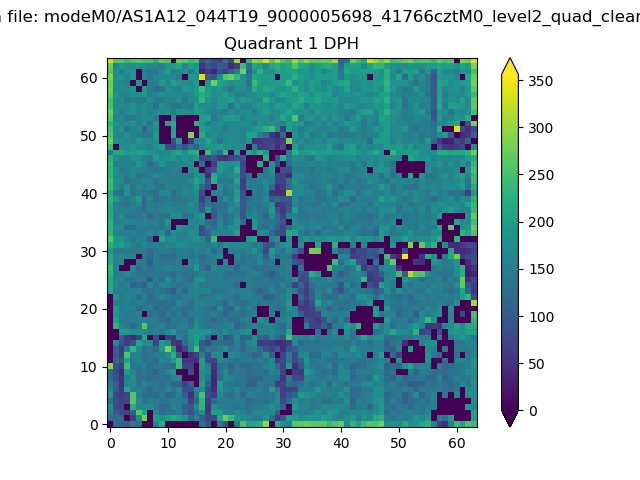 |
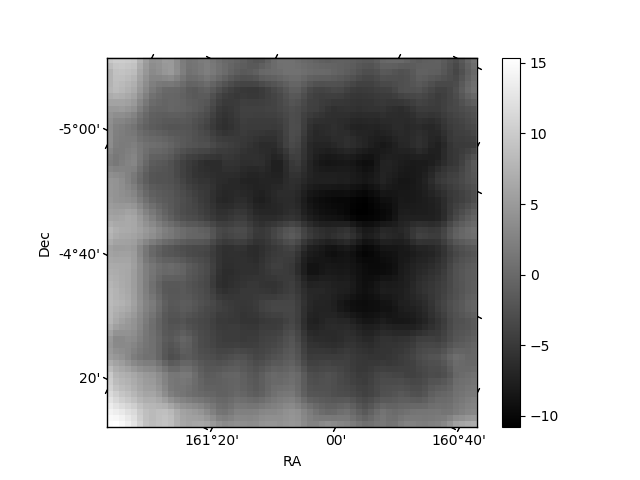
Quadrant B |
|---|---|---|---|
| Quadrant D | 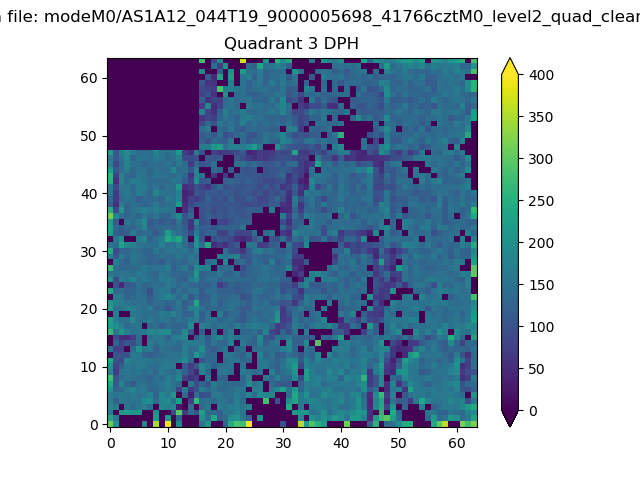 |
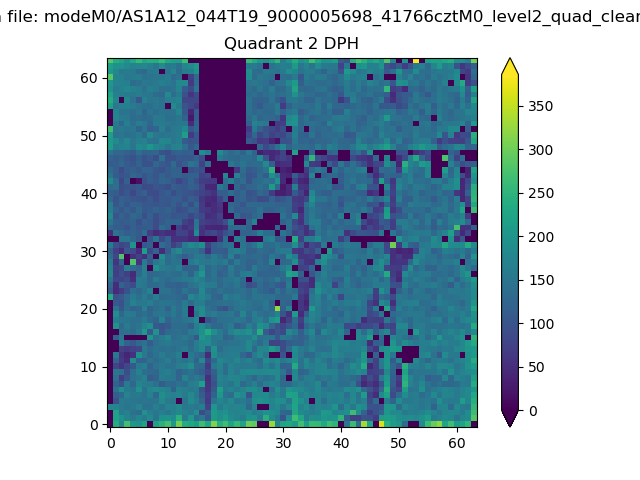 |
Quadrant C |
| Plot type | Count rate plots | Images |
|---|---|---|
| Comparison with Poisson distribution Blue bars denote a histogram of data divided into 1 sec bins. Red curve is a Poisson curve with rate = median count rate of data. |
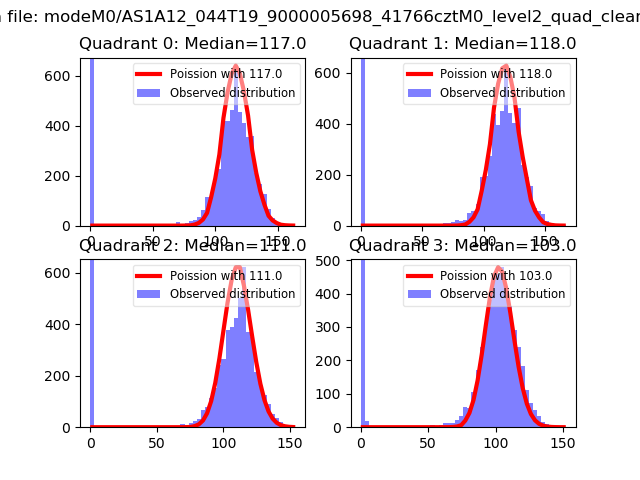 |
 |
| Quadrant-wise count rates Data is divided into 100 sec bins |
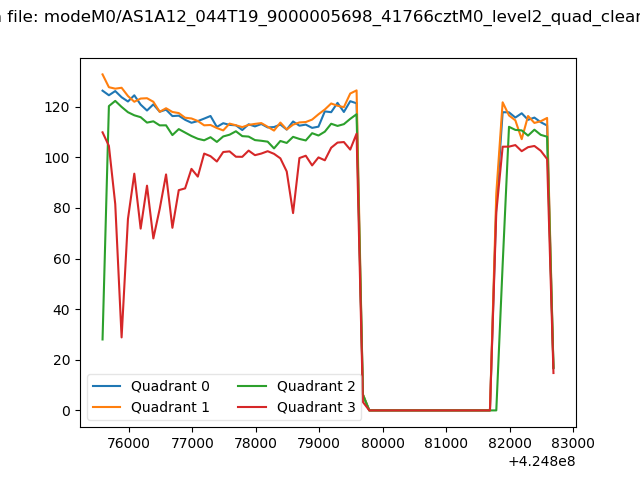 |
|
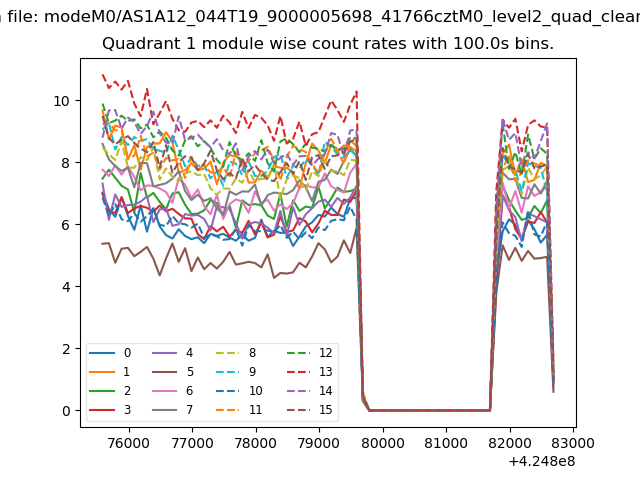
| Module-wise count rates for Quadrant A Data is divided into 100 sec bins |
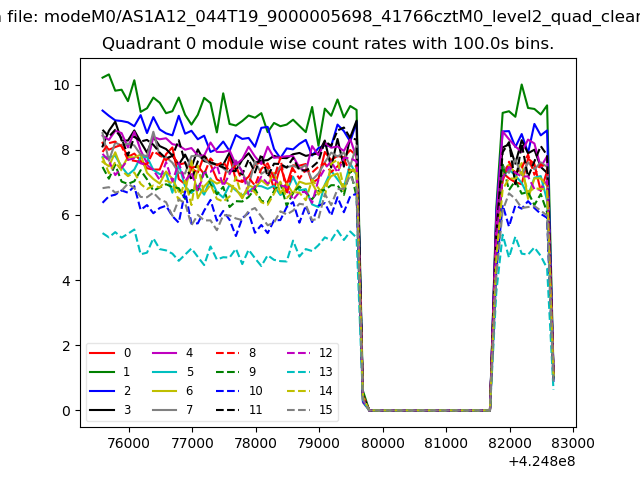 |
 |
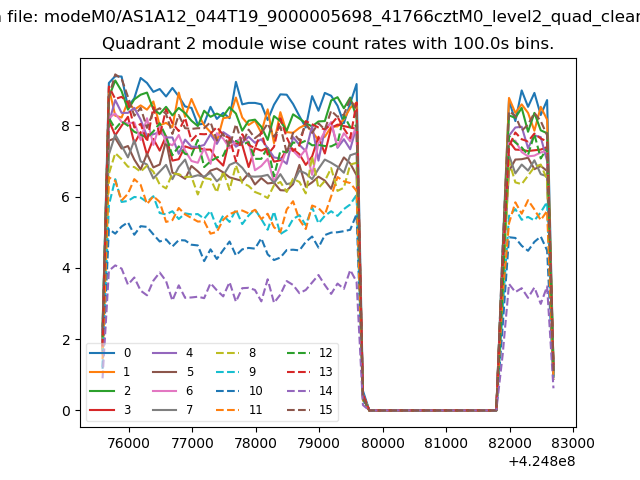
| Module-wise count rates for Quadrant B Data is divided into 100 sec bins |
 |
 |
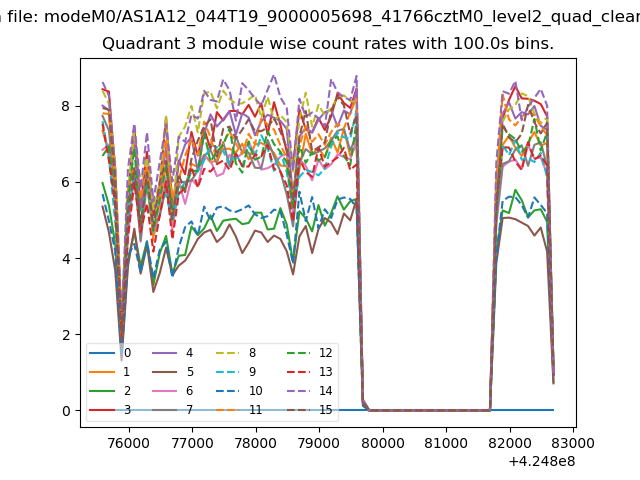
| Module-wise count rates for Quadrant C Data is divided into 100 sec bins |
 |
 |
| Module-wise count rates for Quadrant D Data is divided into 100 sec bins |
 |
 |
| Parameter | Plot |
|---|---|
| CZT HV Monitor | 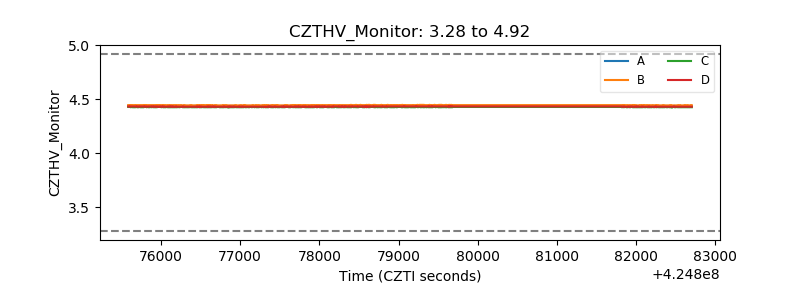 |
| D_VDD | 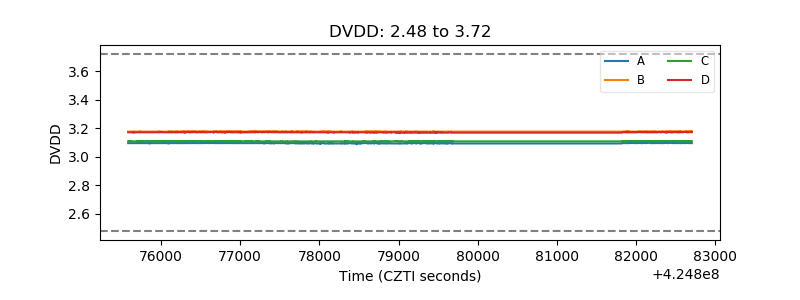 |
| Temperature 1 | 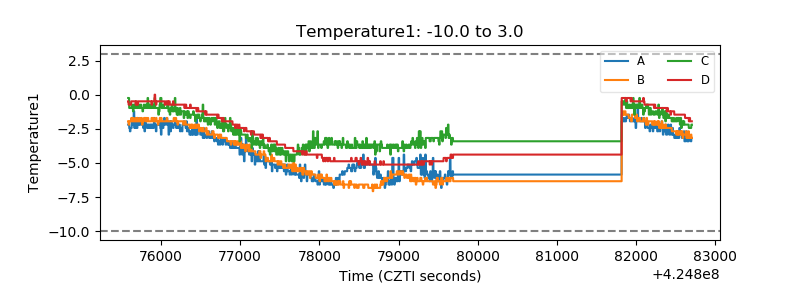 |
| Veto HV Monitor | 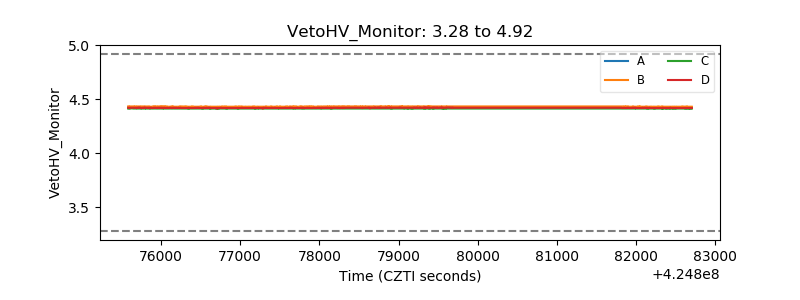 |
| Veto LLD | 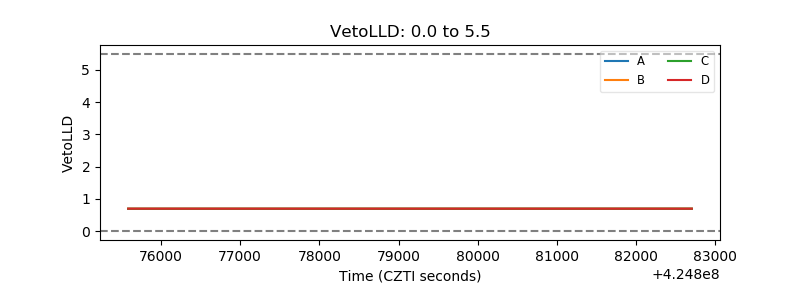 |
| Alpha Counter | 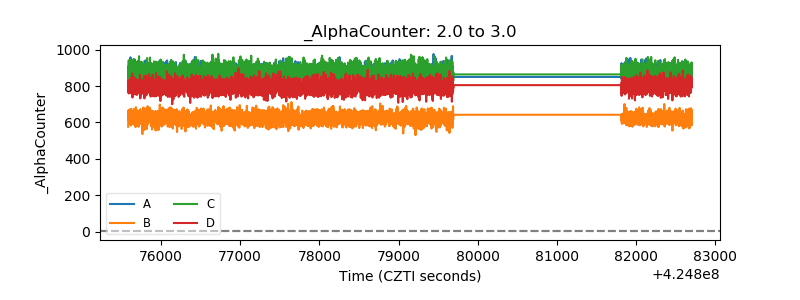 |
| _CPM_Rate | 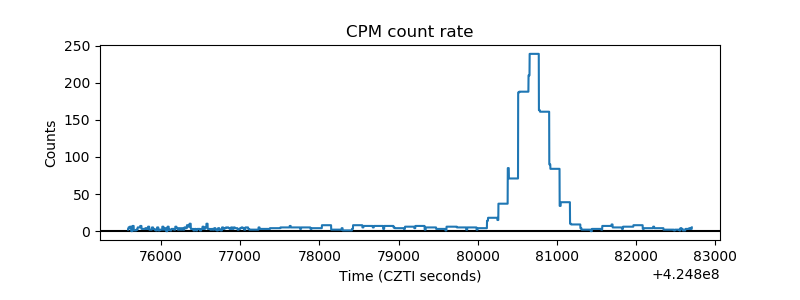 |
| CZT Counter | 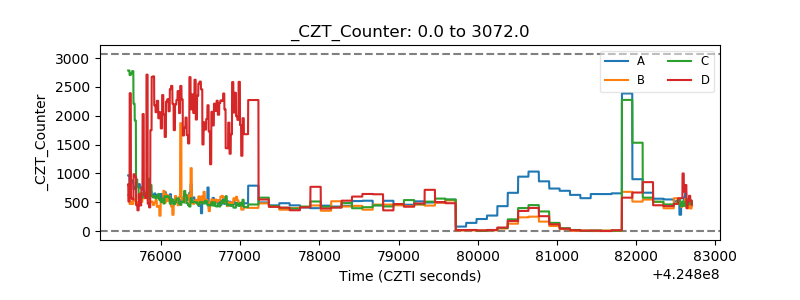 |
| +2.5 Volts monitor | 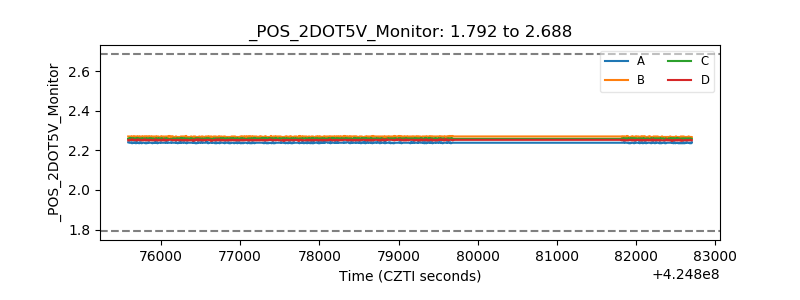 |
| +5 Volts monitor | 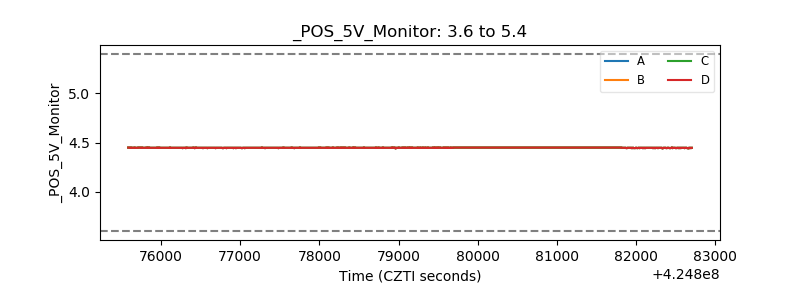 |
| _ROLL_ROT | 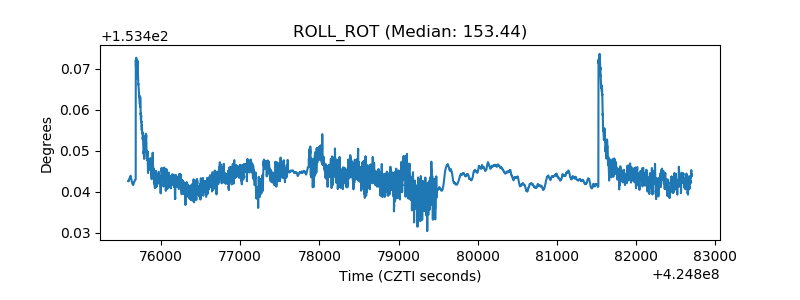 |
| _Roll_DEC | 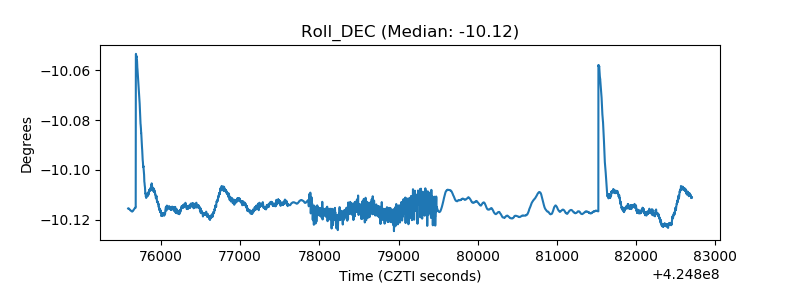 |
| _Roll_RA | 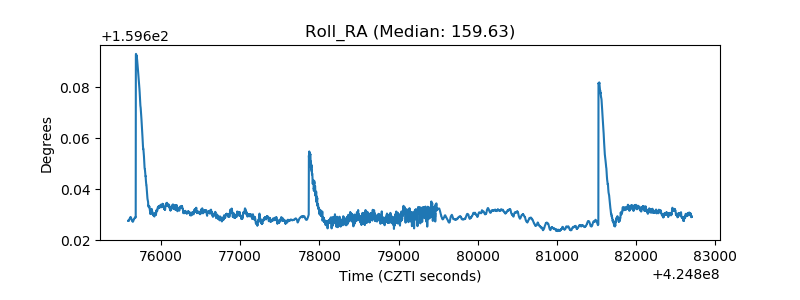 |
| Veto Counter | 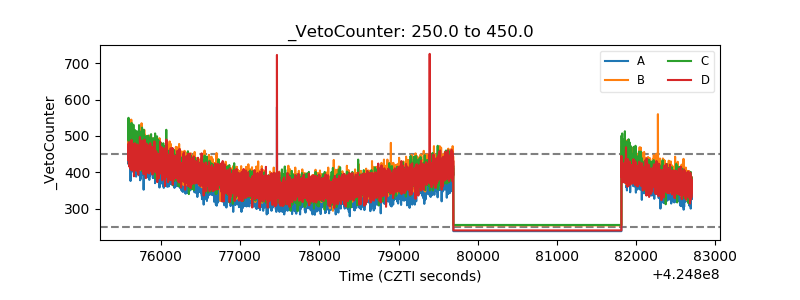 |