| Param | Original file | Final file |
|---|---|---|
| Filename | modeM0/AS1A12_044T19_9000005698_41767cztM0_level2.fits | modeM0/AS1A12_044T19_9000005698_41767cztM0_level2_quad_clean.evt |
| Size (bytes) | 328,141,440 | 83,589,120 |
| Size | 312.9 MB | 79.7 MB |
| Events in quadrant A | 2,967,045 | 564,877 |
| Events in quadrant B | 2,519,780 | 576,659 |
| Events in quadrant C | 3,075,505 | 524,477 |
| Events in quadrant D | 3,184,633 | 505,592 |
| Mode SS | |||
|---|---|---|---|
| Quadrant | BADHDUFLAG | Total packets | Discarded packets |
| A | 0 | 104 | 0 |
| B | 0 | 104 | 0 |
| C | 0 | 104 | 0 |
| D | 0 | 104 | 0 |
| Mode M0 | |||
|---|---|---|---|
| Quadrant | BADHDUFLAG | Total packets | Discarded packets |
| A | 0 | 11877 | 2 |
| B | 0 | 11042 | 2 |
| C | 0 | 12326 | 2 |
| D | 0 | 13031 | 2 |
| Mode M9 | |||
|---|---|---|---|
| Quadrant | BADHDUFLAG | Total packets | Discarded packets |
| A | 0 | 23 | 0 |
| B | 0 | 24 | 0 |
| C | 0 | 24 | 0 |
| D | 0 | 24 | 0 |
| Quadrant | Total seconds | Saturated seconds | Saturation percentage |
|---|---|---|---|
| A | 5132 | 67 | 1.305534% |
| B | 5132 | 22 | 0.428683% |
| C | 5132 | 251 | 4.890881% |
| D | 5132 | 118 | 2.299299% |
Noise dominated data is calculated using 1-second bins in cleaned event files. If a bin has >2000 counts, and if more than 50% of those come from <1% of pixels, then it is considered to be noise-dominated and hence unusable.
| Quadrant | # 1 sec bins | Bins with >0 counts | Bins with >2000 counts | High rate bins dominated by noise | Noise dominated (total time) | Noise dominated (detector-on time) | Marked lightcurve |
|---|---|---|---|---|---|---|---|
| A | 7076 | 5133 | 65 | 65 | 0.92% | 1.27% | 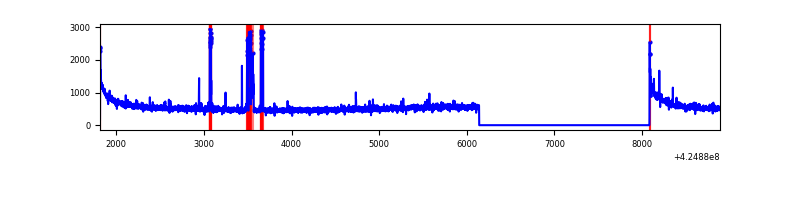 |
| B | 7075 | 5131 | 12 | 12 | 0.17% | 0.23% | 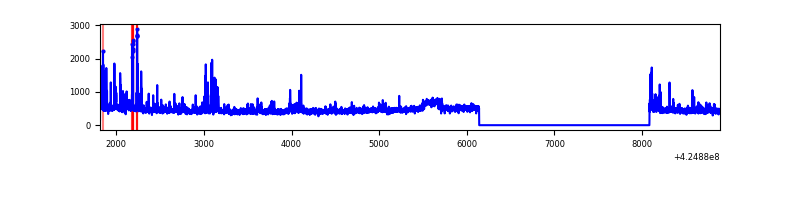 |
| C | 7075 | 5131 | 239 | 239 | 3.38% | 4.66% | 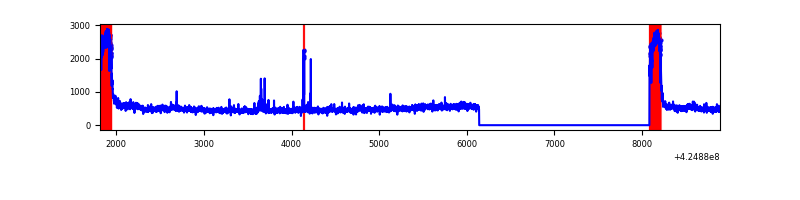 |
| D | 7075 | 5132 | 123 | 123 | 1.74% | 2.40% | 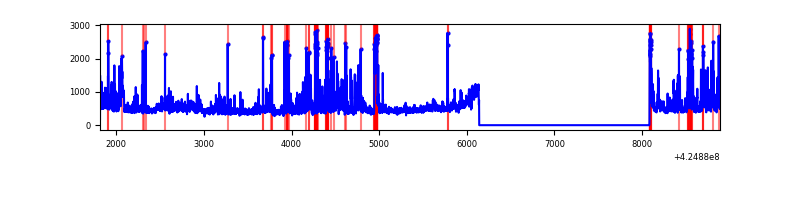 |
Top three noisy pixels from each quadrant. If the there are fewer than three noisy pixels in the level2.evt file, extra rows are filled as -1
| Pixel properties | Quadrant properties | ||||||
|---|---|---|---|---|---|---|---|
| Quadrant | DetID | PixID | Counts | Sigma | Mean | Median | Sigma |
| A | 10 | 83 | 561681 | 4830.28 | 559 | 548 | 116.2 |
| A | 7 | 16 | 108616 | 930.26 | 559 | 548 | 116.2 |
| A | 15 | 223 | 79969 | 683.66 | 559 | 548 | 116.2 |
| B | 5 | 255 | 104888 | 966.89 | 556 | 541 | 107.9 |
| B | 0 | 245 | 79223 | 729.07 | 556 | 541 | 107.9 |
| B | 15 | 35 | 34936 | 318.71 | 556 | 541 | 107.9 |
| C | 0 | 10 | 786817 | 6416.28 | 519 | 522 | 122.5 |
| C | 15 | 214 | 215479 | 1754.08 | 519 | 522 | 122.5 |
| C | 14 | 254 | 20255 | 161.02 | 519 | 522 | 122.5 |
| D | 13 | 249 | 361858 | 2724.56 | 537 | 522 | 132.6 |
| D | 2 | 120 | 197051 | 1481.88 | 537 | 522 | 132.6 |
| D | 2 | 249 | 171180 | 1286.8 | 537 | 522 | 132.6 |
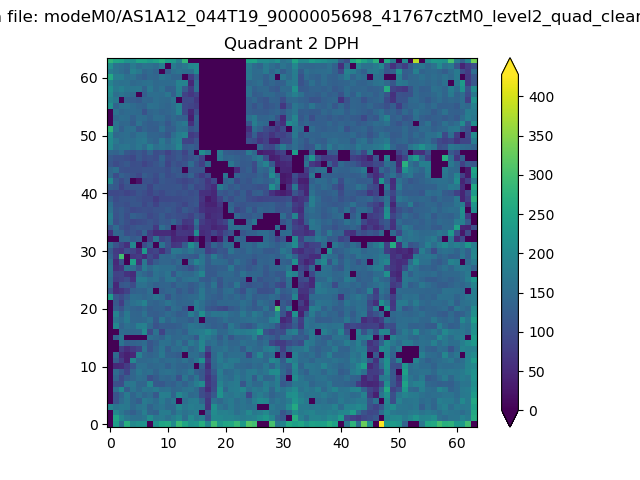
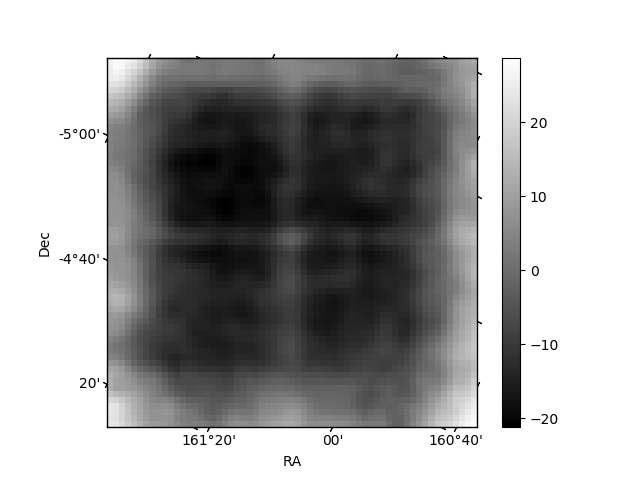
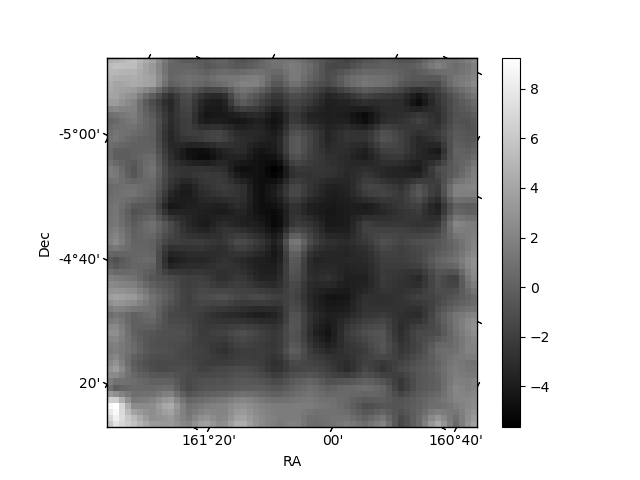
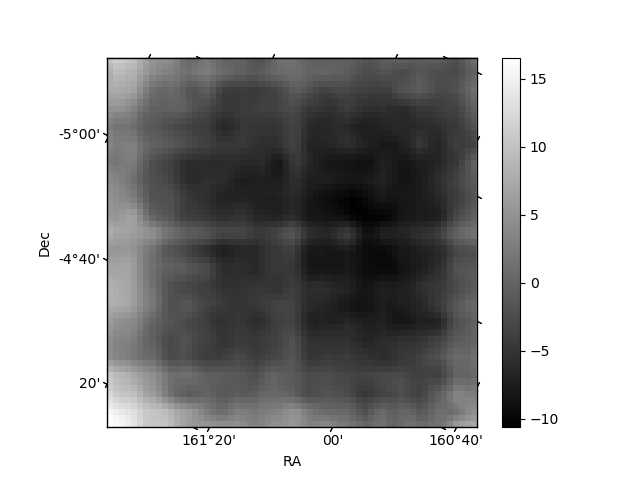
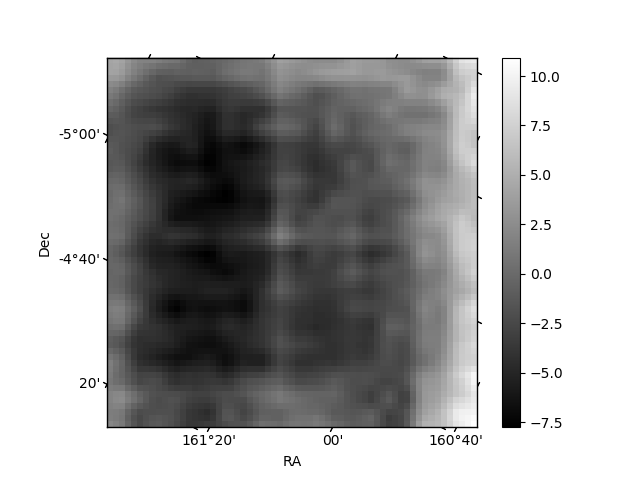
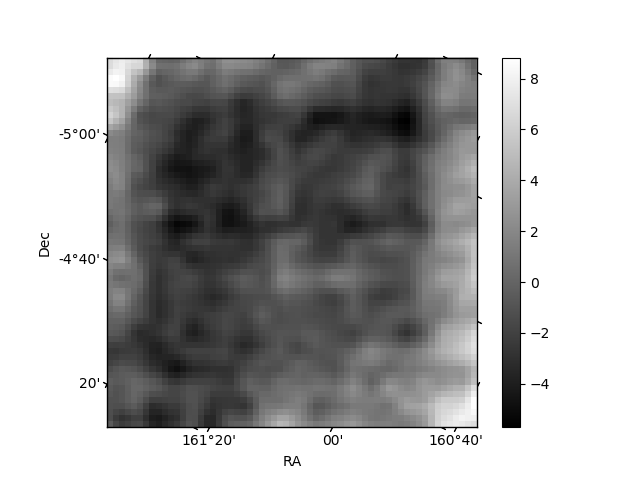
Histogram calculated using DETX and DETY for each event in the final _common_clean file
| Quadrant A | 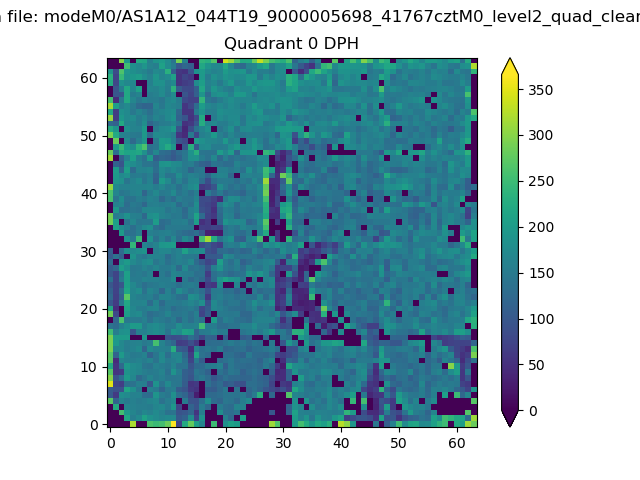 |
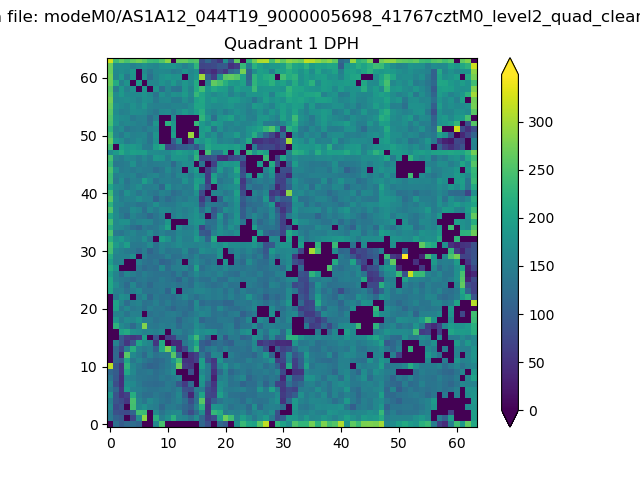 |
Quadrant B |
|---|---|---|---|
| Quadrant D | 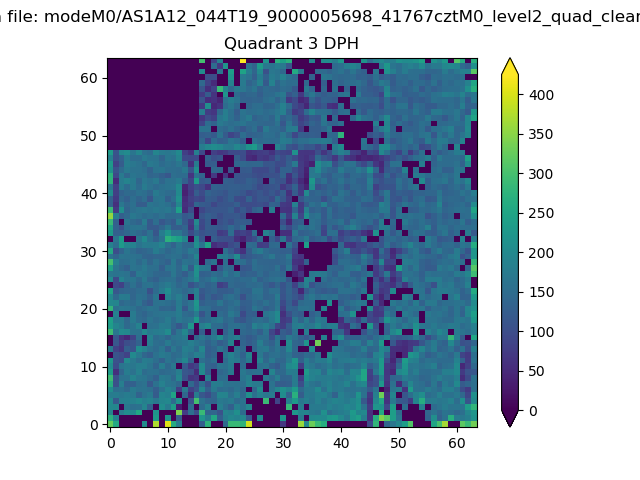 |
 |
Quadrant C |
| Plot type | Count rate plots | Images |
|---|---|---|
| Comparison with Poisson distribution Blue bars denote a histogram of data divided into 1 sec bins. Red curve is a Poisson curve with rate = median count rate of data. |
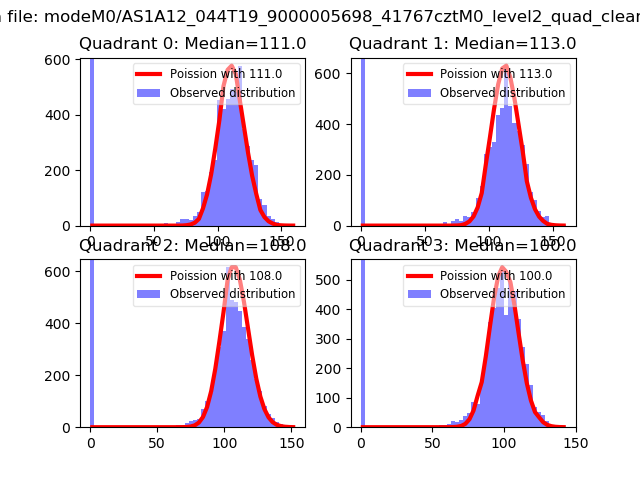 |
 |
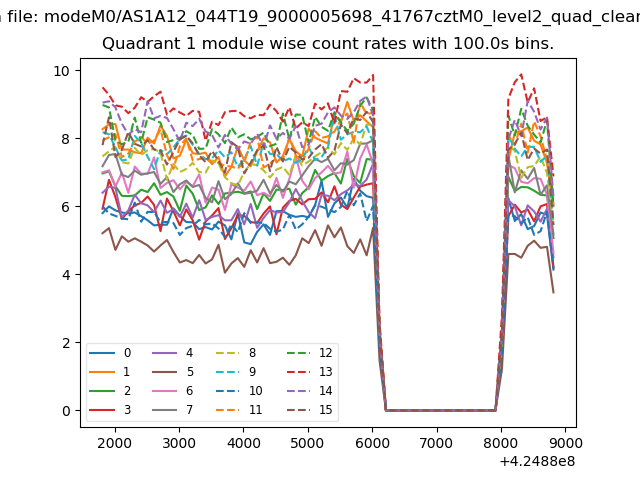
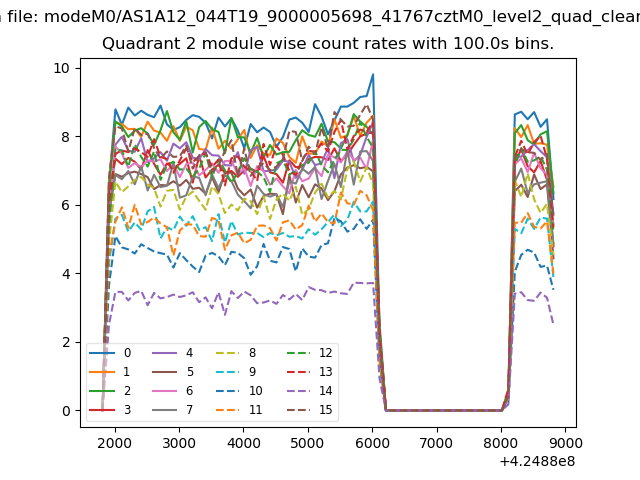
| Quadrant-wise count rates Data is divided into 100 sec bins |
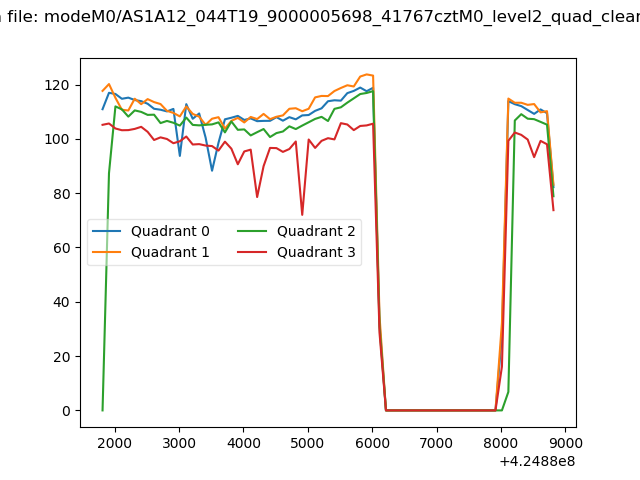 |
|
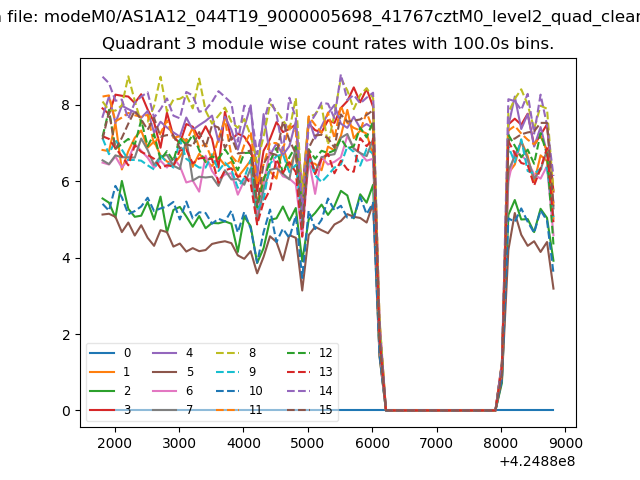
| Module-wise count rates for Quadrant A Data is divided into 100 sec bins |
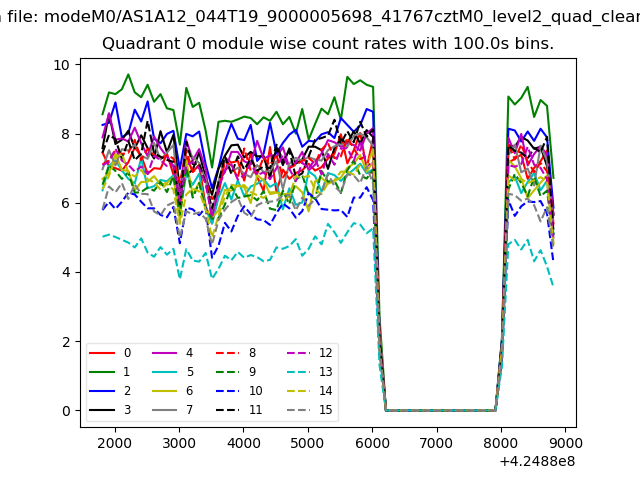 |
 |
| Module-wise count rates for Quadrant B Data is divided into 100 sec bins |
 |
 |
| Module-wise count rates for Quadrant C Data is divided into 100 sec bins |
 |
 |
| Module-wise count rates for Quadrant D Data is divided into 100 sec bins |
 |
 |
| Parameter | Plot |
|---|---|
| CZT HV Monitor | 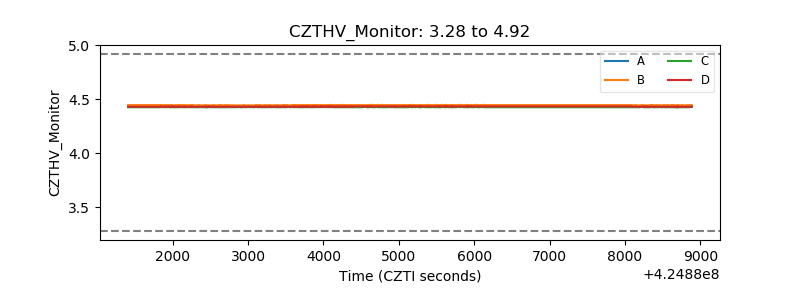 |
| D_VDD | 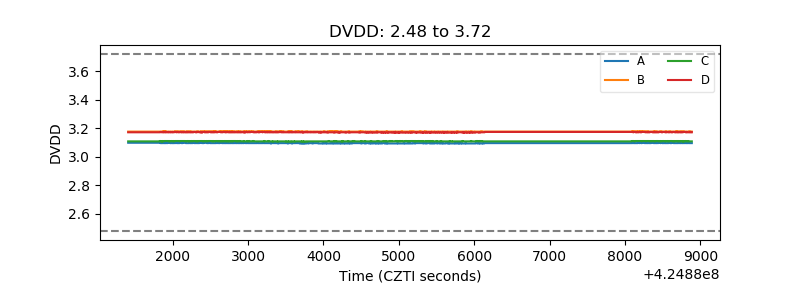 |
| Temperature 1 | 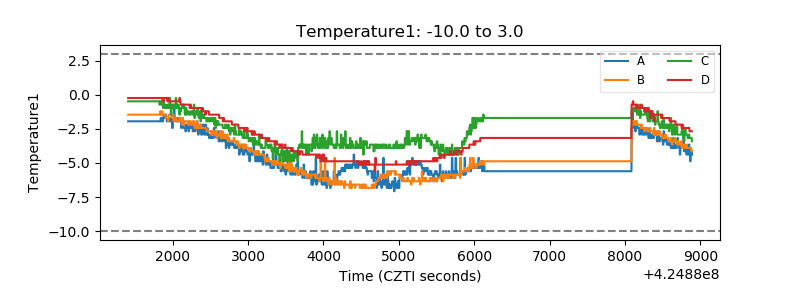 |
| Veto HV Monitor | 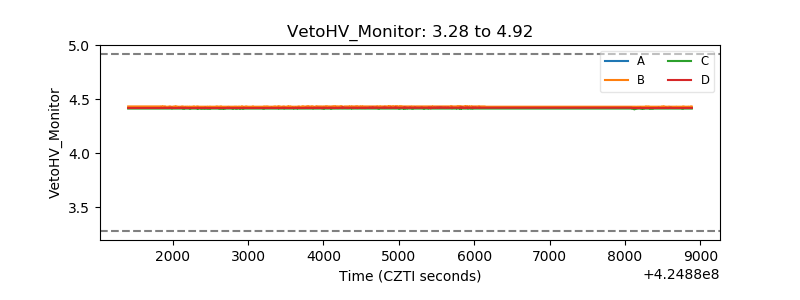 |
| Veto LLD | 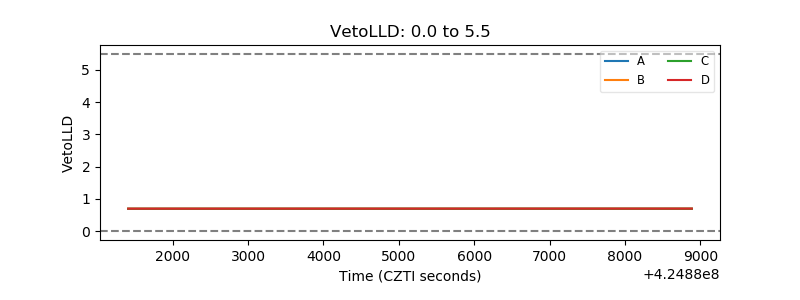 |
| Alpha Counter | 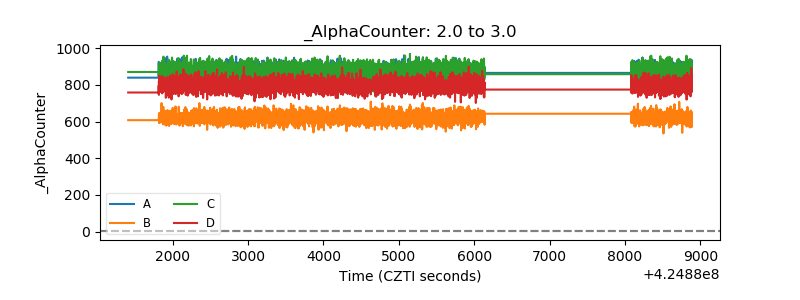 |
| _CPM_Rate | 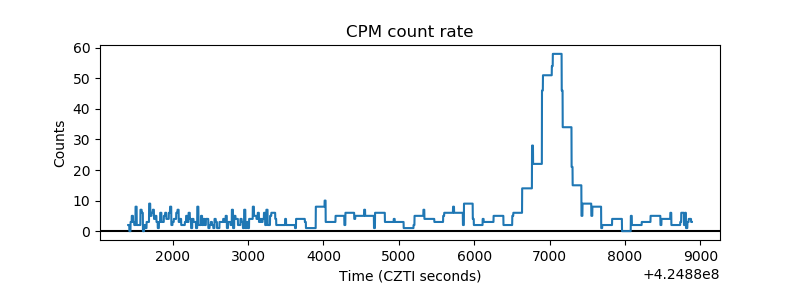 |
| CZT Counter | 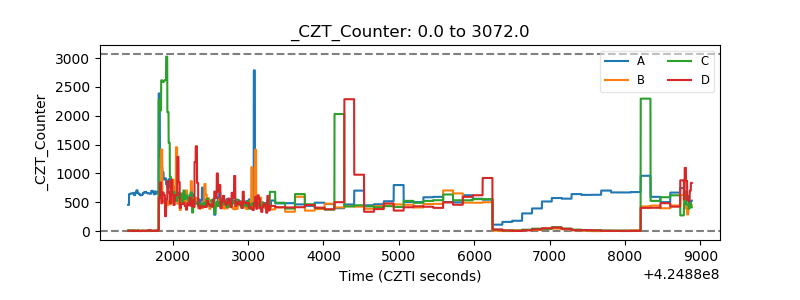 |
| +2.5 Volts monitor | 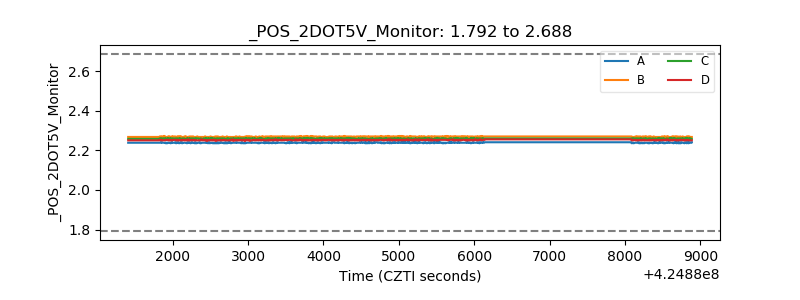 |
| +5 Volts monitor | 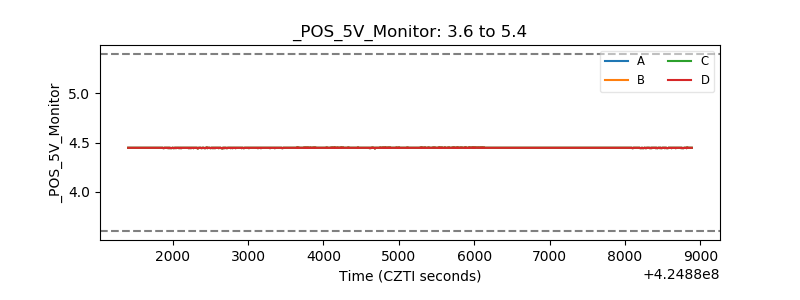 |
| _ROLL_ROT | 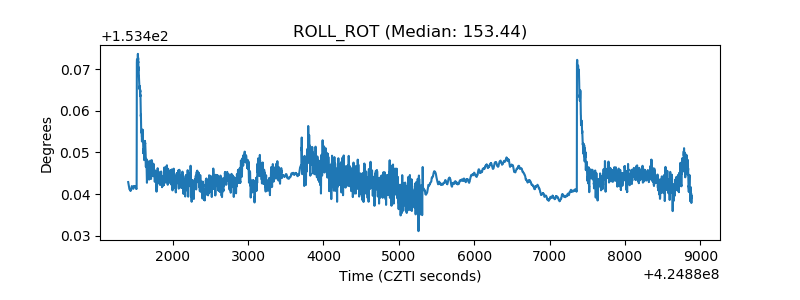 |
| _Roll_DEC | 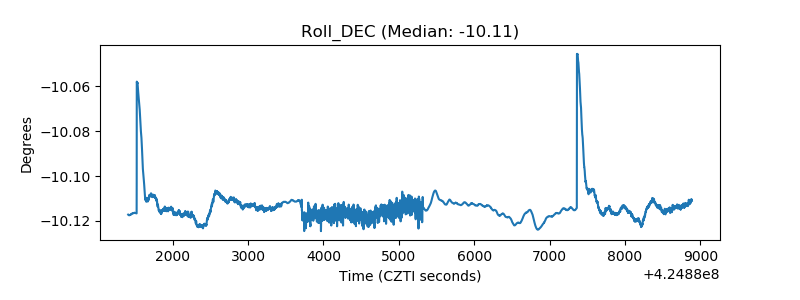 |
| _Roll_RA | 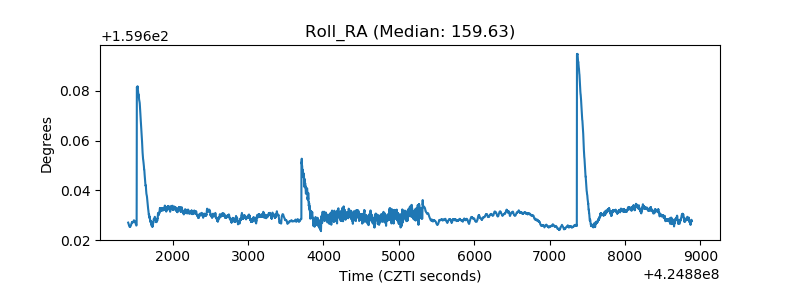 |
| Veto Counter | 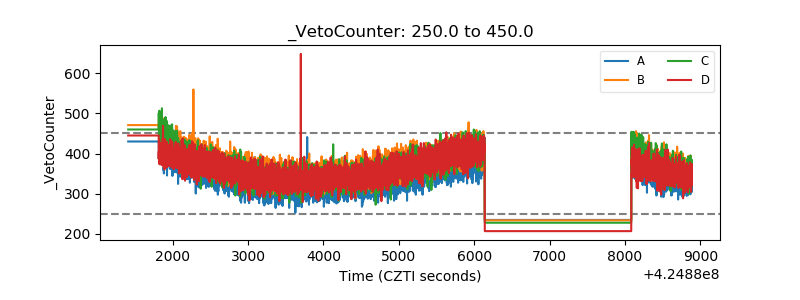 |