| Param | Original file | Final file |
|---|---|---|
| Filename | modeM0/AS1A12_044T19_9000005698_41768cztM0_level2.fits | modeM0/AS1A12_044T19_9000005698_41768cztM0_level2_quad_clean.evt |
| Size (bytes) | 340,663,680 | 87,886,080 |
| Size | 324.9 MB | 83.8 MB |
| Events in quadrant A | 2,955,372 | 597,025 |
| Events in quadrant B | 2,649,027 | 606,319 |
| Events in quadrant C | 3,159,771 | 550,183 |
| Events in quadrant D | 3,422,518 | 527,048 |
| Mode SS | |||
|---|---|---|---|
| Quadrant | BADHDUFLAG | Total packets | Discarded packets |
| A | 0 | 110 | 0 |
| B | 0 | 110 | 0 |
| C | 0 | 110 | 0 |
| D | 0 | 110 | 0 |
| Mode M0 | |||
|---|---|---|---|
| Quadrant | BADHDUFLAG | Total packets | Discarded packets |
| A | 0 | 12030 | 2 |
| B | 0 | 11586 | 2 |
| C | 0 | 12786 | 2 |
| D | 0 | 13885 | 2 |
| Mode M9 | |||
|---|---|---|---|
| Quadrant | BADHDUFLAG | Total packets | Discarded packets |
| A | 0 | 24 | 0 |
| B | 0 | 25 | 0 |
| C | 0 | 25 | 0 |
| D | 0 | 25 | 0 |
| Quadrant | Total seconds | Saturated seconds | Saturation percentage |
|---|---|---|---|
| A | 5437 | 16 | 0.294280% |
| B | 5437 | 22 | 0.404635% |
| C | 5437 | 241 | 4.432592% |
| D | 5437 | 158 | 2.906014% |
Noise dominated data is calculated using 1-second bins in cleaned event files. If a bin has >2000 counts, and if more than 50% of those come from <1% of pixels, then it is considered to be noise-dominated and hence unusable.
| Quadrant | # 1 sec bins | Bins with >0 counts | Bins with >2000 counts | High rate bins dominated by noise | Noise dominated (total time) | Noise dominated (detector-on time) | Marked lightcurve |
|---|---|---|---|---|---|---|---|
| A | 7019 | 5438 | 7 | 7 | 0.10% | 0.13% | 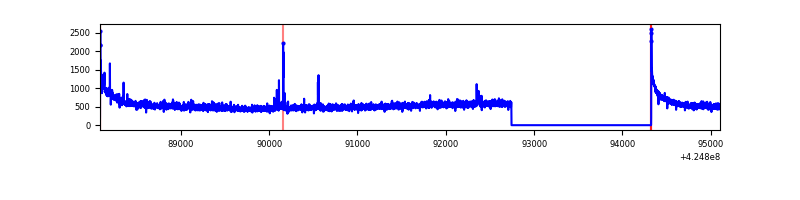 |
| B | 7018 | 5436 | 18 | 18 | 0.26% | 0.33% | 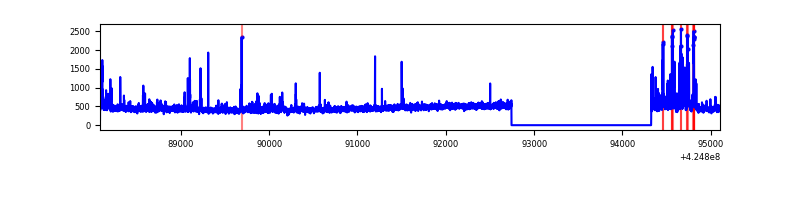 |
| C | 7018 | 5436 | 227 | 227 | 3.23% | 4.18% | 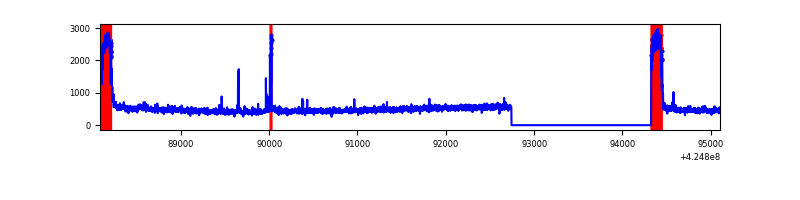 |
| D | 7019 | 5437 | 166 | 166 | 2.37% | 3.05% | 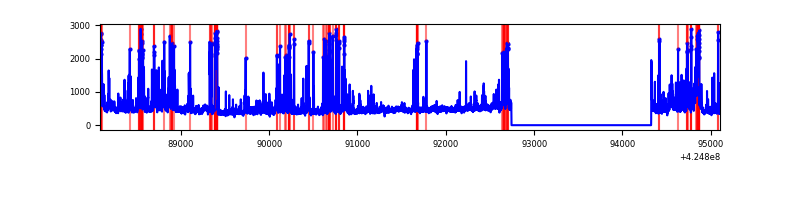 |
Top three noisy pixels from each quadrant. If the there are fewer than three noisy pixels in the level2.evt file, extra rows are filled as -1
| Pixel properties | Quadrant properties | ||||||
|---|---|---|---|---|---|---|---|
| Quadrant | DetID | PixID | Counts | Sigma | Mean | Median | Sigma |
| A | 10 | 83 | 568061 | 4604.64 | 596 | 583 | 123.2 |
| A | 2 | 79 | 34375 | 274.2 | 596 | 583 | 123.2 |
| A | 7 | 3 | 16917 | 132.54 | 596 | 583 | 123.2 |
| B | 5 | 255 | 136956 | 1180.52 | 591 | 574 | 115.5 |
| B | 0 | 245 | 44406 | 379.41 | 591 | 574 | 115.5 |
| B | 0 | 183 | 42388 | 361.94 | 591 | 574 | 115.5 |
| C | 0 | 10 | 700827 | 5348.78 | 557 | 562 | 130.9 |
| C | 15 | 214 | 225970 | 1721.72 | 557 | 562 | 130.9 |
| C | 14 | 254 | 36019 | 270.83 | 557 | 562 | 130.9 |
| D | 2 | 249 | 239464 | 1683.12 | 572 | 556 | 141.9 |
| D | 2 | 120 | 186574 | 1310.51 | 572 | 556 | 141.9 |
| D | 5 | 32 | 161635 | 1134.81 | 572 | 556 | 141.9 |
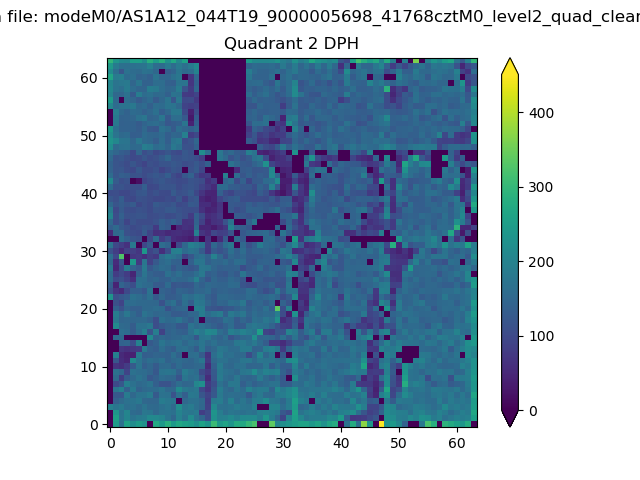
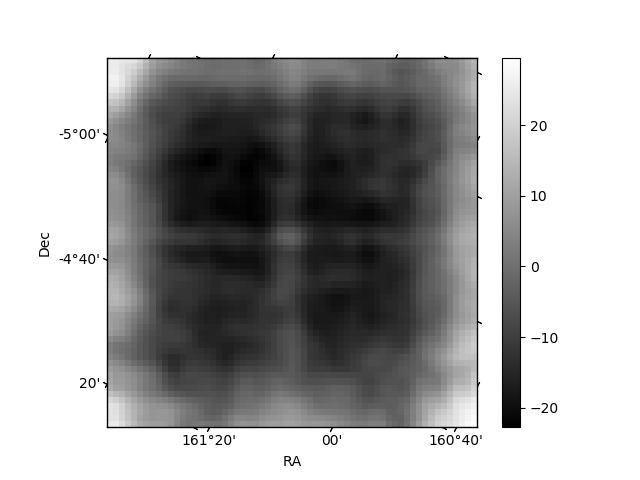
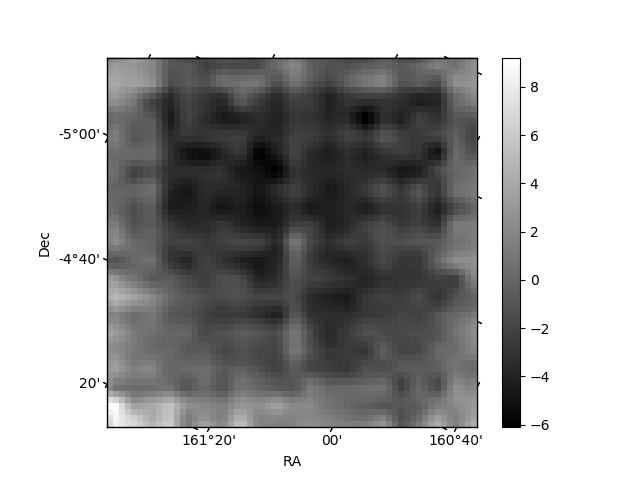
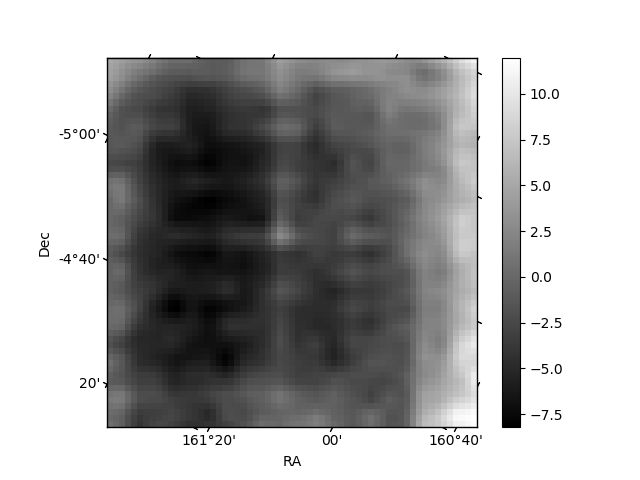
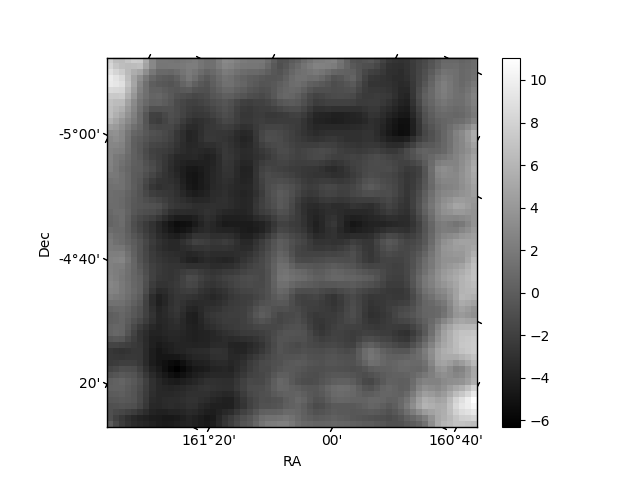
Histogram calculated using DETX and DETY for each event in the final _common_clean file
| Quadrant A | 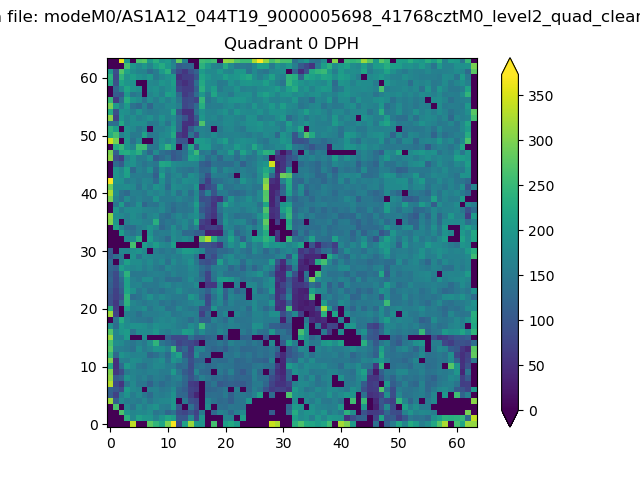 |
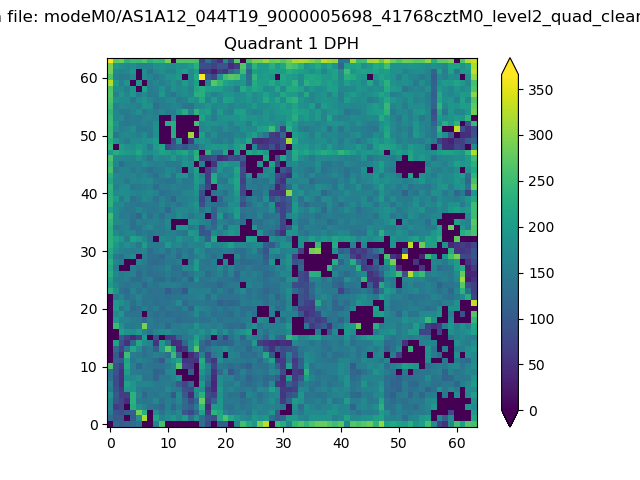 |
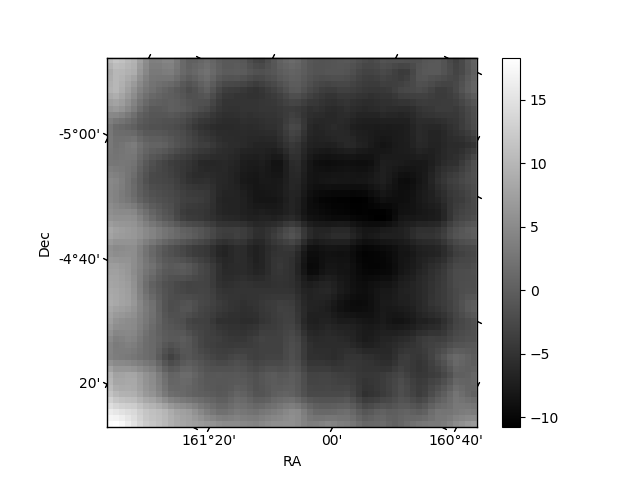
Quadrant B |
|---|---|---|---|
| Quadrant D | 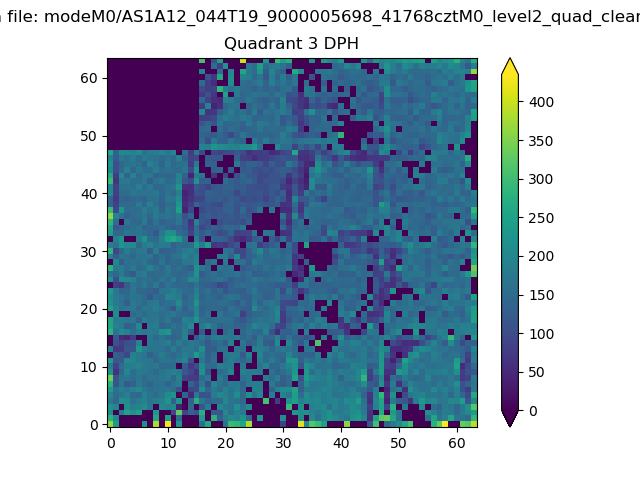 |
 |
Quadrant C |
| Plot type | Count rate plots | Images |
|---|---|---|
| Comparison with Poisson distribution Blue bars denote a histogram of data divided into 1 sec bins. Red curve is a Poisson curve with rate = median count rate of data. |
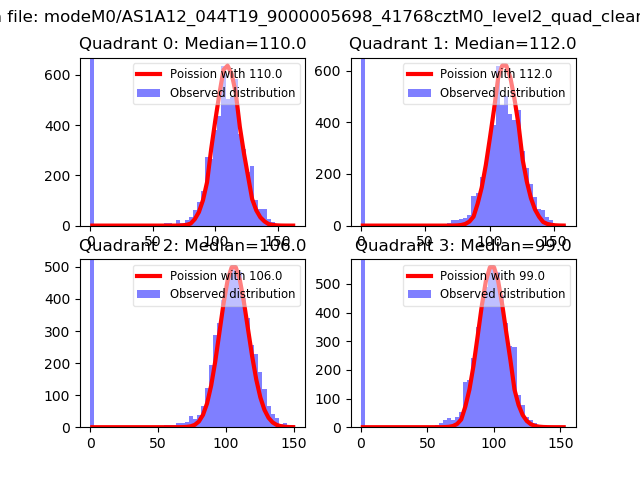 |
 |
| Quadrant-wise count rates Data is divided into 100 sec bins |
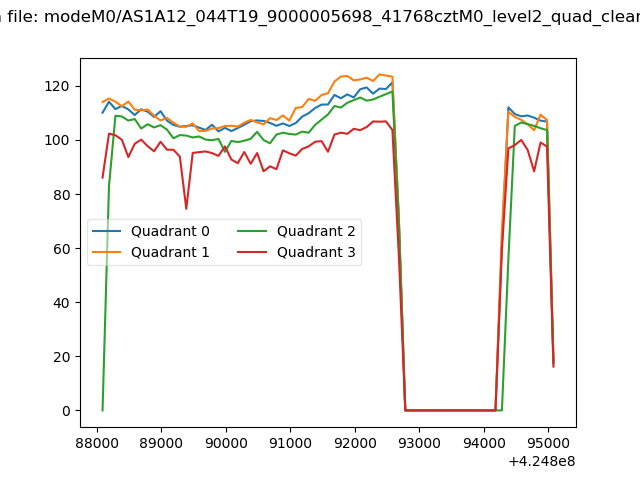 |
|
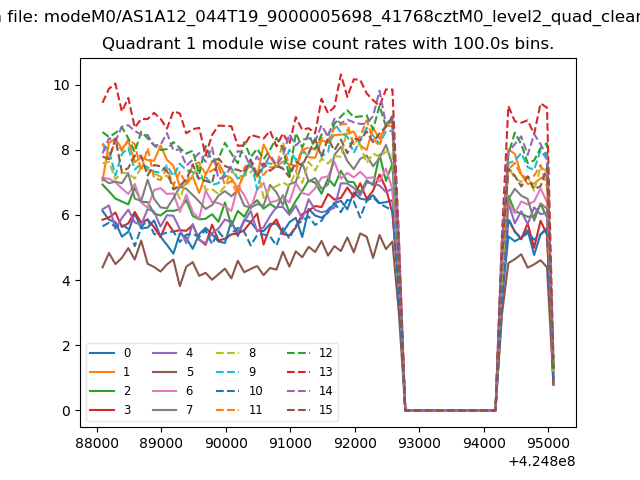
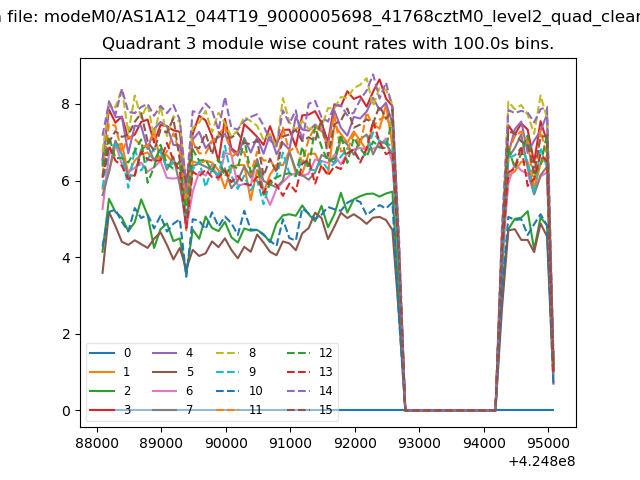
| Module-wise count rates for Quadrant A Data is divided into 100 sec bins |
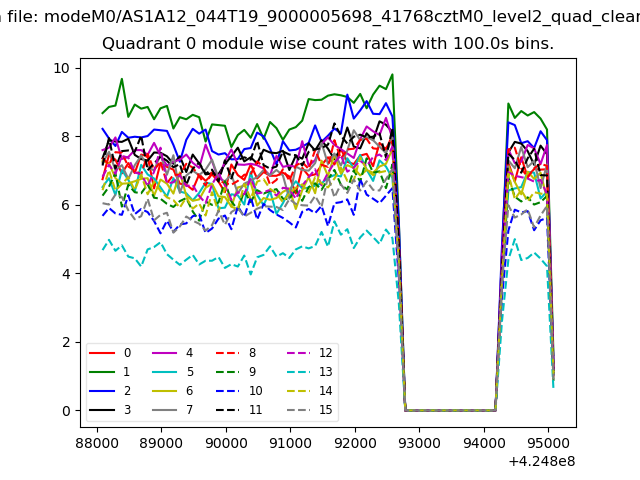 |
 |
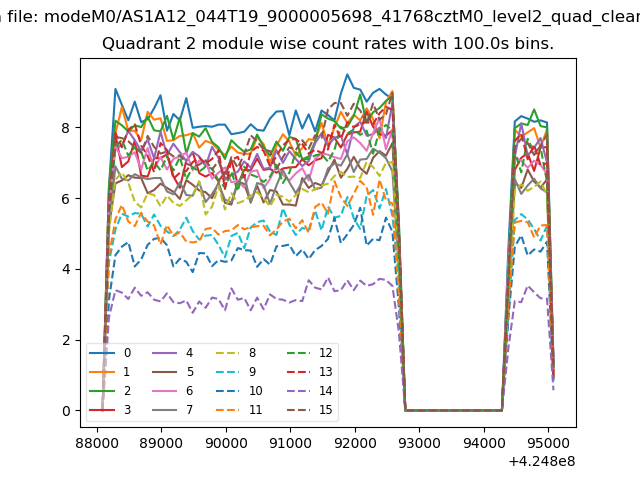
| Module-wise count rates for Quadrant B Data is divided into 100 sec bins |
 |
 |
| Module-wise count rates for Quadrant C Data is divided into 100 sec bins |
 |
 |
| Module-wise count rates for Quadrant D Data is divided into 100 sec bins |
 |
 |
| Parameter | Plot |
|---|---|
| CZT HV Monitor | 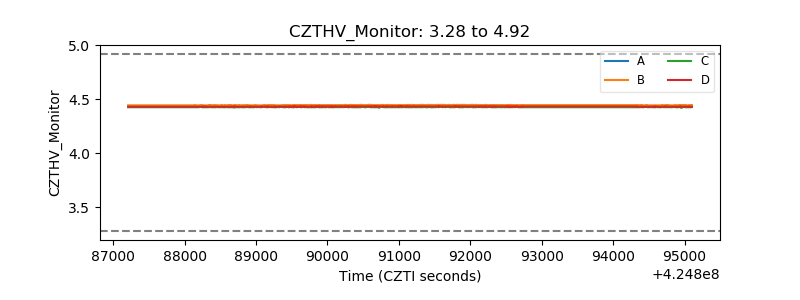 |
| D_VDD | 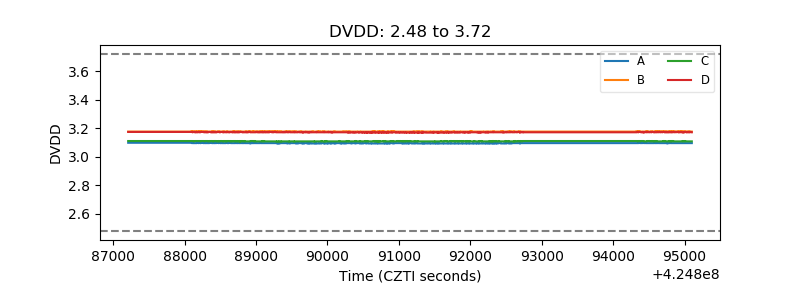 |
| Temperature 1 | 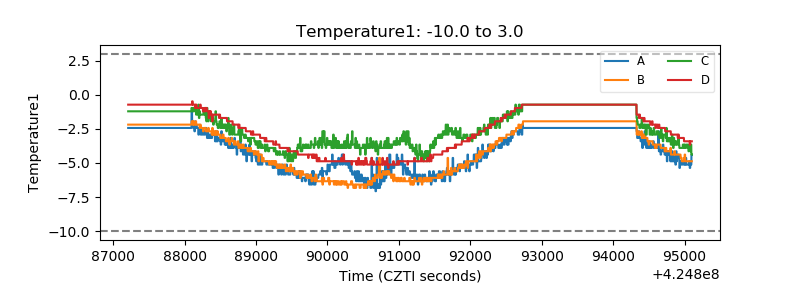 |
| Veto HV Monitor | 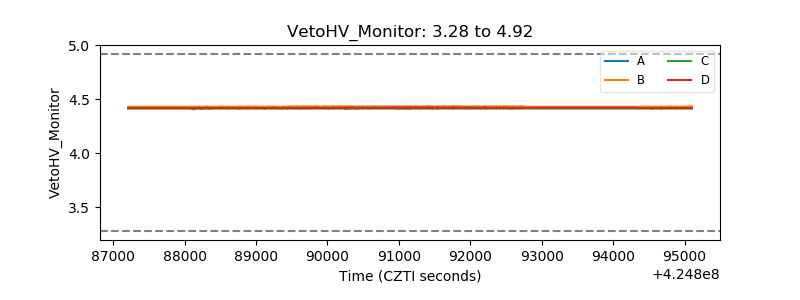 |
| Veto LLD | 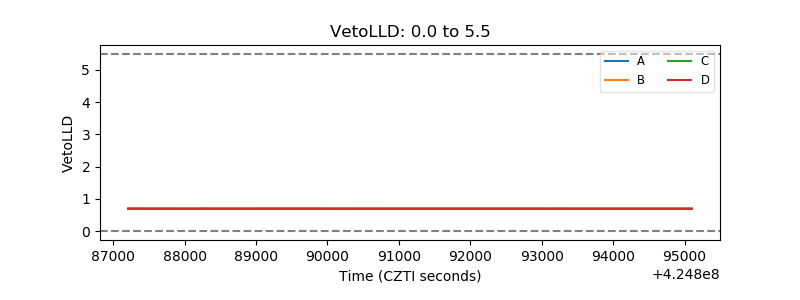 |
| Alpha Counter |  |
| _CPM_Rate | 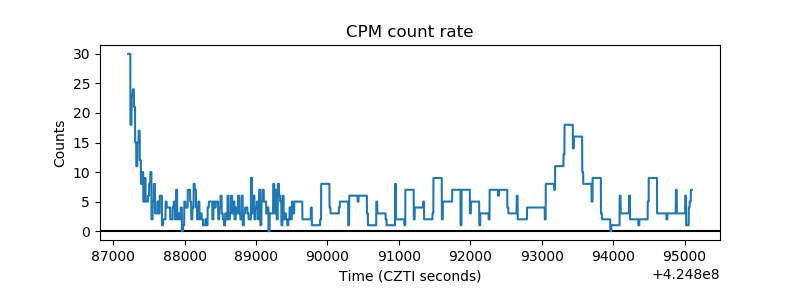 |
| CZT Counter | 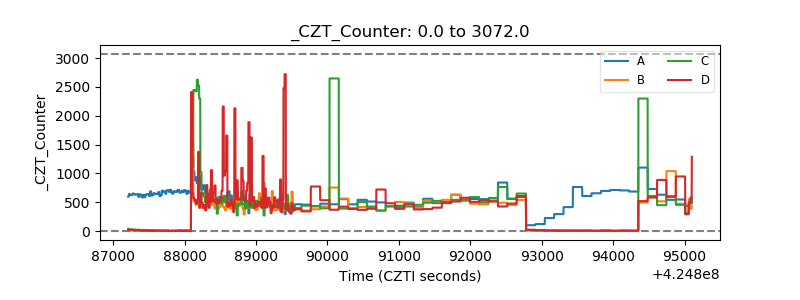 |
| +2.5 Volts monitor | 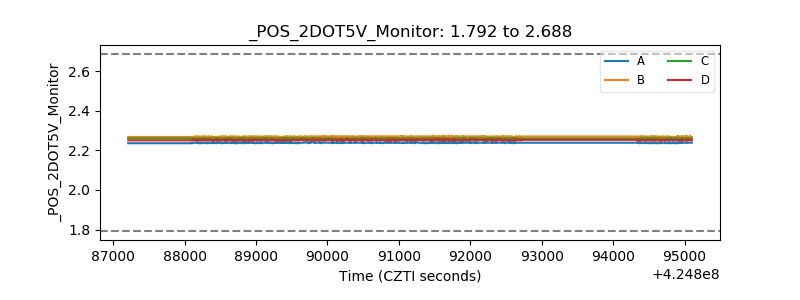 |
| +5 Volts monitor |  |
| _ROLL_ROT | 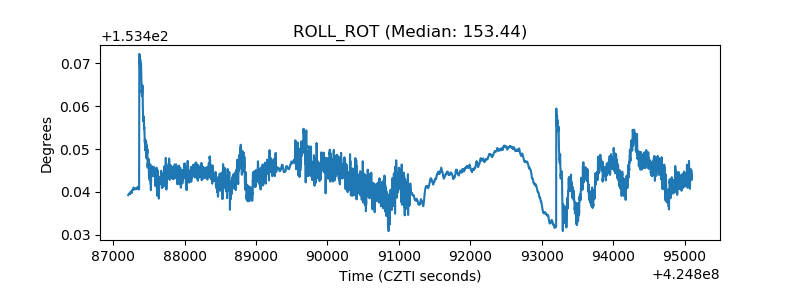 |
| _Roll_DEC | 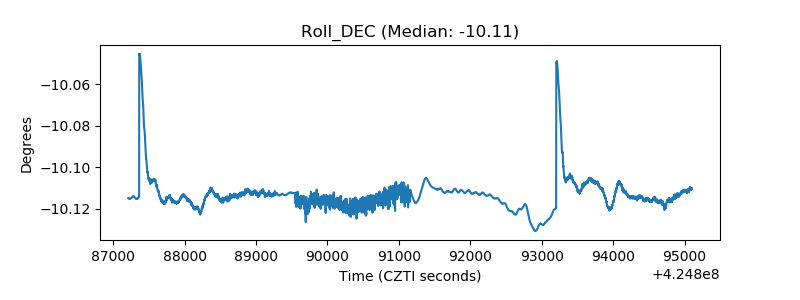 |
| _Roll_RA | 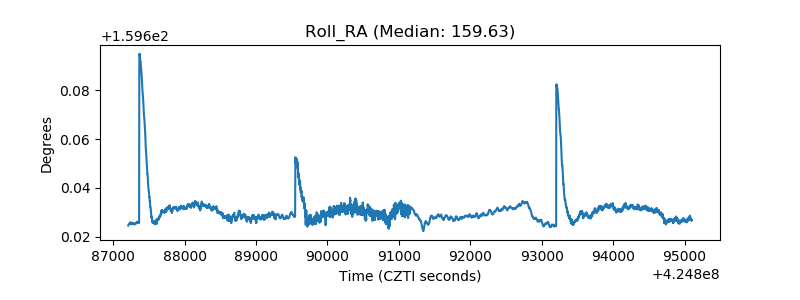 |
| Veto Counter | 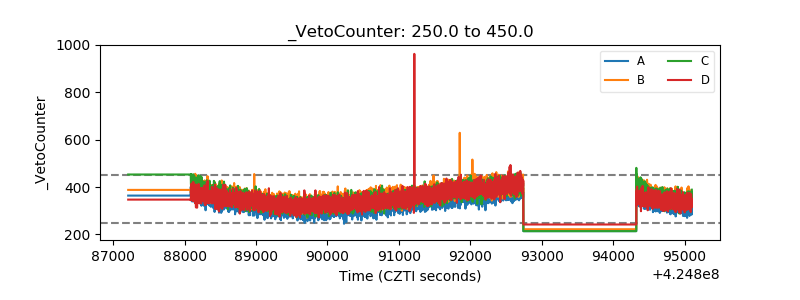 |