| Param | Original file | Final file |
|---|---|---|
| Filename | modeM0/AS1A12_044T19_9000005698_41769cztM0_level2.fits | modeM0/AS1A12_044T19_9000005698_41769cztM0_level2_quad_clean.evt |
| Size (bytes) | 351,601,920 | 94,322,880 |
| Size | 335.3 MB | 90.0 MB |
| Events in quadrant A | 3,108,980 | 636,315 |
| Events in quadrant B | 2,848,712 | 645,018 |
| Events in quadrant C | 3,266,878 | 597,048 |
| Events in quadrant D | 3,332,080 | 566,106 |
| Mode SS | |||
|---|---|---|---|
| Quadrant | BADHDUFLAG | Total packets | Discarded packets |
| A | 0 | 120 | 0 |
| B | 0 | 120 | 0 |
| C | 0 | 120 | 0 |
| D | 0 | 120 | 0 |
| Mode M0 | |||
|---|---|---|---|
| Quadrant | BADHDUFLAG | Total packets | Discarded packets |
| A | 0 | 12788 | 2 |
| B | 0 | 12511 | 2 |
| C | 0 | 13458 | 2 |
| D | 0 | 14129 | 2 |
| Mode M9 | |||
|---|---|---|---|
| Quadrant | BADHDUFLAG | Total packets | Discarded packets |
| A | 0 | 27 | 0 |
| B | 0 | 28 | 0 |
| C | 0 | 28 | 0 |
| D | 0 | 28 | 0 |
| Quadrant | Total seconds | Saturated seconds | Saturation percentage |
|---|---|---|---|
| A | 5888 | 11 | 0.186821% |
| B | 5887 | 22 | 0.373705% |
| C | 5887 | 219 | 3.720061% |
| D | 5887 | 116 | 1.970443% |
Noise dominated data is calculated using 1-second bins in cleaned event files. If a bin has >2000 counts, and if more than 50% of those come from <1% of pixels, then it is considered to be noise-dominated and hence unusable.
| Quadrant | # 1 sec bins | Bins with >0 counts | Bins with >2000 counts | High rate bins dominated by noise | Noise dominated (total time) | Noise dominated (detector-on time) | Marked lightcurve |
|---|---|---|---|---|---|---|---|
| A | 7231 | 5889 | 6 | 6 | 0.08% | 0.10% | 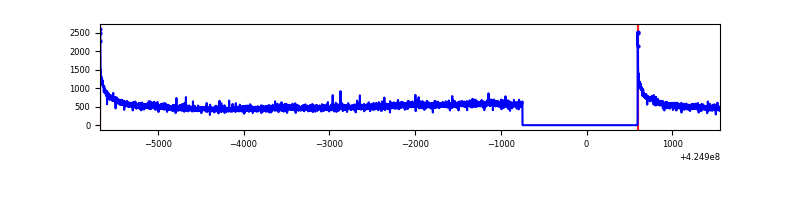 |
| B | 7229 | 5886 | 22 | 22 | 0.30% | 0.37% | 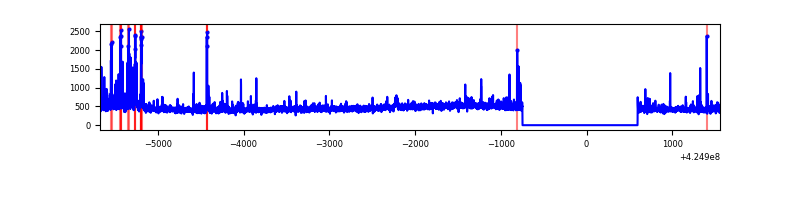 |
| C | 7229 | 5887 | 217 | 217 | 3.00% | 3.69% | 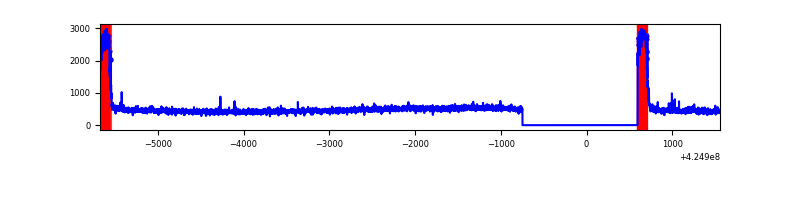 |
| D | 7229 | 5887 | 120 | 120 | 1.66% | 2.04% | 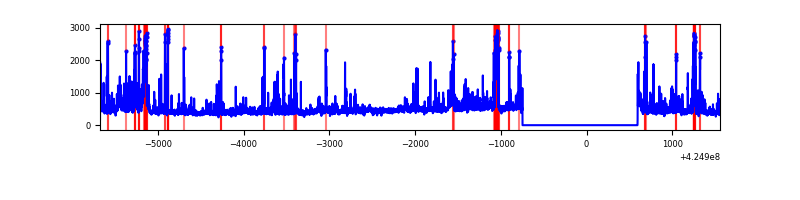 |
Top three noisy pixels from each quadrant. If the there are fewer than three noisy pixels in the level2.evt file, extra rows are filled as -1
| Pixel properties | Quadrant properties | ||||||
|---|---|---|---|---|---|---|---|
| Quadrant | DetID | PixID | Counts | Sigma | Mean | Median | Sigma |
| A | 10 | 83 | 587061 | 4364.56 | 645 | 631 | 134.4 |
| A | 2 | 79 | 11211 | 78.74 | 645 | 631 | 134.4 |
| A | 13 | 254 | 9834 | 68.49 | 645 | 631 | 134.4 |
| B | 5 | 255 | 153428 | 1214.89 | 641 | 623 | 125.8 |
| B | 0 | 245 | 54990 | 432.25 | 641 | 623 | 125.8 |
| B | 0 | 183 | 37805 | 295.62 | 641 | 623 | 125.8 |
| C | 0 | 10 | 647982 | 4529.05 | 608 | 613 | 142.9 |
| C | 15 | 214 | 232997 | 1625.78 | 608 | 613 | 142.9 |
| C | 15 | 111 | 7274 | 46.6 | 608 | 613 | 142.9 |
| D | 13 | 249 | 249225 | 1608.62 | 621 | 602 | 154.6 |
| D | 2 | 120 | 173319 | 1117.5 | 621 | 602 | 154.6 |
| D | 5 | 32 | 123406 | 794.56 | 621 | 602 | 154.6 |
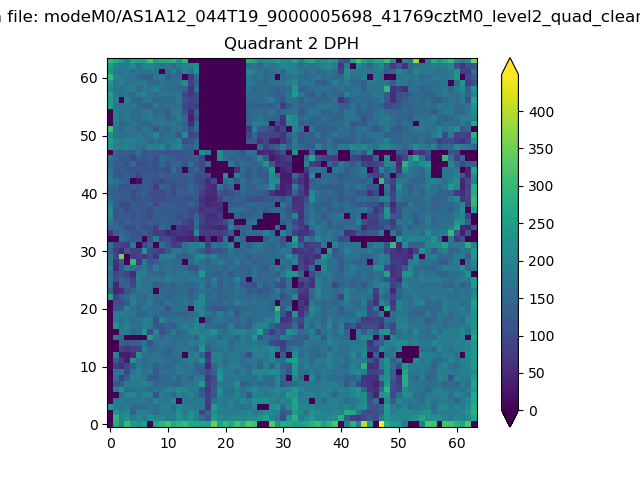
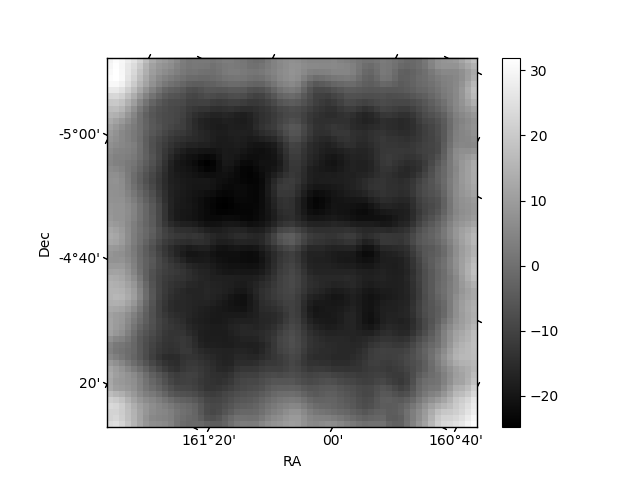
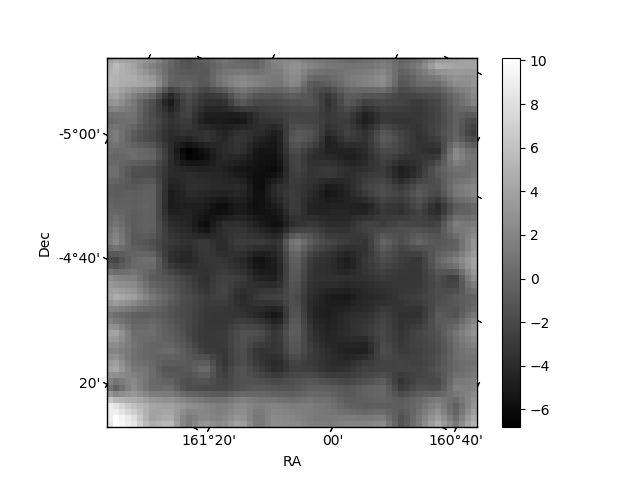
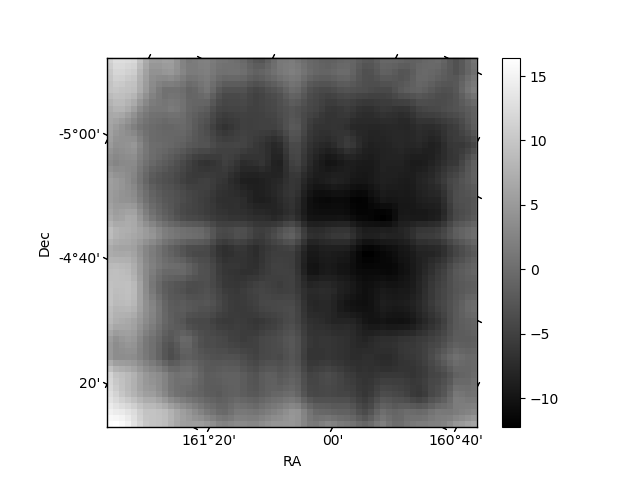
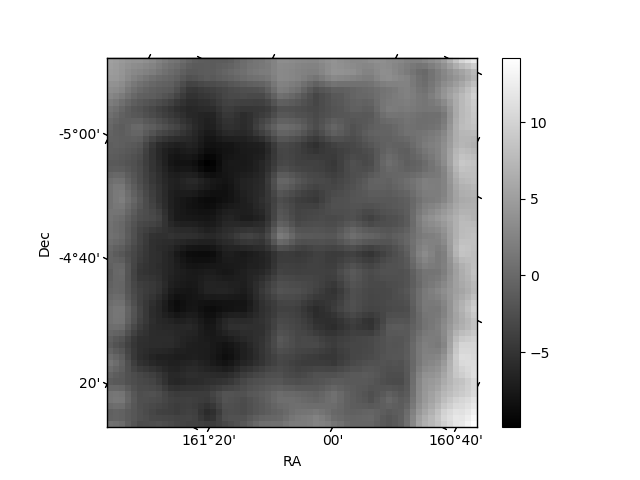
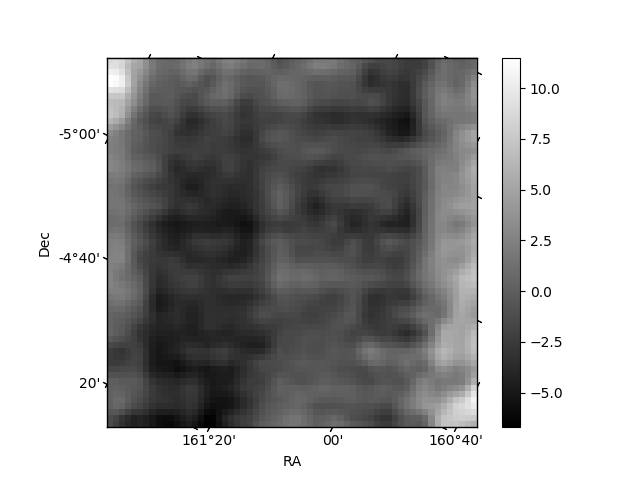
Histogram calculated using DETX and DETY for each event in the final _common_clean file
| Quadrant A | 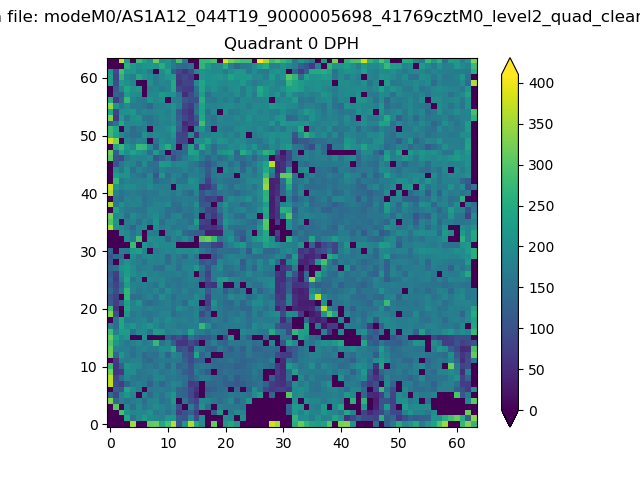 |
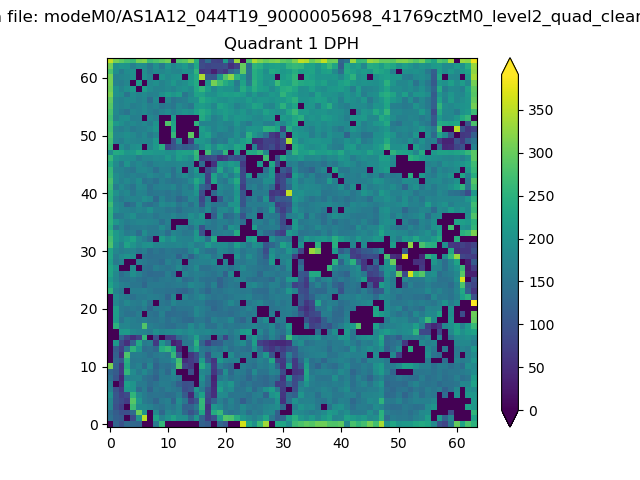 |
Quadrant B |
|---|---|---|---|
| Quadrant D | 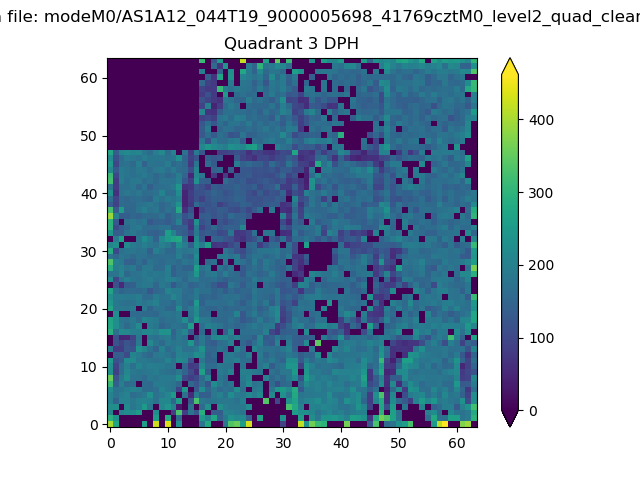 |
 |
Quadrant C |
| Plot type | Count rate plots | Images |
|---|---|---|
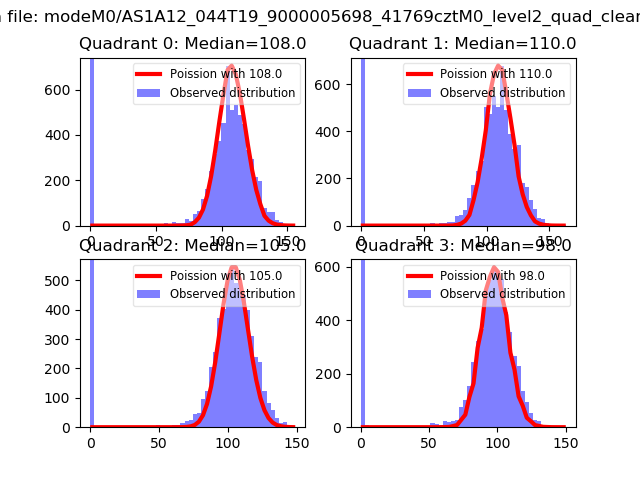
| Comparison with Poisson distribution Blue bars denote a histogram of data divided into 1 sec bins. Red curve is a Poisson curve with rate = median count rate of data. |
 |
 |
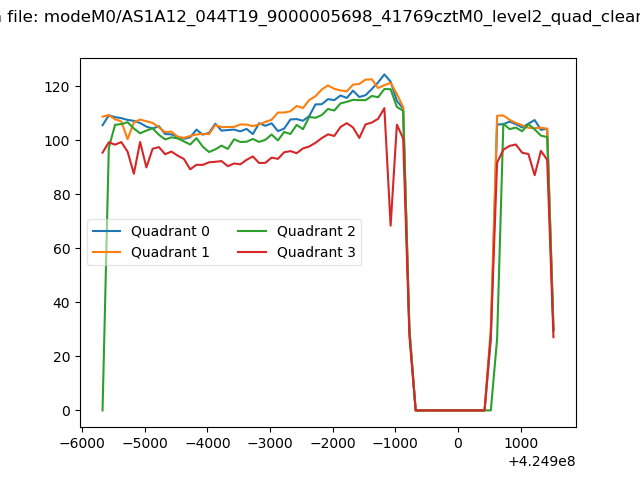
| Quadrant-wise count rates Data is divided into 100 sec bins |
 |
|
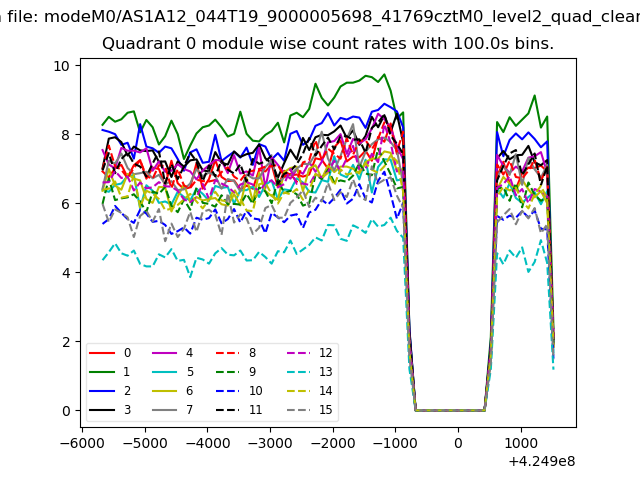
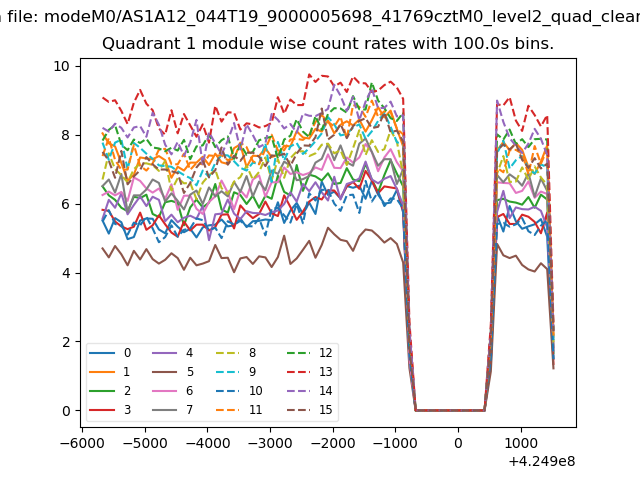
| Module-wise count rates for Quadrant A Data is divided into 100 sec bins |
 |
 |
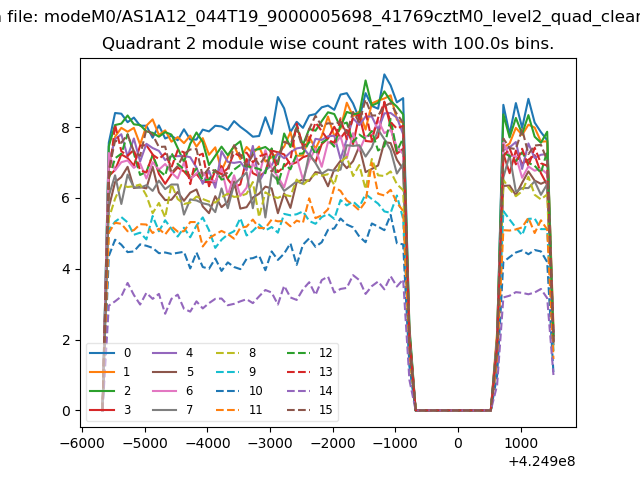
| Module-wise count rates for Quadrant B Data is divided into 100 sec bins |
 |
 |
| Module-wise count rates for Quadrant C Data is divided into 100 sec bins |
 |
 |
| Module-wise count rates for Quadrant D Data is divided into 100 sec bins |
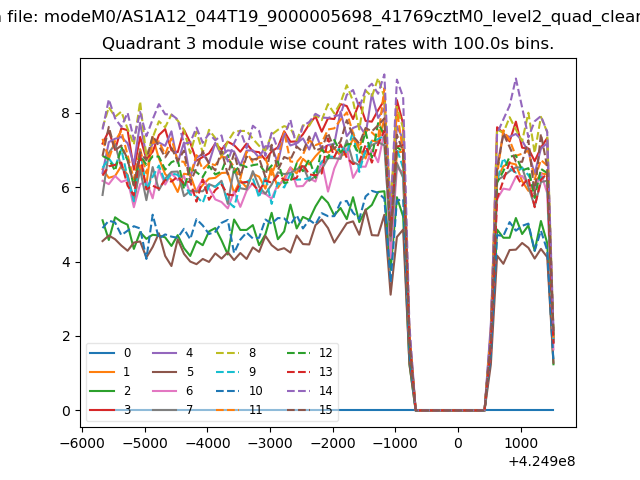 |
 |
| Parameter | Plot |
|---|---|
| CZT HV Monitor | 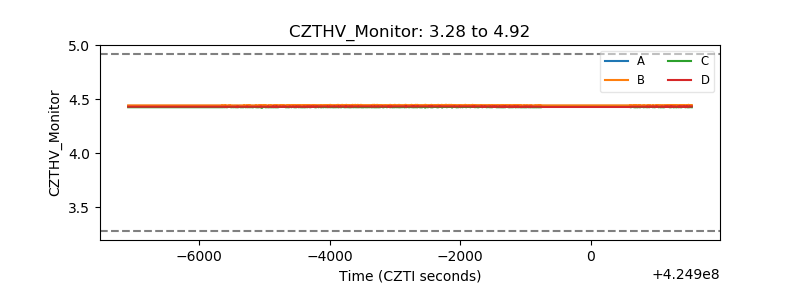 |
| D_VDD | 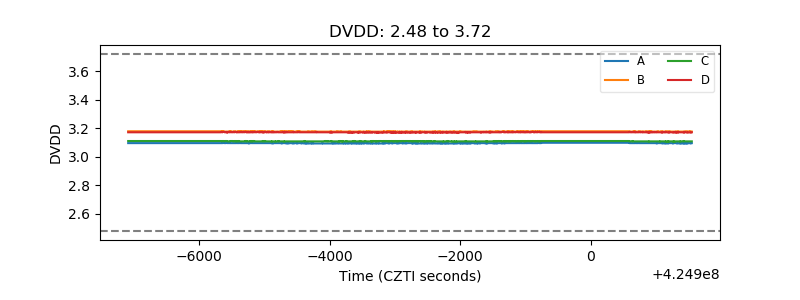 |
| Temperature 1 | 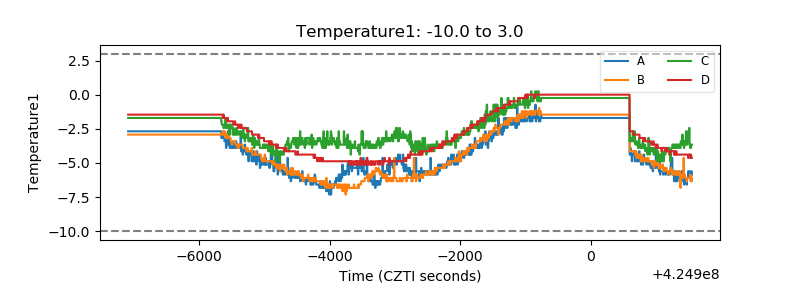 |
| Veto HV Monitor | 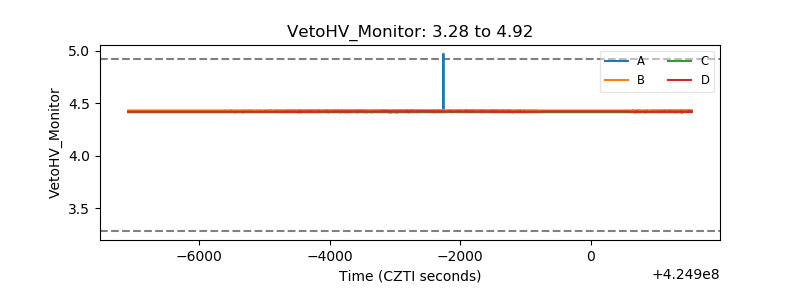 |
| Veto LLD | 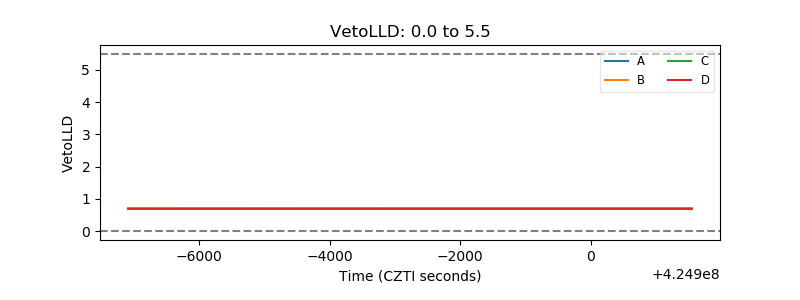 |
| Alpha Counter | 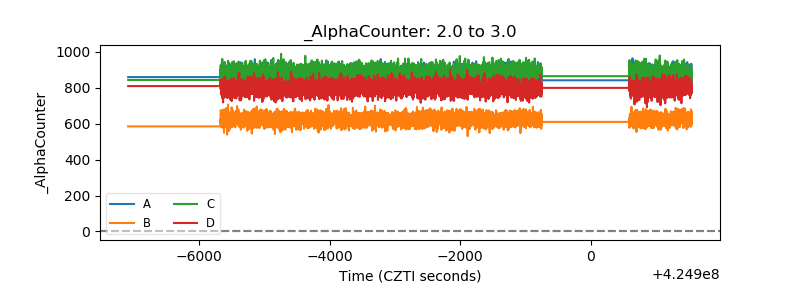 |
| _CPM_Rate | 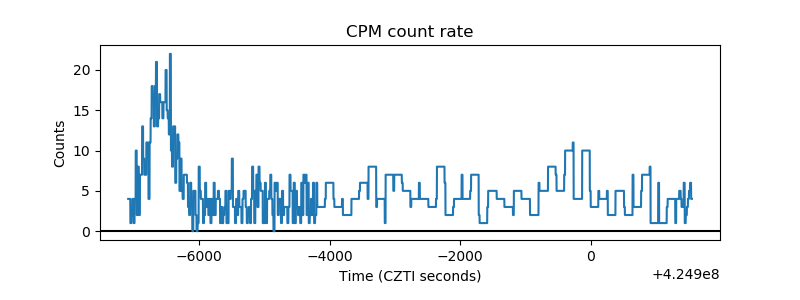 |
| CZT Counter | 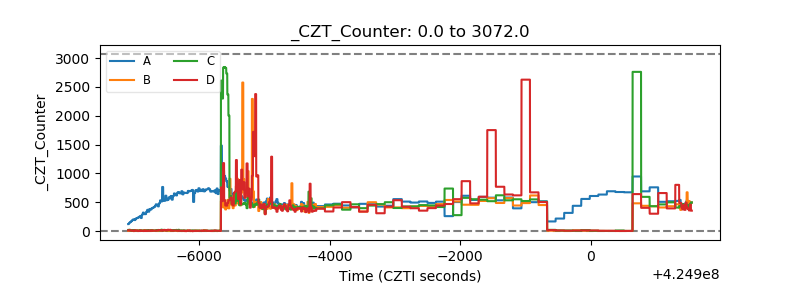 |
| +2.5 Volts monitor |  |
| +5 Volts monitor | 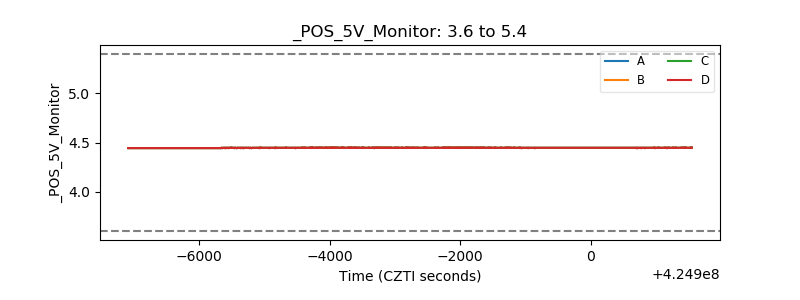 |
| _ROLL_ROT | 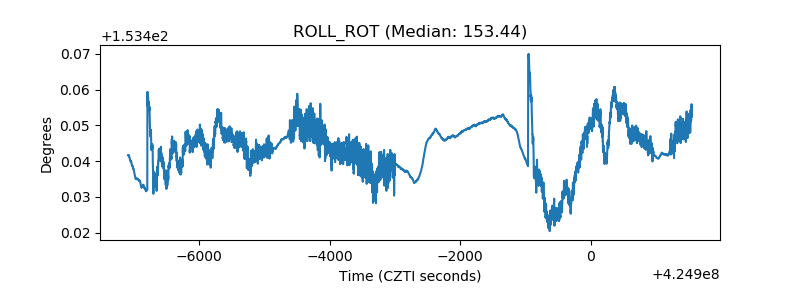 |
| _Roll_DEC | 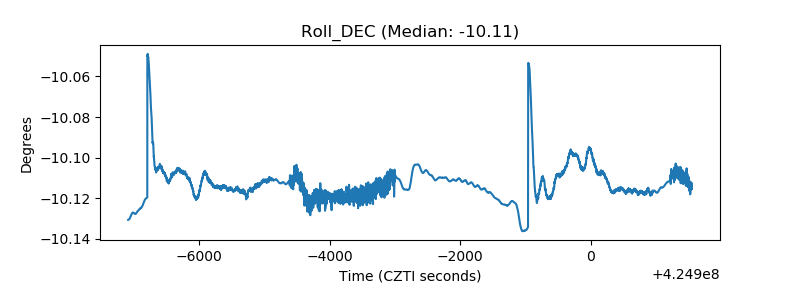 |
| _Roll_RA | 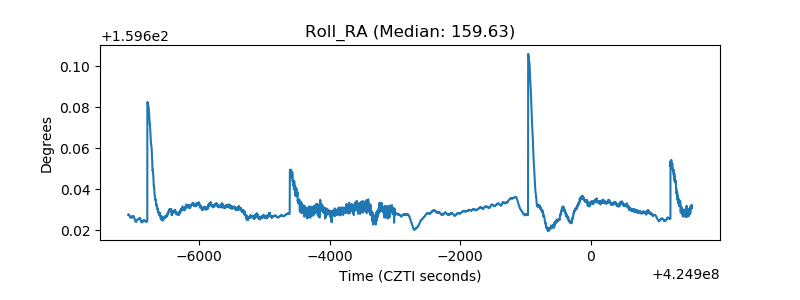 |
| Veto Counter | 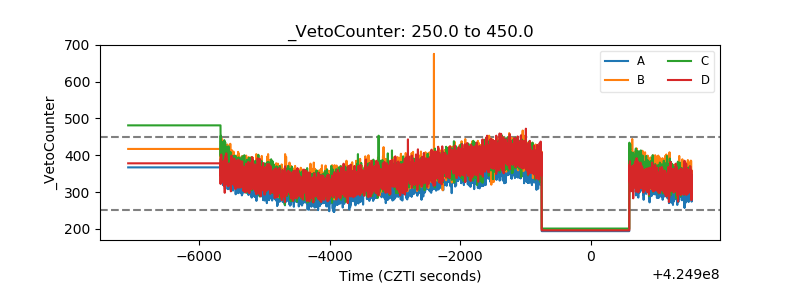 |