| Param | Original file | Final file |
|---|---|---|
| Filename | modeM0/AS1A12_044T19_9000005698_41770cztM0_level2.fits | modeM0/AS1A12_044T19_9000005698_41770cztM0_level2_quad_clean.evt |
| Size (bytes) | 356,895,360 | 95,806,080 |
| Size | 340.4 MB | 91.4 MB |
| Events in quadrant A | 3,190,025 | 647,288 |
| Events in quadrant B | 2,716,018 | 657,999 |
| Events in quadrant C | 3,523,725 | 597,830 |
| Events in quadrant D | 3,314,383 | 578,899 |
| Mode SS | |||
|---|---|---|---|
| Quadrant | BADHDUFLAG | Total packets | Discarded packets |
| A | 0 | 122 | 0 |
| B | 0 | 122 | 0 |
| C | 0 | 122 | 0 |
| D | 0 | 122 | 0 |
| Mode M0 | |||
|---|---|---|---|
| Quadrant | BADHDUFLAG | Total packets | Discarded packets |
| A | 0 | 13070 | 2 |
| B | 0 | 12207 | 2 |
| C | 0 | 14335 | 2 |
| D | 0 | 14085 | 2 |
| Mode M9 | |||
|---|---|---|---|
| Quadrant | BADHDUFLAG | Total packets | Discarded packets |
| A | 0 | 17 | 0 |
| B | 0 | 18 | 0 |
| C | 0 | 18 | 0 |
| D | 0 | 18 | 0 |
| Quadrant | Total seconds | Saturated seconds | Saturation percentage |
|---|---|---|---|
| A | 5996 | 11 | 0.183456% |
| B | 5996 | 11 | 0.183456% |
| C | 5996 | 290 | 4.836558% |
| D | 5995 | 76 | 1.267723% |
Noise dominated data is calculated using 1-second bins in cleaned event files. If a bin has >2000 counts, and if more than 50% of those come from <1% of pixels, then it is considered to be noise-dominated and hence unusable.
| Quadrant | # 1 sec bins | Bins with >0 counts | Bins with >2000 counts | High rate bins dominated by noise | Noise dominated (total time) | Noise dominated (detector-on time) | Marked lightcurve |
|---|---|---|---|---|---|---|---|
| A | 7309 | 5997 | 6 | 6 | 0.08% | 0.10% | 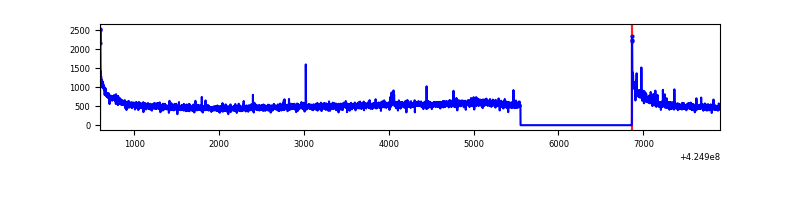 |
| B | 7308 | 5996 | 5 | 5 | 0.07% | 0.08% | 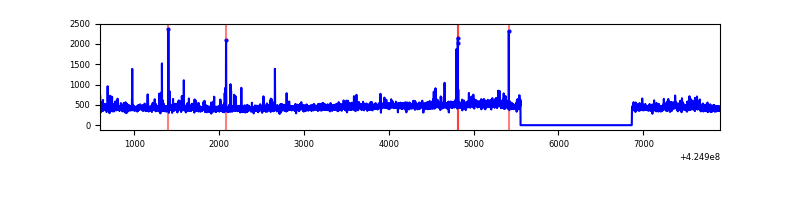 |
| C | 7309 | 5997 | 270 | 270 | 3.69% | 4.50% | 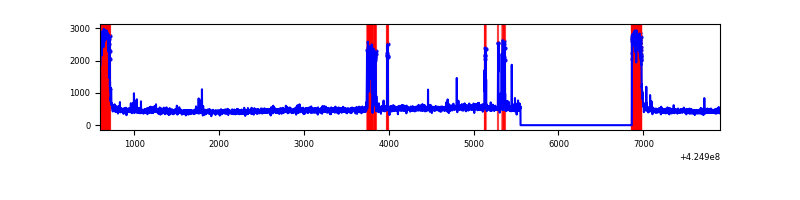 |
| D | 7308 | 5996 | 87 | 87 | 1.19% | 1.45% | 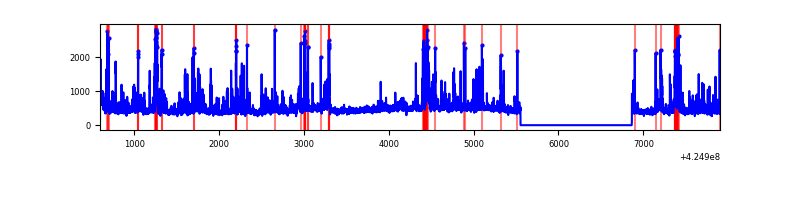 |
Top three noisy pixels from each quadrant. If the there are fewer than three noisy pixels in the level2.evt file, extra rows are filled as -1
| Pixel properties | Quadrant properties | ||||||
|---|---|---|---|---|---|---|---|
| Quadrant | DetID | PixID | Counts | Sigma | Mean | Median | Sigma |
| A | 10 | 83 | 592308 | 4373.4 | 659 | 646 | 135.3 |
| A | 15 | 223 | 25166 | 181.25 | 659 | 646 | 135.3 |
| A | 2 | 79 | 11857 | 82.87 | 659 | 646 | 135.3 |
| B | 0 | 245 | 46238 | 357.6 | 652 | 636 | 127.5 |
| B | 3 | 112 | 36188 | 278.79 | 652 | 636 | 127.5 |
| B | 0 | 190 | 26646 | 203.97 | 652 | 636 | 127.5 |
| C | 0 | 10 | 634486 | 4357.01 | 618 | 621 | 145.5 |
| C | 15 | 214 | 240649 | 1649.88 | 618 | 621 | 145.5 |
| C | 4 | 254 | 210077 | 1439.74 | 618 | 621 | 145.5 |
| D | 2 | 249 | 262725 | 1648.88 | 636 | 616 | 159.0 |
| D | 13 | 249 | 247285 | 1551.75 | 636 | 616 | 159.0 |
| D | 2 | 120 | 97065 | 606.74 | 636 | 616 | 159.0 |
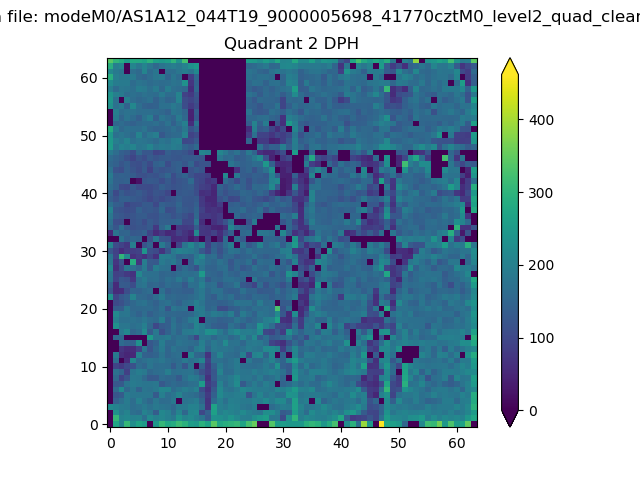
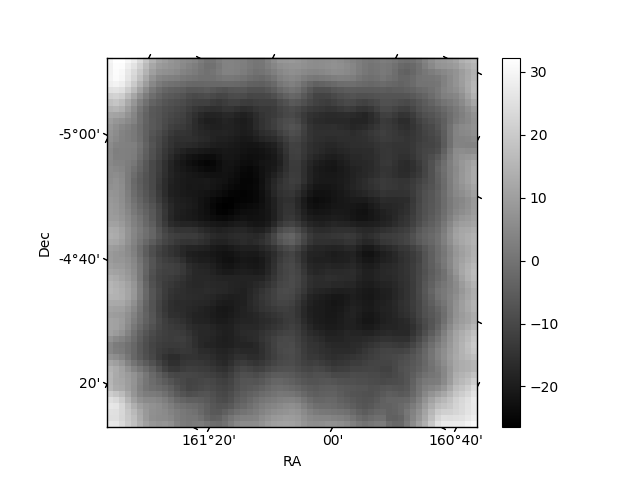
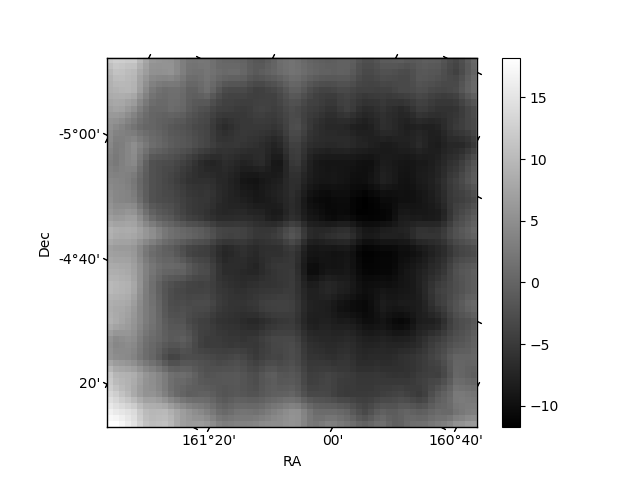
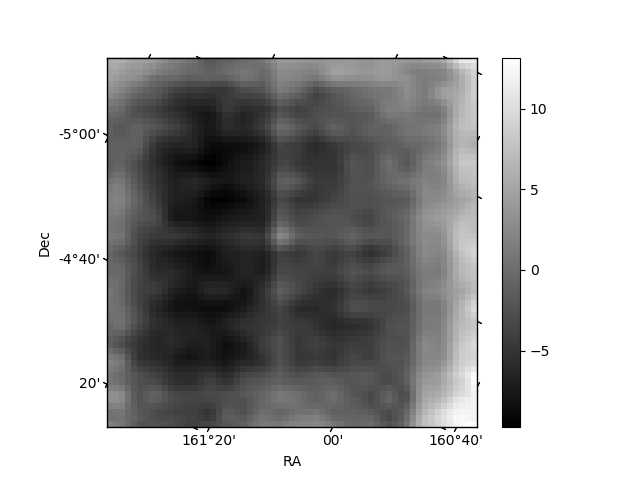
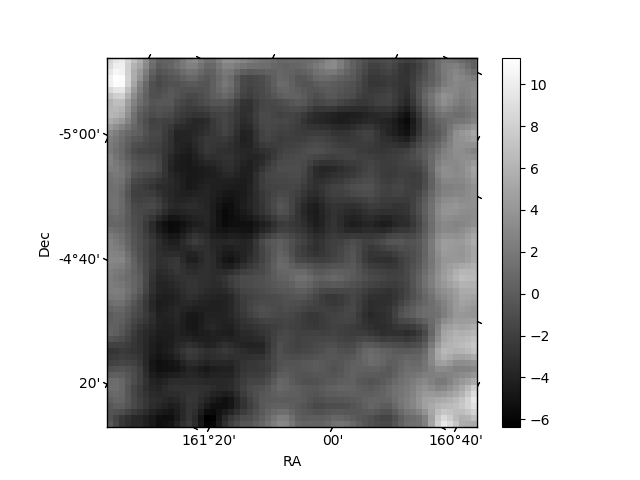
Histogram calculated using DETX and DETY for each event in the final _common_clean file
| Quadrant A | 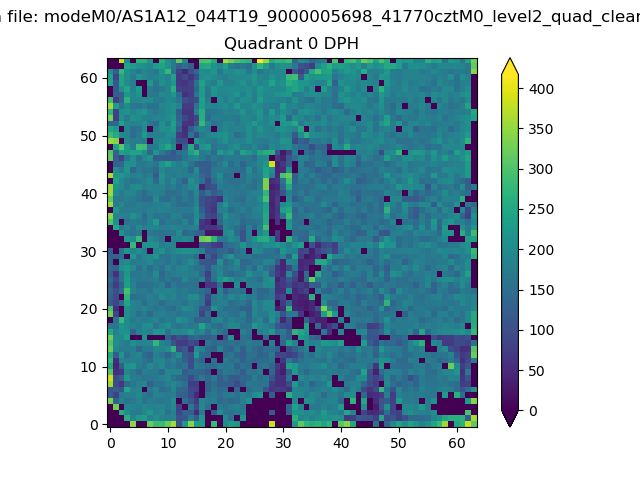 |
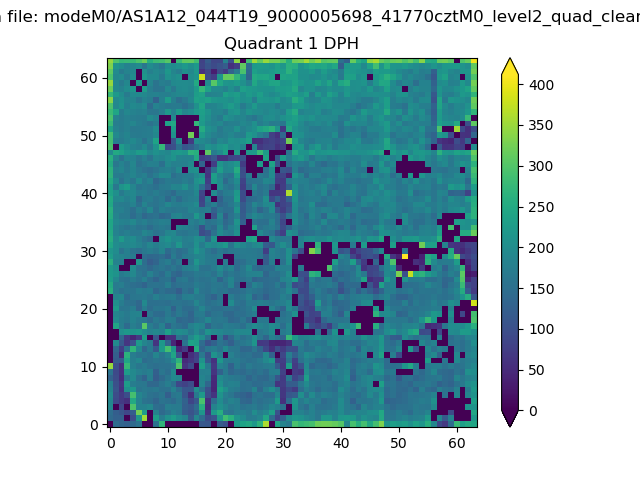 |
Quadrant B |
|---|---|---|---|
| Quadrant D | 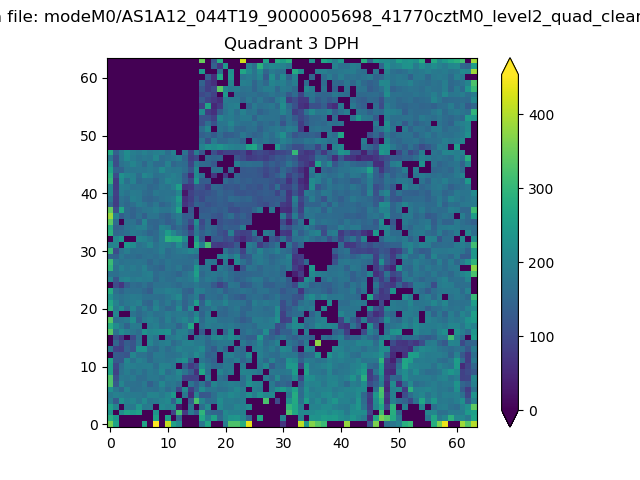 |
 |
Quadrant C |
| Plot type | Count rate plots | Images |
|---|---|---|
| Comparison with Poisson distribution Blue bars denote a histogram of data divided into 1 sec bins. Red curve is a Poisson curve with rate = median count rate of data. |
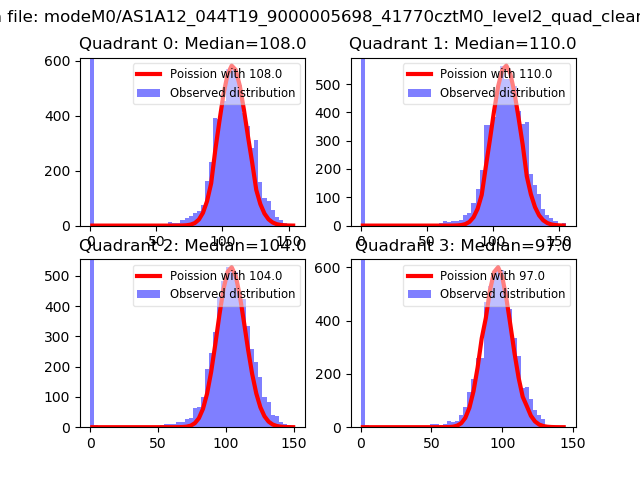 |
 |
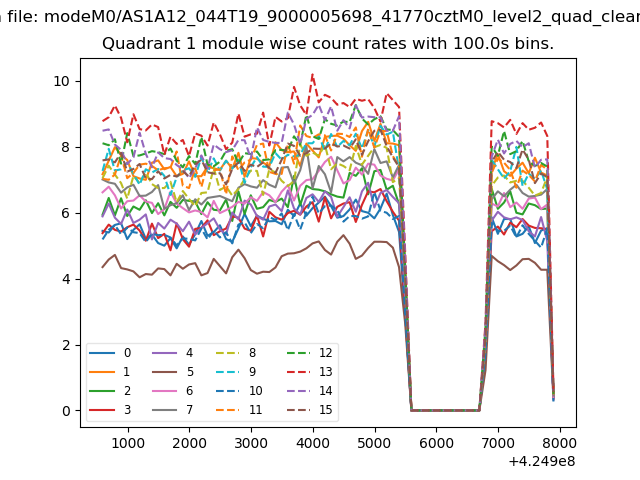
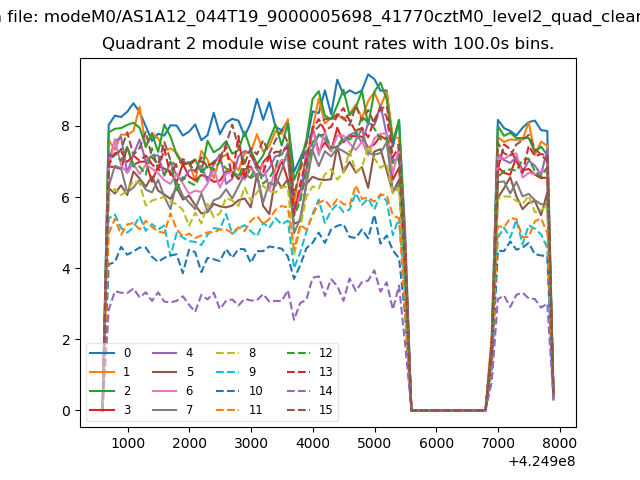
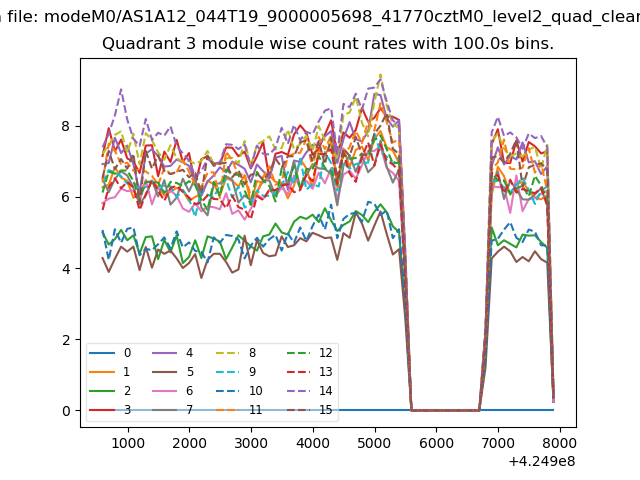
| Quadrant-wise count rates Data is divided into 100 sec bins |
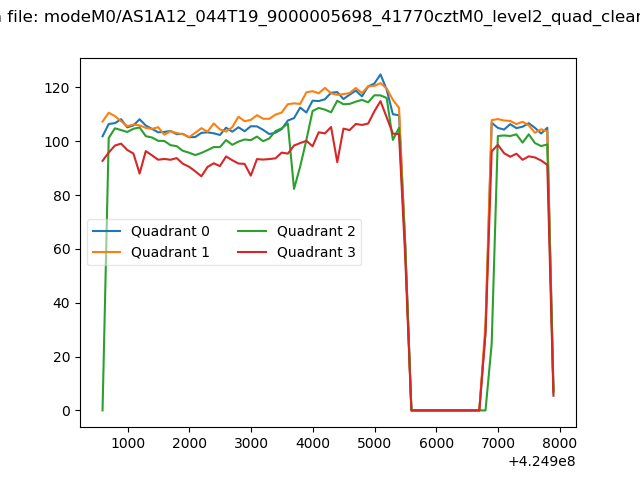 |
|
| Module-wise count rates for Quadrant A Data is divided into 100 sec bins |
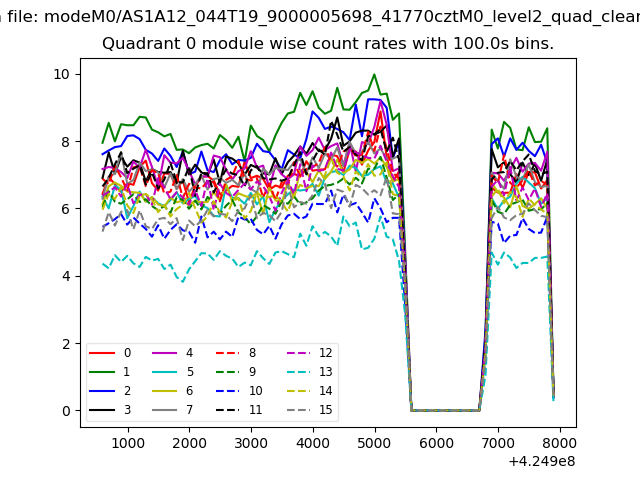 |
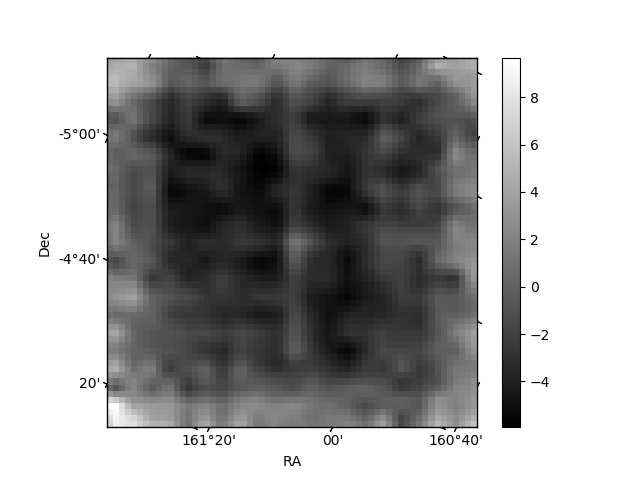 |
| Module-wise count rates for Quadrant B Data is divided into 100 sec bins |
 |
 |
| Module-wise count rates for Quadrant C Data is divided into 100 sec bins |
 |
 |
| Module-wise count rates for Quadrant D Data is divided into 100 sec bins |
 |
 |
| Parameter | Plot |
|---|---|
| CZT HV Monitor | 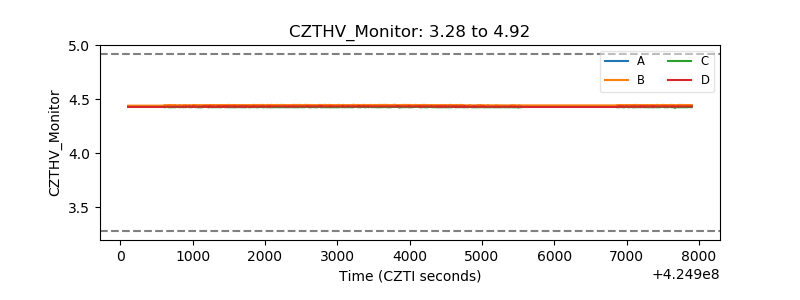 |
| D_VDD | 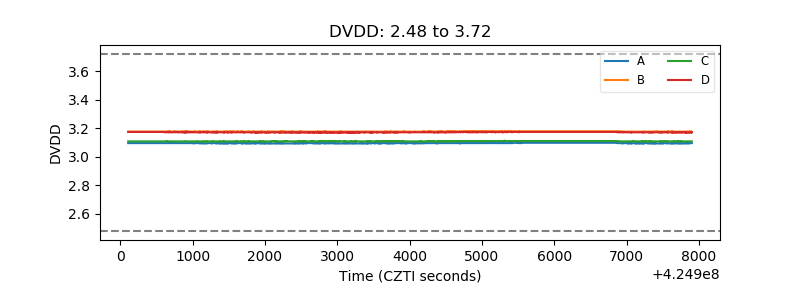 |
| Temperature 1 | 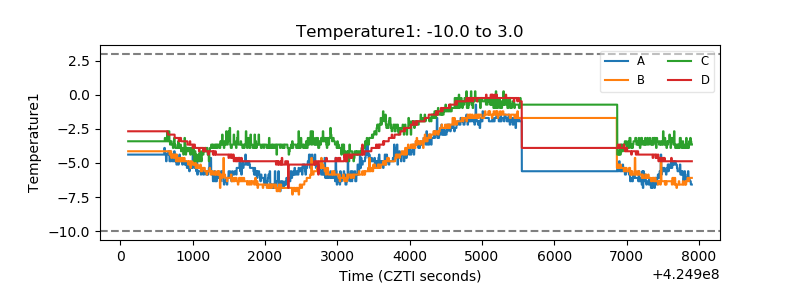 |
| Veto HV Monitor | 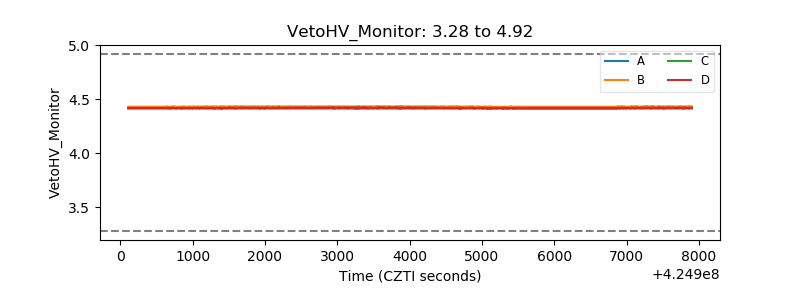 |
| Veto LLD | 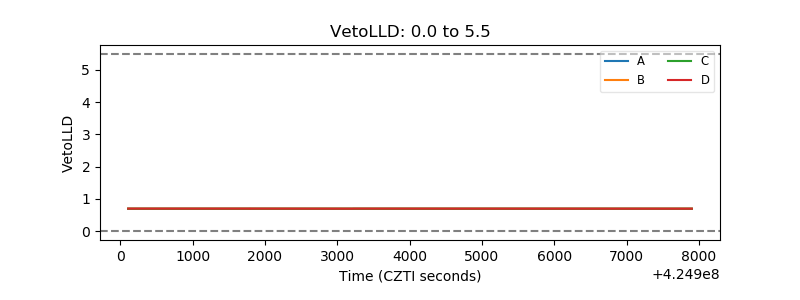 |
| Alpha Counter | 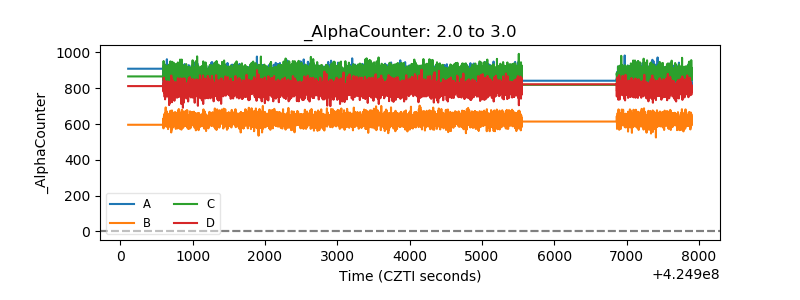 |
| _CPM_Rate | 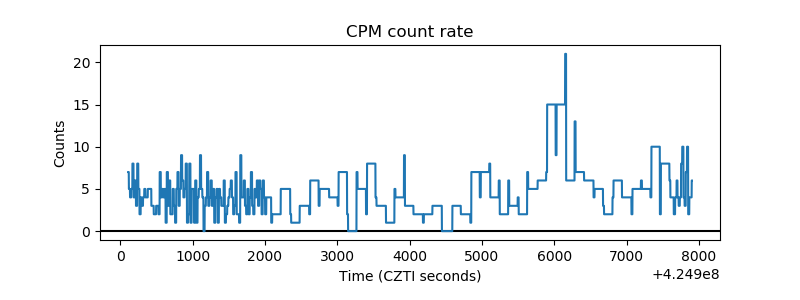 |
| CZT Counter | 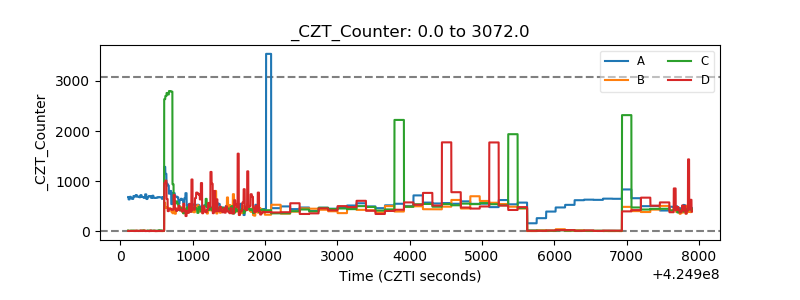 |
| +2.5 Volts monitor | 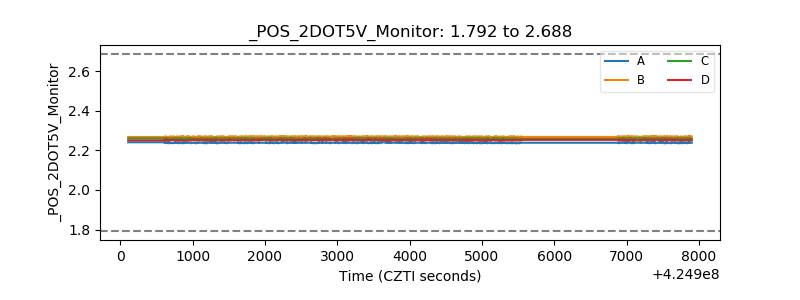 |
| +5 Volts monitor | 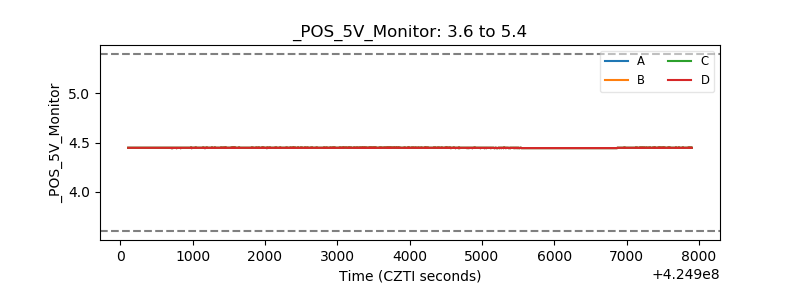 |
| _ROLL_ROT | 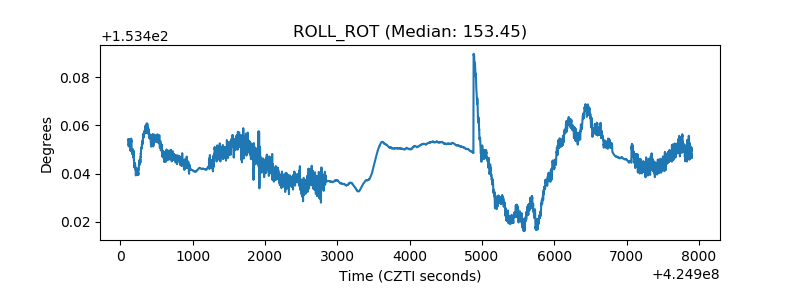 |
| _Roll_DEC | 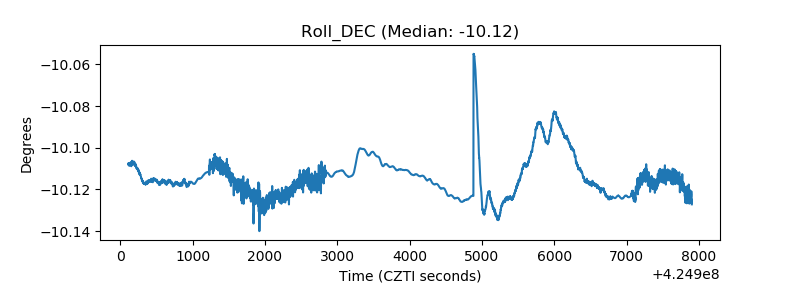 |
| _Roll_RA | 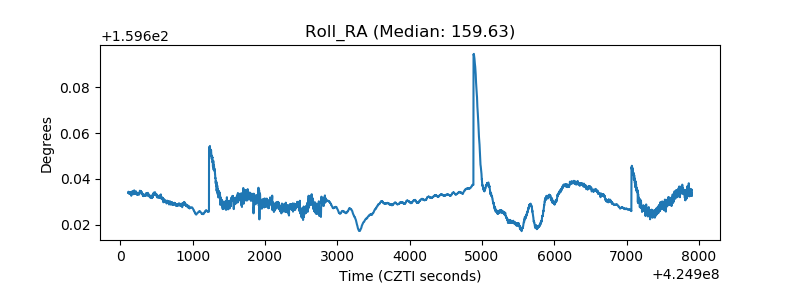 |
| Veto Counter | 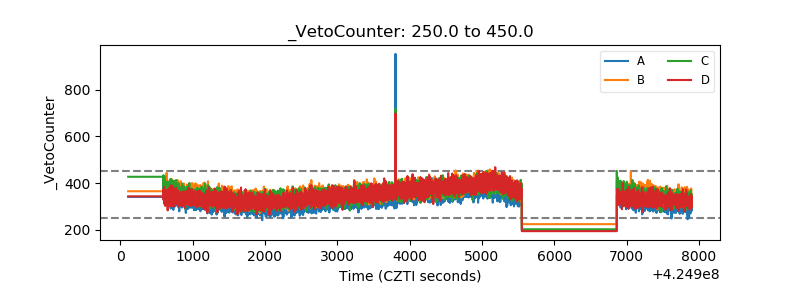 |