| Param | Original file | Final file |
|---|---|---|
| Filename | modeM0/AS1A12_044T19_9000005698_41773cztM0_level2.fits | modeM0/AS1A12_044T19_9000005698_41773cztM0_level2_quad_clean.evt |
| Size (bytes) | 906,091,200 | 244,532,160 |
| Size | 864.1 MB | 233.2 MB |
| Events in quadrant A | 8,150,192 | 1,647,058 |
| Events in quadrant B | 7,313,194 | 1,685,162 |
| Events in quadrant C | 8,670,724 | 1,541,344 |
| Events in quadrant D | 8,205,887 | 1,461,617 |
| Mode SS | |||
|---|---|---|---|
| Quadrant | BADHDUFLAG | Total packets | Discarded packets |
| A | 0 | 316 | 0 |
| B | 0 | 316 | 0 |
| C | 0 | 316 | 0 |
| D | 0 | 316 | 0 |
| Mode M0 | |||
|---|---|---|---|
| Quadrant | BADHDUFLAG | Total packets | Discarded packets |
| A | 0 | 33048 | 5 |
| B | 0 | 32040 | 4 |
| C | 0 | 35110 | 4 |
| D | 0 | 35647 | 4 |
| Mode M9 | |||
|---|---|---|---|
| Quadrant | BADHDUFLAG | Total packets | Discarded packets |
| A | 0 | 52 | 0 |
| B | 0 | 52 | 0 |
| C | 0 | 52 | 0 |
| D | 0 | 53 | 0 |
| Quadrant | Total seconds | Saturated seconds | Saturation percentage |
|---|---|---|---|
| A | 15484 | 37 | 0.238956% |
| B | 15484 | 57 | 0.368122% |
| C | 15484 | 496 | 3.203307% |
| D | 15484 | 251 | 1.621028% |
Noise dominated data is calculated using 1-second bins in cleaned event files. If a bin has >2000 counts, and if more than 50% of those come from <1% of pixels, then it is considered to be noise-dominated and hence unusable.
| Quadrant | # 1 sec bins | Bins with >0 counts | Bins with >2000 counts | High rate bins dominated by noise | Noise dominated (total time) | Noise dominated (detector-on time) | Marked lightcurve |
|---|---|---|---|---|---|---|---|
| A | 19783 | 15487 | 7 | 7 | 0.04% | 0.05% | 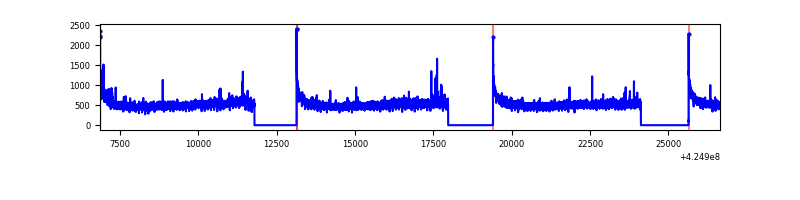 |
| B | 19783 | 15487 | 37 | 37 | 0.19% | 0.24% | 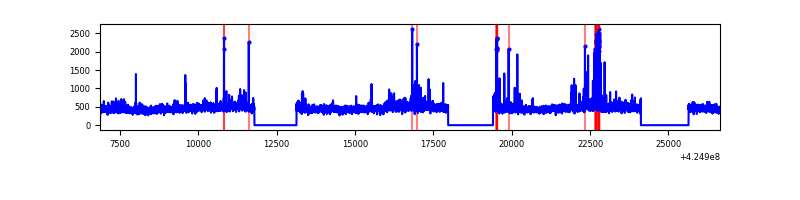 |
| C | 19783 | 15487 | 484 | 484 | 2.45% | 3.13% | 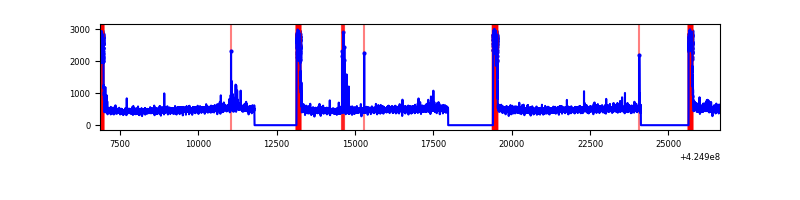 |
| D | 19783 | 15487 | 233 | 233 | 1.18% | 1.50% | 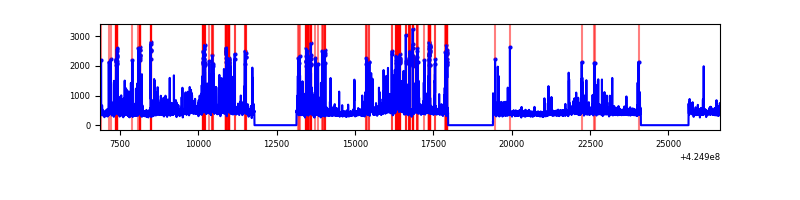 |
Top three noisy pixels from each quadrant. If the there are fewer than three noisy pixels in the level2.evt file, extra rows are filled as -1
| Pixel properties | Quadrant properties | ||||||
|---|---|---|---|---|---|---|---|
| Quadrant | DetID | PixID | Counts | Sigma | Mean | Median | Sigma |
| A | 10 | 83 | 1373259 | 3890.09 | 1727 | 1688 | 352.6 |
| A | 2 | 79 | 41722 | 113.55 | 1727 | 1688 | 352.6 |
| A | 15 | 223 | 37513 | 101.61 | 1727 | 1688 | 352.6 |
| B | 5 | 255 | 201208 | 605.82 | 1702 | 1651 | 329.4 |
| B | 0 | 190 | 104094 | 311.0 | 1702 | 1651 | 329.4 |
| B | 0 | 245 | 88973 | 265.09 | 1702 | 1651 | 329.4 |
| C | 0 | 10 | 1525142 | 4033.04 | 1631 | 1640 | 377.8 |
| C | 15 | 214 | 616839 | 1628.57 | 1631 | 1640 | 377.8 |
| C | 14 | 254 | 63295 | 163.21 | 1631 | 1640 | 377.8 |
| D | 13 | 249 | 608508 | 1488.0 | 1663 | 1615 | 407.9 |
| D | 2 | 120 | 561878 | 1373.67 | 1663 | 1615 | 407.9 |
| D | 2 | 249 | 392957 | 959.5 | 1663 | 1615 | 407.9 |
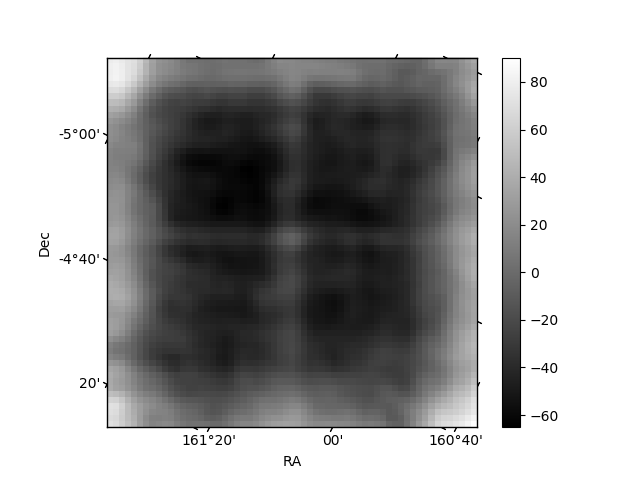
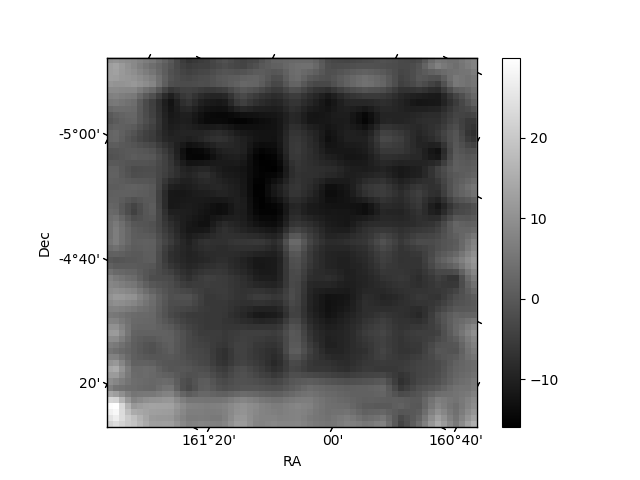
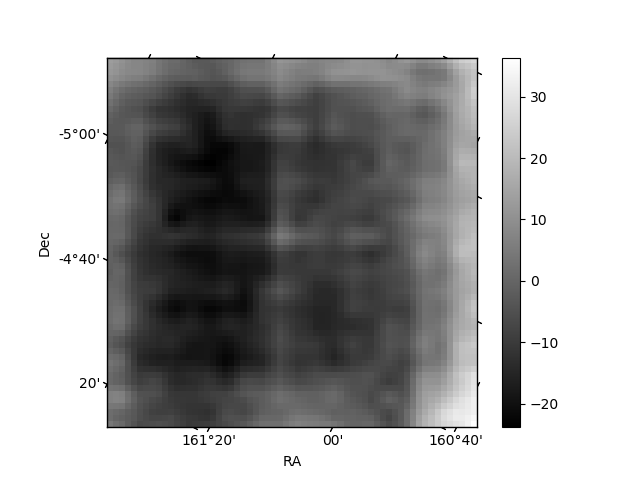
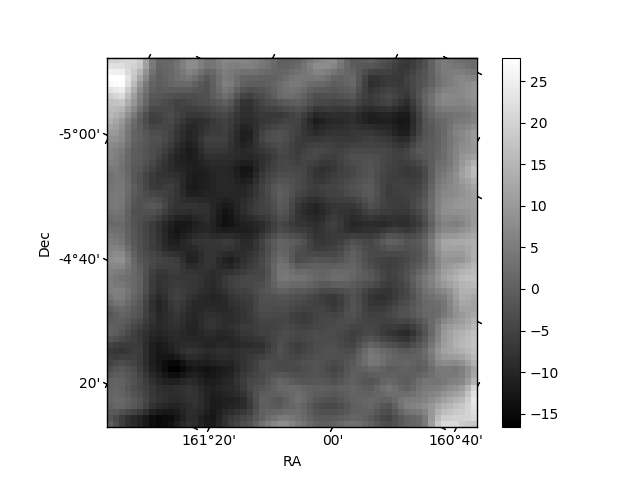
Histogram calculated using DETX and DETY for each event in the final _common_clean file
| Quadrant A | 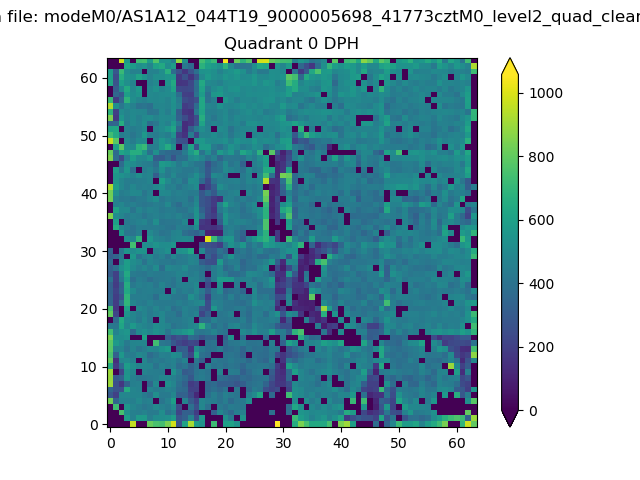 |
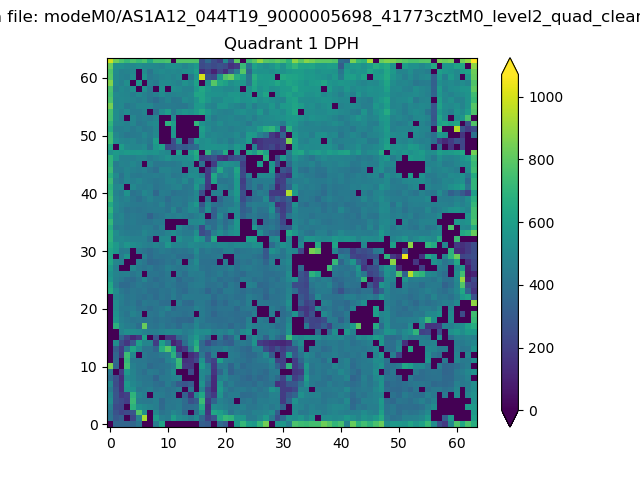 |
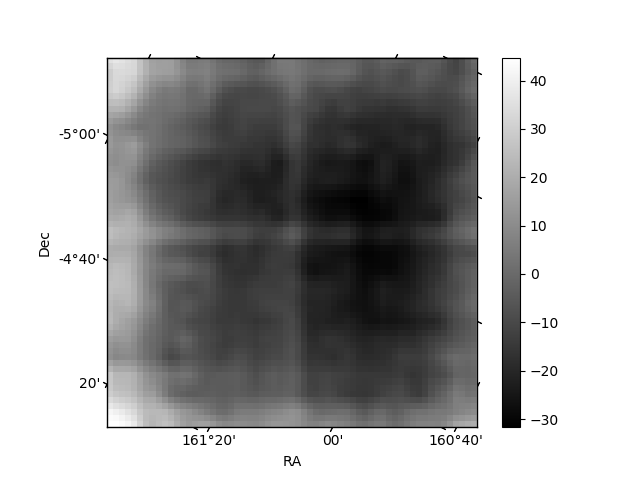
Quadrant B |
|---|---|---|---|
| Quadrant D | 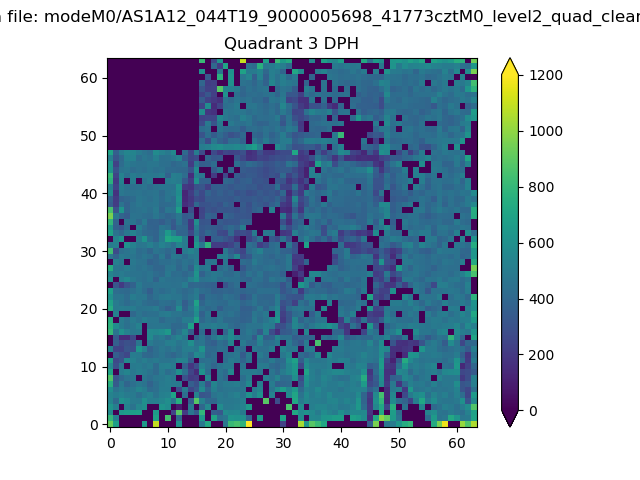 |
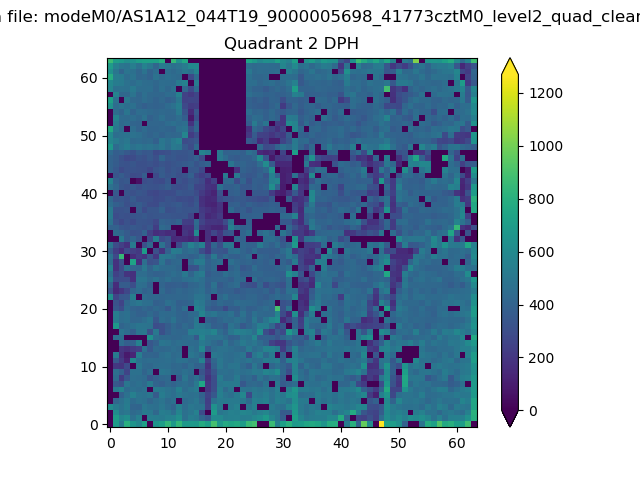 |
Quadrant C |
| Plot type | Count rate plots | Images |
|---|---|---|
| Comparison with Poisson distribution Blue bars denote a histogram of data divided into 1 sec bins. Red curve is a Poisson curve with rate = median count rate of data. |
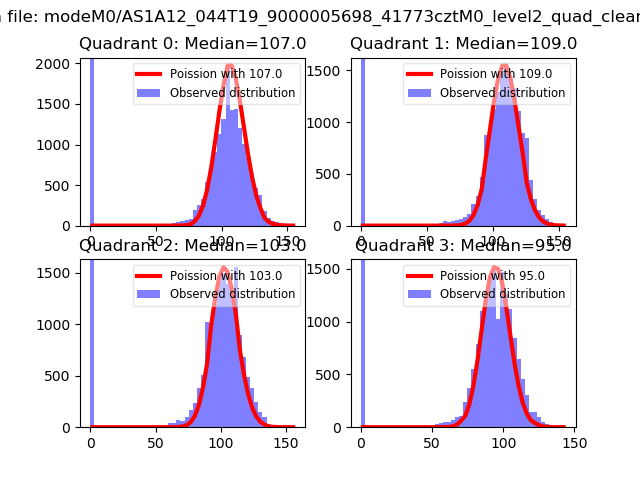 |
 |
| Quadrant-wise count rates Data is divided into 100 sec bins |
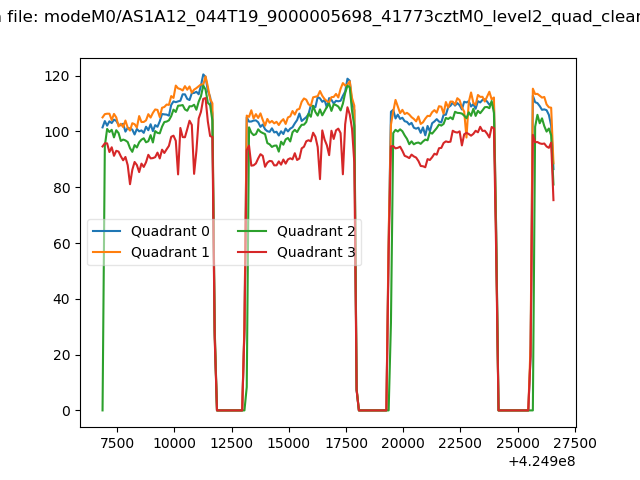 |
|
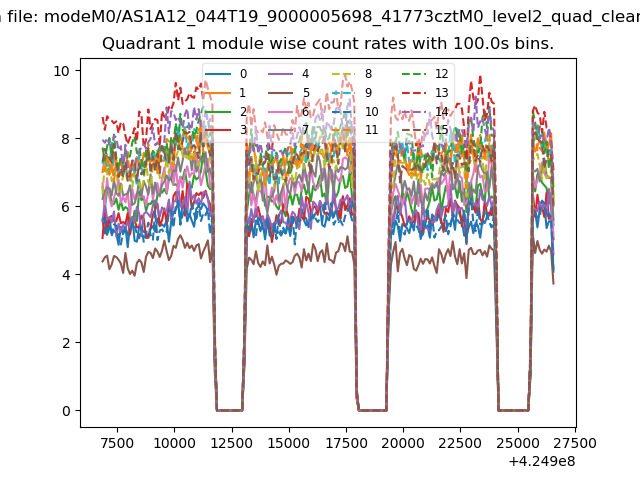
| Module-wise count rates for Quadrant A Data is divided into 100 sec bins |
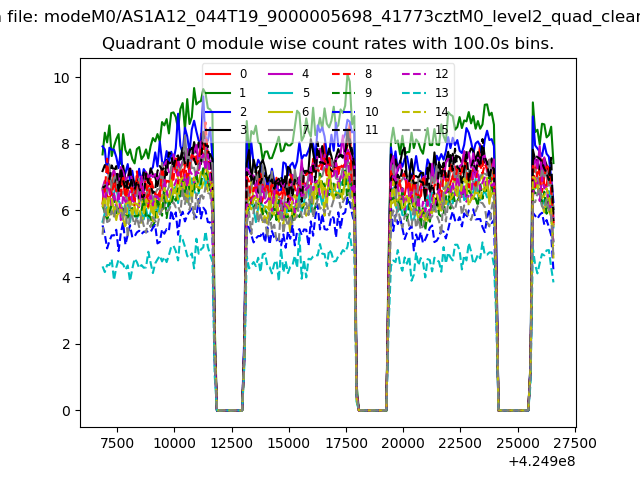 |
 |
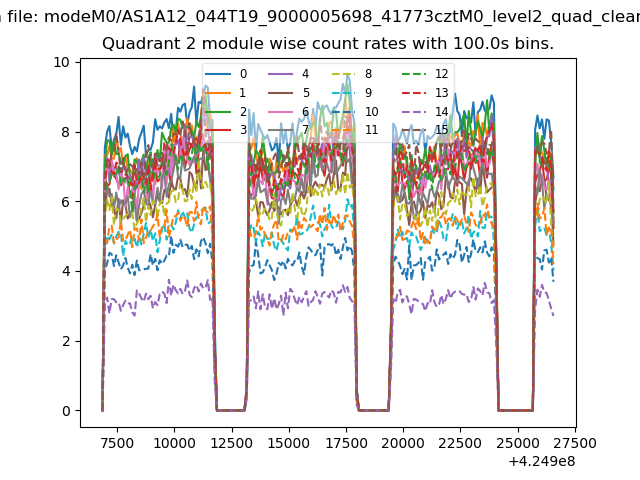
| Module-wise count rates for Quadrant B Data is divided into 100 sec bins |
 |
 |
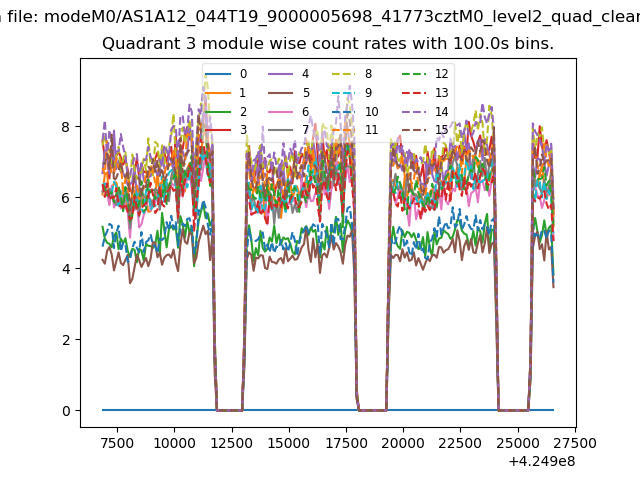
| Module-wise count rates for Quadrant C Data is divided into 100 sec bins |
 |
 |
| Module-wise count rates for Quadrant D Data is divided into 100 sec bins |
 |
 |
| Parameter | Plot |
|---|---|
| CZT HV Monitor | 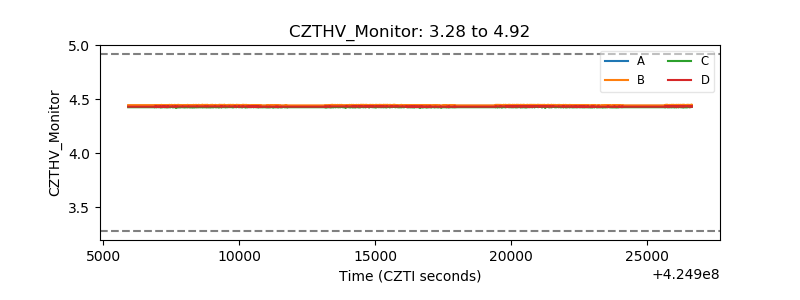 |
| D_VDD | 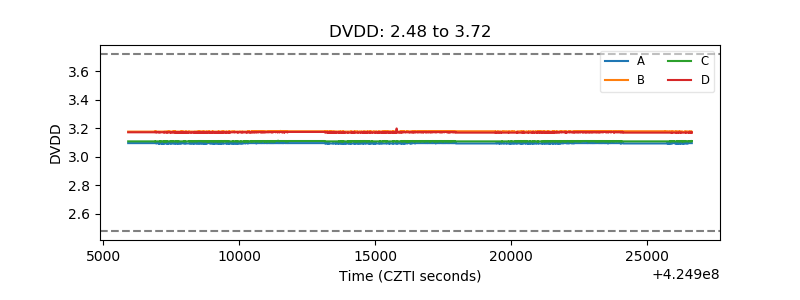 |
| Temperature 1 | 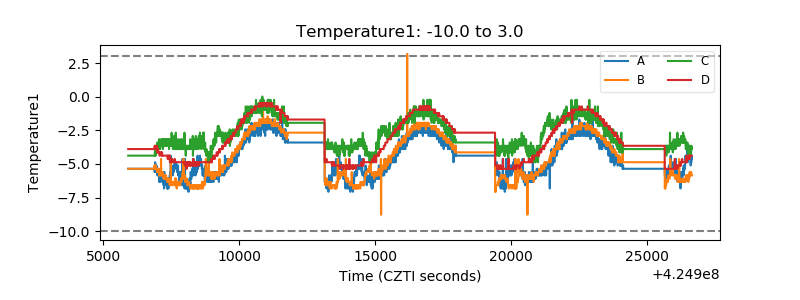 |
| Veto HV Monitor | 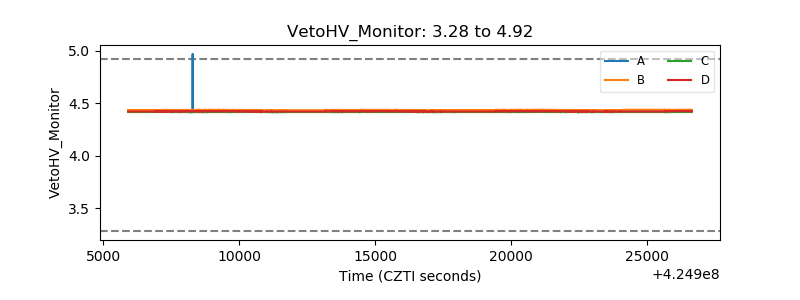 |
| Veto LLD | 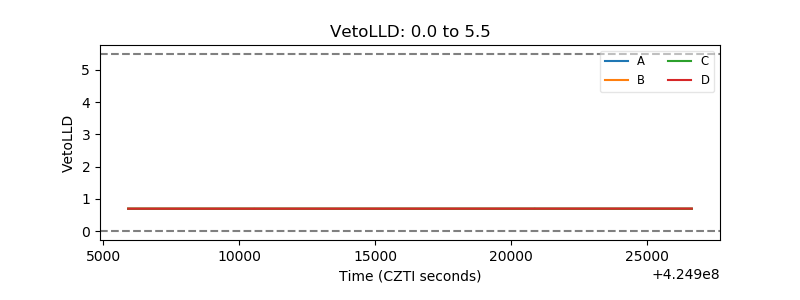 |
| Alpha Counter | 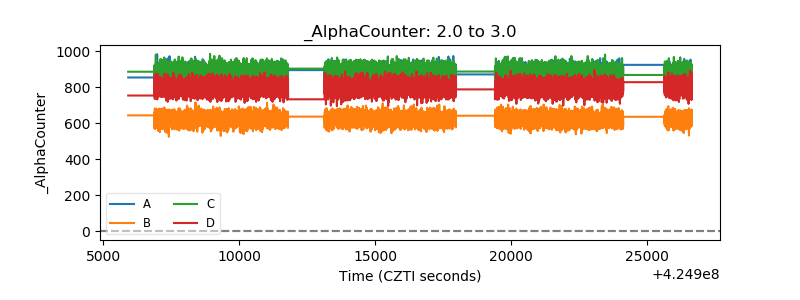 |
| _CPM_Rate |  |
| CZT Counter | 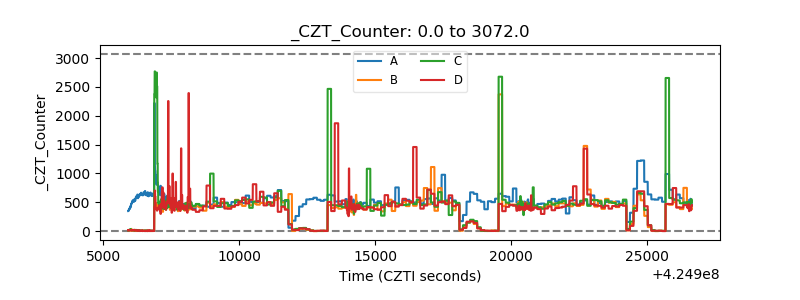 |
| +2.5 Volts monitor | 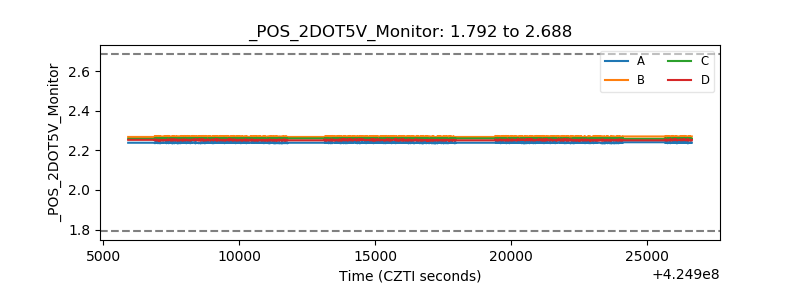 |
| +5 Volts monitor | 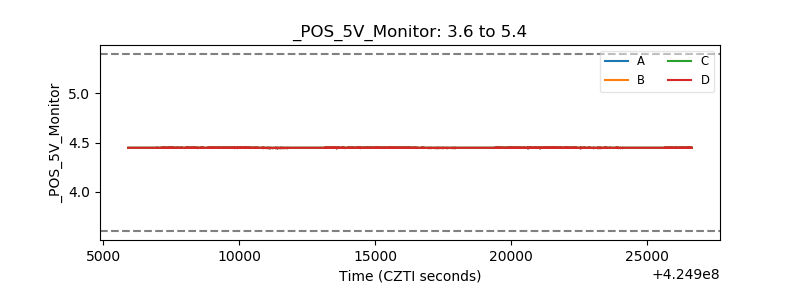 |
| _ROLL_ROT | 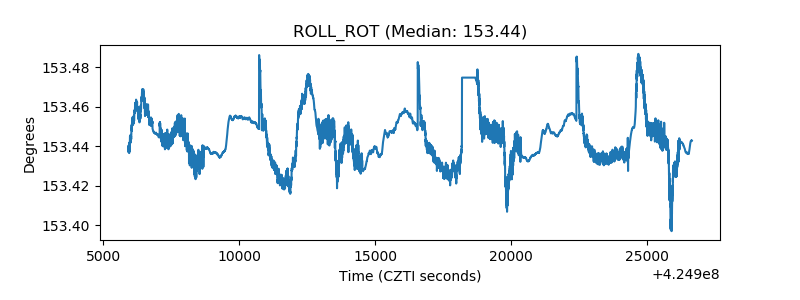 |
| _Roll_DEC | 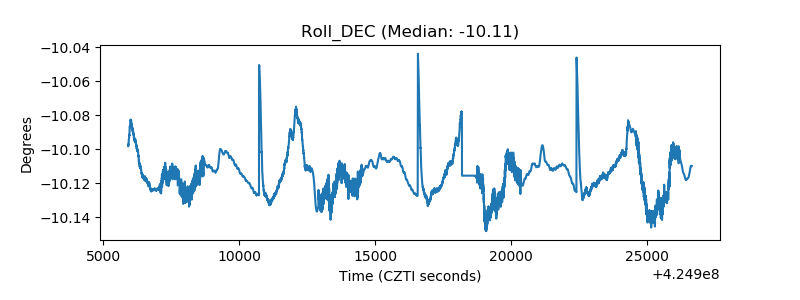 |
| _Roll_RA | 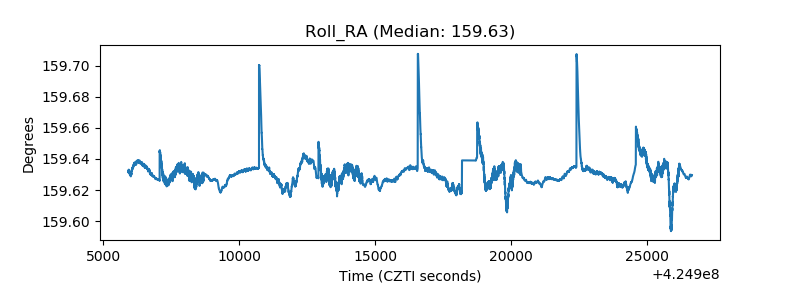 |
| Veto Counter | 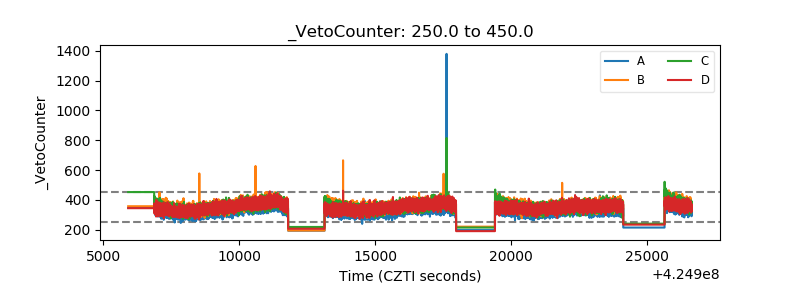 |