| Param | Original file | Final file |
|---|---|---|
| Filename | modeM0/AS1A12_044T19_9000005698_41774cztM0_level2.fits | modeM0/AS1A12_044T19_9000005698_41774cztM0_level2_quad_clean.evt |
| Size (bytes) | 353,989,440 | 92,661,120 |
| Size | 337.6 MB | 88.4 MB |
| Events in quadrant A | 3,121,180 | 630,902 |
| Events in quadrant B | 3,294,827 | 636,455 |
| Events in quadrant C | 3,382,327 | 582,937 |
| Events in quadrant D | 2,860,541 | 556,780 |
| Mode SS | |||
|---|---|---|---|
| Quadrant | BADHDUFLAG | Total packets | Discarded packets |
| A | 0 | 114 | 0 |
| B | 0 | 114 | 0 |
| C | 0 | 114 | 0 |
| D | 0 | 114 | 0 |
| Mode M0 | |||
|---|---|---|---|
| Quadrant | BADHDUFLAG | Total packets | Discarded packets |
| A | 0 | 12510 | 3 |
| B | 0 | 13564 | 2 |
| C | 0 | 13331 | 2 |
| D | 0 | 12565 | 2 |
| Mode M9 | |||
|---|---|---|---|
| Quadrant | BADHDUFLAG | Total packets | Discarded packets |
| A | 0 | 17 | 0 |
| B | 0 | 17 | 0 |
| C | 0 | 17 | 0 |
| D | 0 | 18 | 0 |
| Quadrant | Total seconds | Saturated seconds | Saturation percentage |
|---|---|---|---|
| A | 5708 | 18 | 0.315347% |
| B | 5708 | 132 | 2.312544% |
| C | 5708 | 245 | 4.292221% |
| D | 5708 | 65 | 1.138753% |
Noise dominated data is calculated using 1-second bins in cleaned event files. If a bin has >2000 counts, and if more than 50% of those come from <1% of pixels, then it is considered to be noise-dominated and hence unusable.
| Quadrant | # 1 sec bins | Bins with >0 counts | Bins with >2000 counts | High rate bins dominated by noise | Noise dominated (total time) | Noise dominated (detector-on time) | Marked lightcurve |
|---|---|---|---|---|---|---|---|
| A | 7351 | 5709 | 3 | 3 | 0.04% | 0.05% | 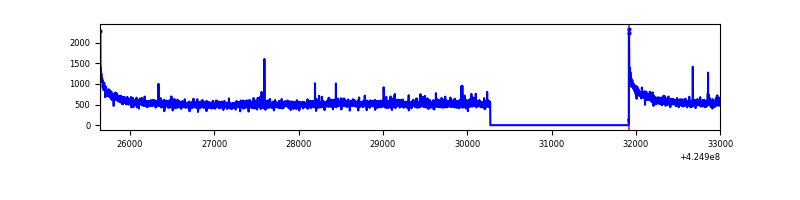 |
| B | 7351 | 5709 | 97 | 97 | 1.32% | 1.70% | 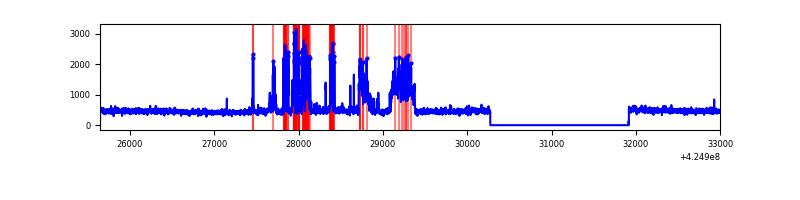 |
| C | 7351 | 5709 | 236 | 236 | 3.21% | 4.13% | 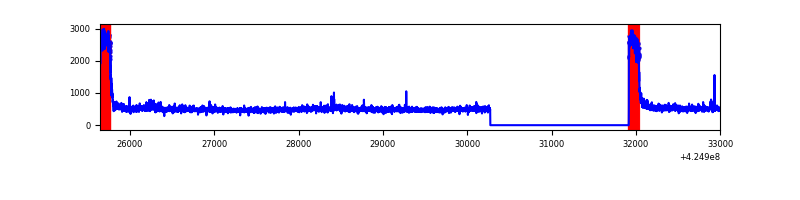 |
| D | 7351 | 5709 | 51 | 51 | 0.69% | 0.89% | 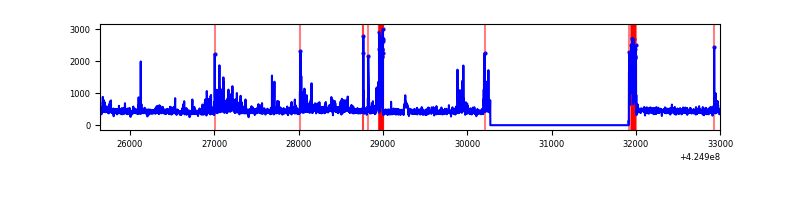 |
Top three noisy pixels from each quadrant. If the there are fewer than three noisy pixels in the level2.evt file, extra rows are filled as -1
| Pixel properties | Quadrant properties | ||||||
|---|---|---|---|---|---|---|---|
| Quadrant | DetID | PixID | Counts | Sigma | Mean | Median | Sigma |
| A | 10 | 83 | 579507 | 4333.06 | 645 | 630 | 133.6 |
| A | 3 | 1 | 23309 | 169.76 | 645 | 630 | 133.6 |
| A | 2 | 79 | 22354 | 162.61 | 645 | 630 | 133.6 |
| B | 5 | 255 | 362690 | 2925.35 | 632 | 614 | 123.8 |
| B | 0 | 186 | 352612 | 2843.93 | 632 | 614 | 123.8 |
| B | 0 | 190 | 30456 | 241.1 | 632 | 614 | 123.8 |
| C | 0 | 10 | 759731 | 5371.92 | 604 | 607 | 141.3 |
| C | 15 | 214 | 228194 | 1610.51 | 604 | 607 | 141.3 |
| C | 4 | 254 | 17772 | 121.47 | 604 | 607 | 141.3 |
| D | 13 | 249 | 149840 | 958.47 | 622 | 602 | 155.7 |
| D | 12 | 6 | 108369 | 692.13 | 622 | 602 | 155.7 |
| D | 2 | 249 | 92336 | 589.16 | 622 | 602 | 155.7 |
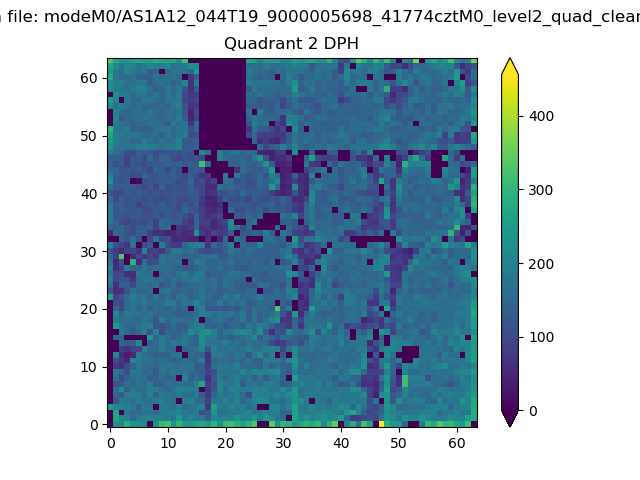
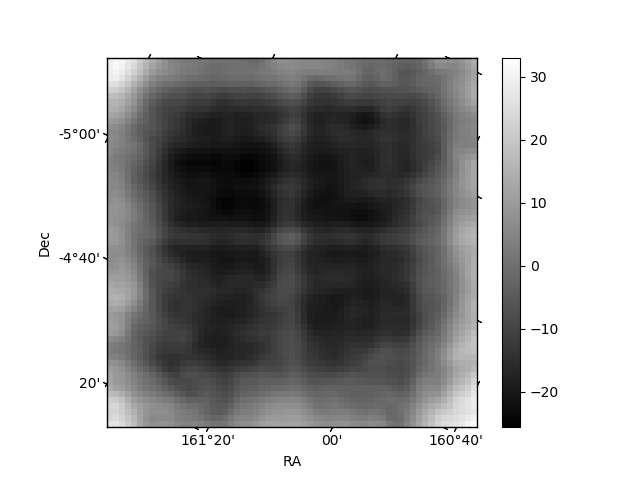
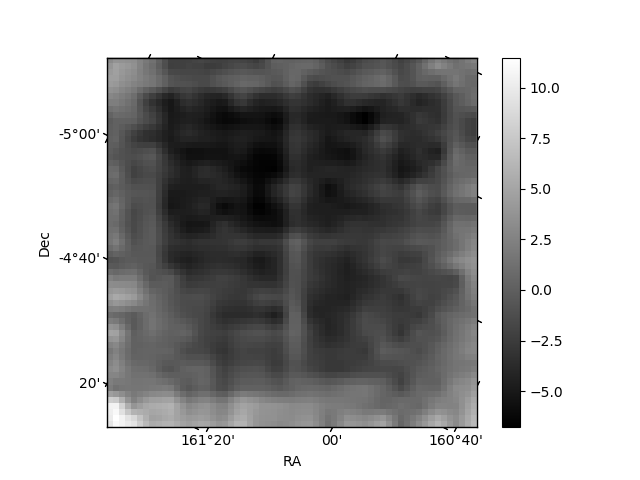
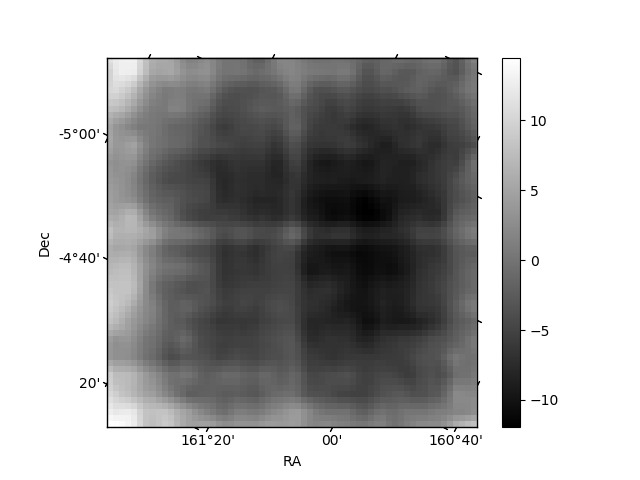
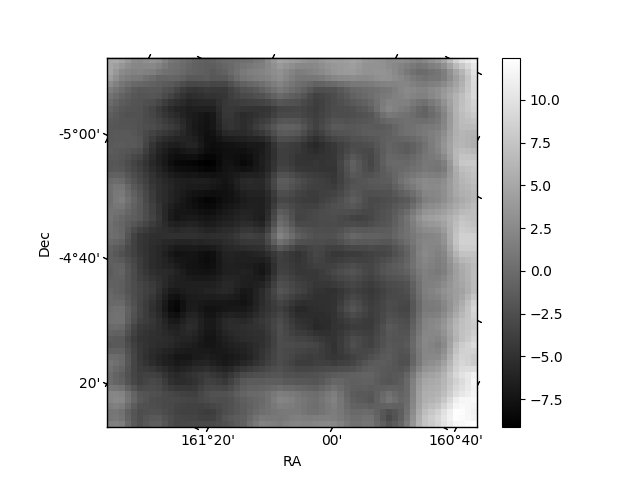
Histogram calculated using DETX and DETY for each event in the final _common_clean file
| Quadrant A | 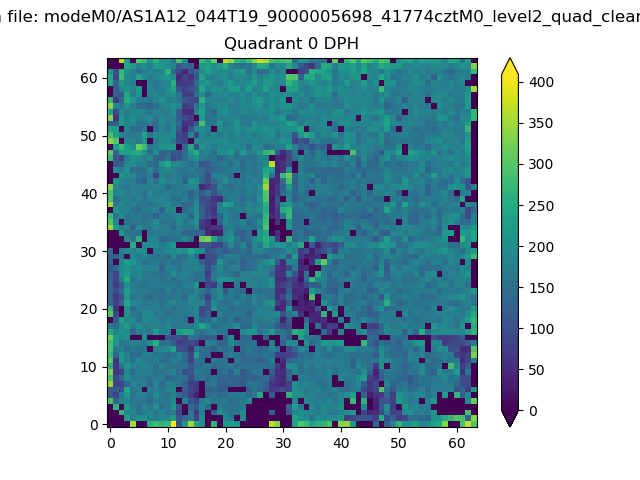 |
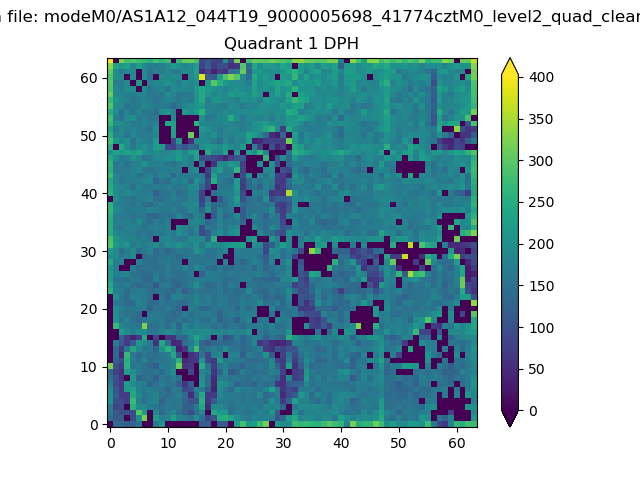 |
Quadrant B |
|---|---|---|---|
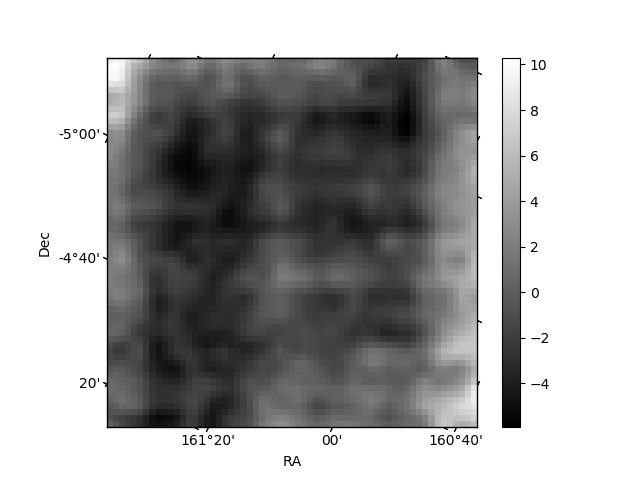
| Quadrant D | 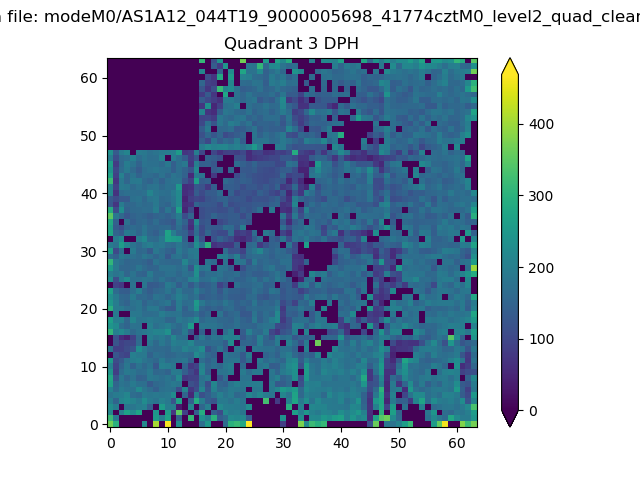 |
 |
Quadrant C |
| Plot type | Count rate plots | Images |
|---|---|---|
| Comparison with Poisson distribution Blue bars denote a histogram of data divided into 1 sec bins. Red curve is a Poisson curve with rate = median count rate of data. |
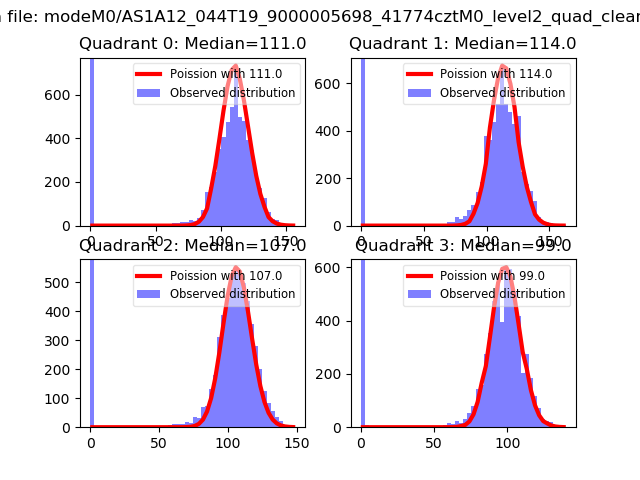 |
 |
| Quadrant-wise count rates Data is divided into 100 sec bins |
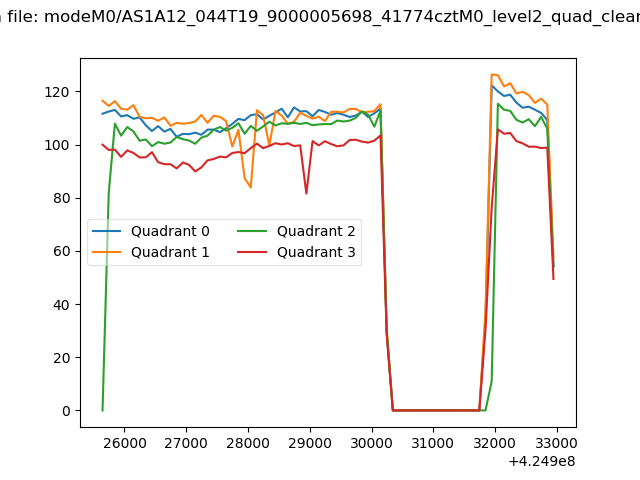 |
|
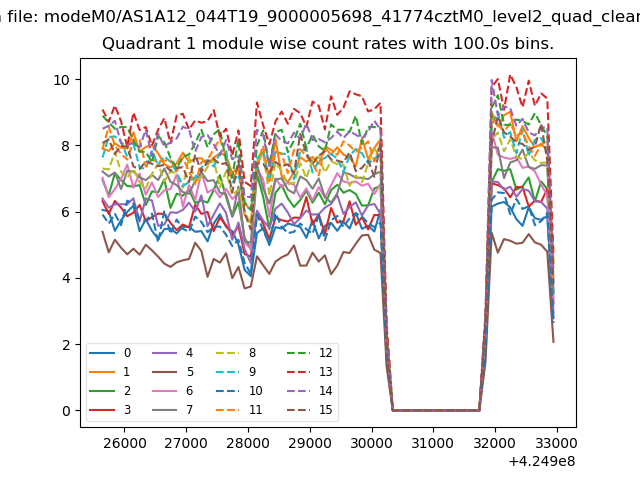
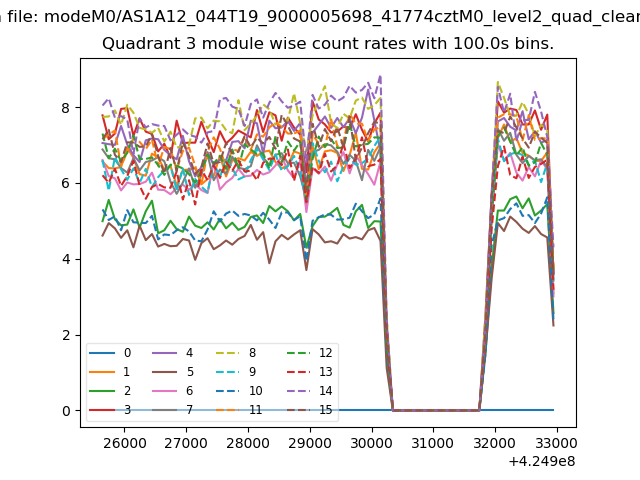
| Module-wise count rates for Quadrant A Data is divided into 100 sec bins |
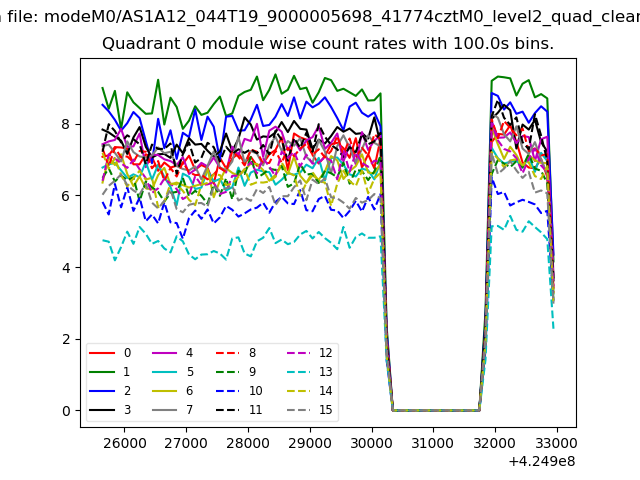 |
 |
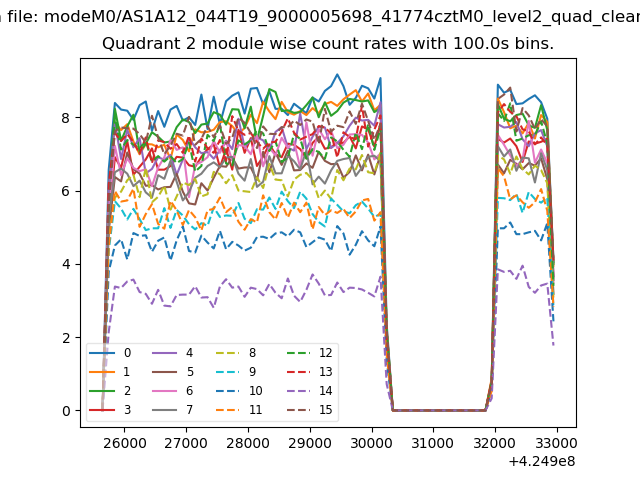
| Module-wise count rates for Quadrant B Data is divided into 100 sec bins |
 |
 |
| Module-wise count rates for Quadrant C Data is divided into 100 sec bins |
 |
 |
| Module-wise count rates for Quadrant D Data is divided into 100 sec bins |
 |
 |
| Parameter | Plot |
|---|---|
| CZT HV Monitor | 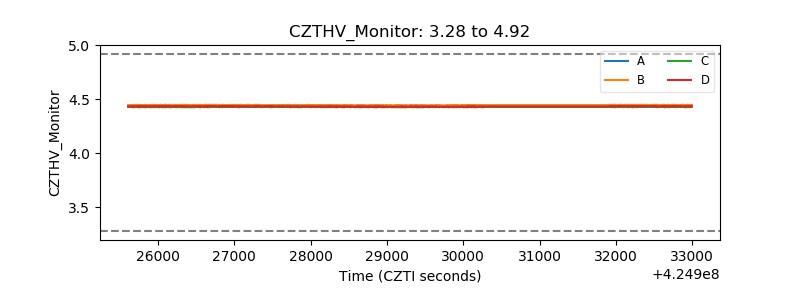 |
| D_VDD | 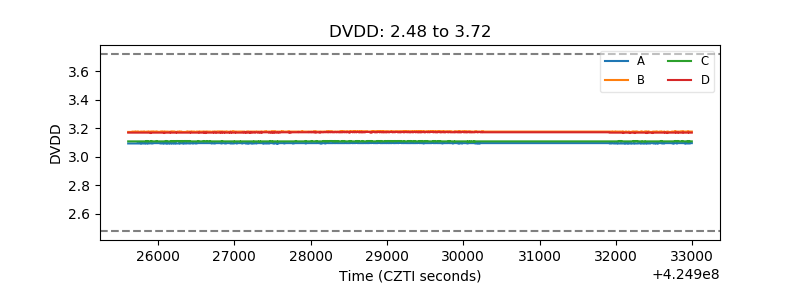 |
| Temperature 1 | 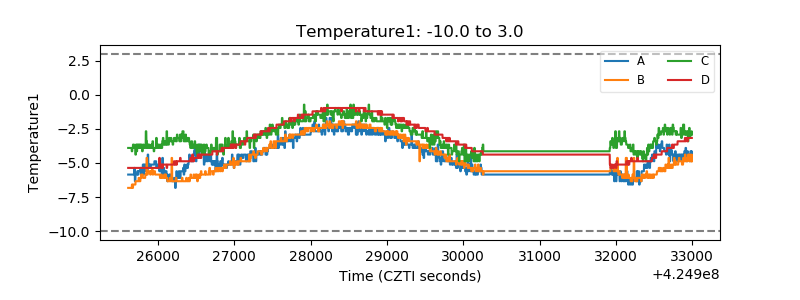 |
| Veto HV Monitor |  |
| Veto LLD | 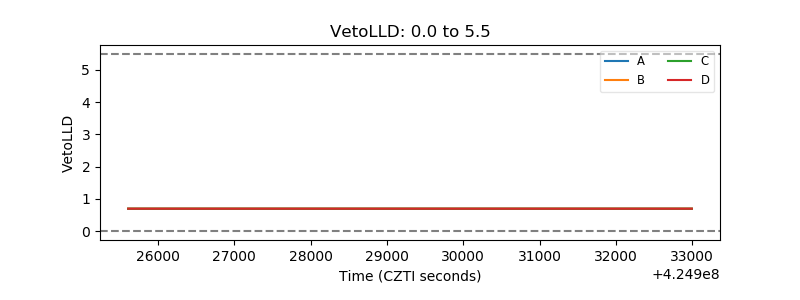 |
| Alpha Counter | 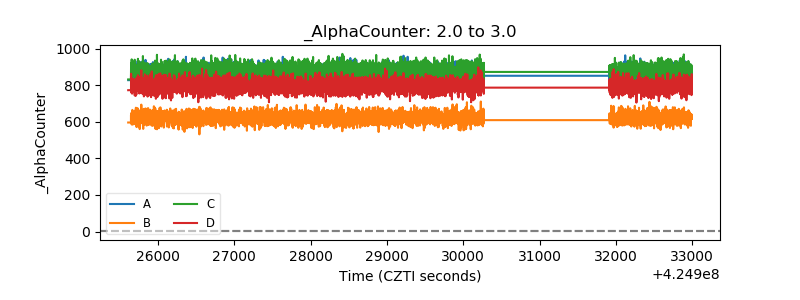 |
| _CPM_Rate | 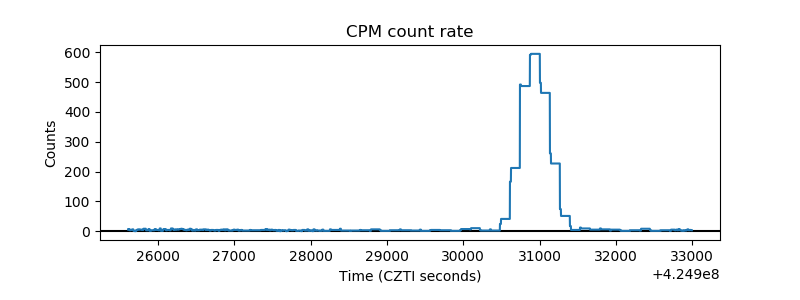 |
| CZT Counter | 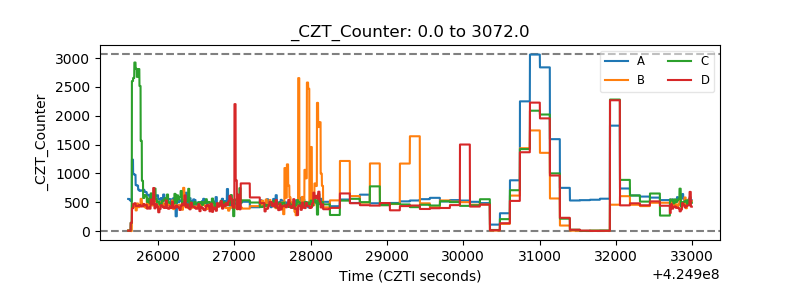 |
| +2.5 Volts monitor | 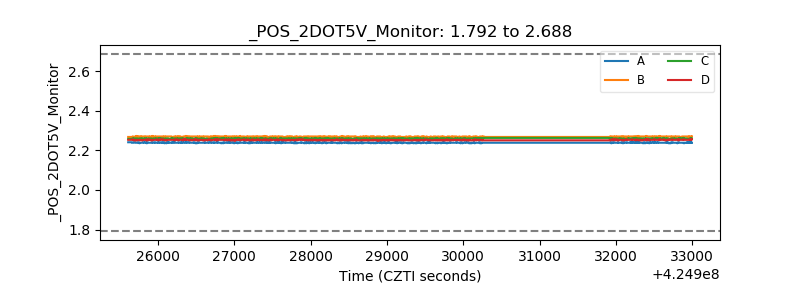 |
| +5 Volts monitor | 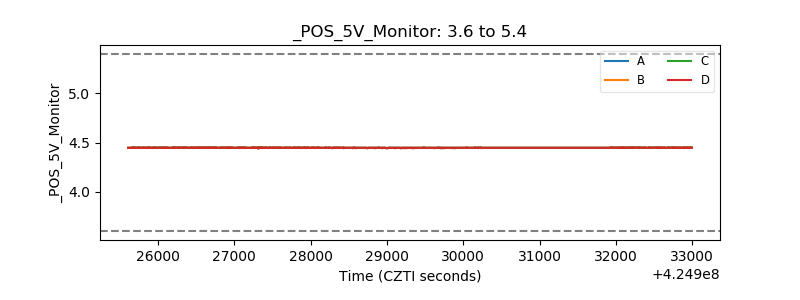 |
| _ROLL_ROT | 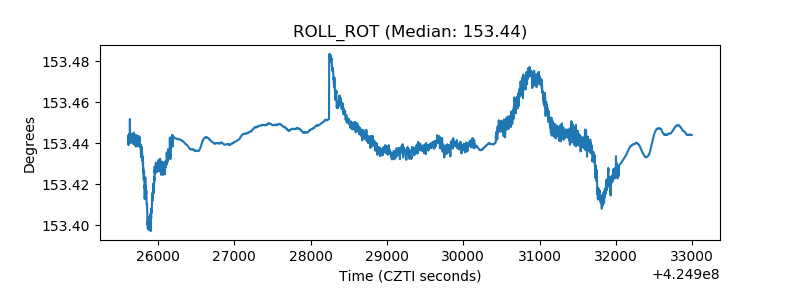 |
| _Roll_DEC | 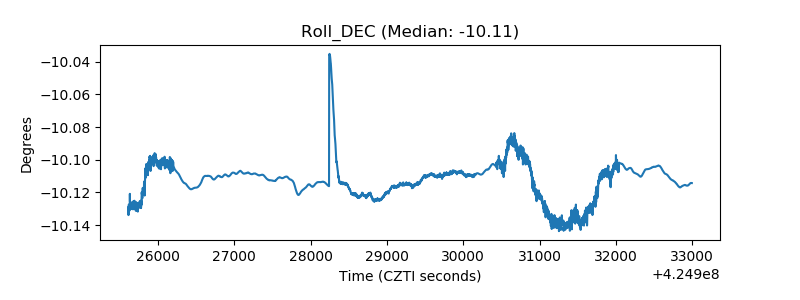 |
| _Roll_RA | 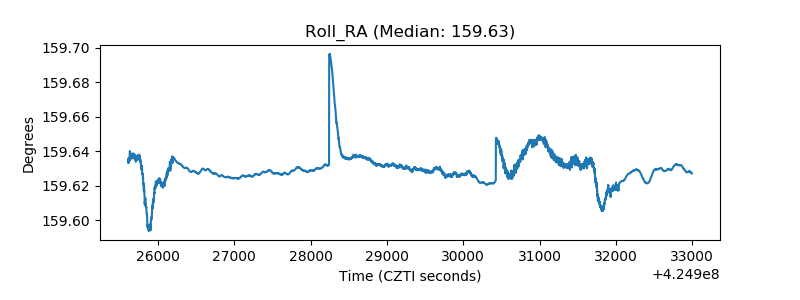 |
| Veto Counter | 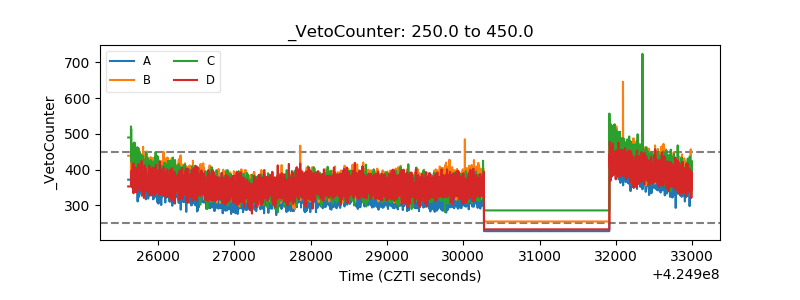 |