| Param | Original file | Final file |
|---|---|---|
| Filename | modeM0/AS1A12_044T19_9000005698_41776cztM0_level2.fits | modeM0/AS1A12_044T19_9000005698_41776cztM0_level2_quad_clean.evt |
| Size (bytes) | 332,225,280 | 89,798,400 |
| Size | 316.8 MB | 85.6 MB |
| Events in quadrant A | 2,997,960 | 614,273 |
| Events in quadrant B | 2,768,451 | 628,543 |
| Events in quadrant C | 3,368,612 | 562,971 |
| Events in quadrant D | 2,748,283 | 540,867 |
| Mode SS | |||
|---|---|---|---|
| Quadrant | BADHDUFLAG | Total packets | Discarded packets |
| A | 0 | 108 | 0 |
| B | 0 | 108 | 0 |
| C | 0 | 108 | 0 |
| D | 0 | 108 | 0 |
| Mode M0 | |||
|---|---|---|---|
| Quadrant | BADHDUFLAG | Total packets | Discarded packets |
| A | 0 | 11992 | 8 |
| B | 0 | 11599 | 2 |
| C | 0 | 12983 | 2 |
| D | 0 | 11892 | 3 |
| Mode M9 | |||
|---|---|---|---|
| Quadrant | BADHDUFLAG | Total packets | Discarded packets |
| A | 0 | 27 | 0 |
| B | 0 | 27 | 0 |
| C | 0 | 27 | 0 |
| D | 0 | 28 | 0 |
| Quadrant | Total seconds | Saturated seconds | Saturation percentage |
|---|---|---|---|
| A | 5320 | 18 | 0.338346% |
| B | 5322 | 36 | 0.676437% |
| C | 5322 | 258 | 4.847802% |
| D | 5321 | 95 | 1.785379% |
Noise dominated data is calculated using 1-second bins in cleaned event files. If a bin has >2000 counts, and if more than 50% of those come from <1% of pixels, then it is considered to be noise-dominated and hence unusable.
| Quadrant | # 1 sec bins | Bins with >0 counts | Bins with >2000 counts | High rate bins dominated by noise | Noise dominated (total time) | Noise dominated (detector-on time) | Marked lightcurve |
|---|---|---|---|---|---|---|---|
| A | 7115 | 5322 | 2 | 2 | 0.03% | 0.04% |  |
| B | 7115 | 5323 | 26 | 26 | 0.37% | 0.49% |  |
| C | 7115 | 5323 | 240 | 240 | 3.37% | 4.51% |  |
| D | 7115 | 5323 | 77 | 77 | 1.08% | 1.45% |  |
Top three noisy pixels from each quadrant. If the there are fewer than three noisy pixels in the level2.evt file, extra rows are filled as -1
| Pixel properties | Quadrant properties | ||||||
|---|---|---|---|---|---|---|---|
| Quadrant | DetID | PixID | Counts | Sigma | Mean | Median | Sigma |
| A | 10 | 83 | 558467 | 4387.82 | 616 | 604 | 127.1 |
| A | 15 | 223 | 20465 | 156.21 | 616 | 604 | 127.1 |
| A | 3 | 1 | 13523 | 101.61 | 616 | 604 | 127.1 |
| B | 0 | 186 | 213118 | 1826.41 | 604 | 589 | 116.4 |
| B | 4 | 141 | 60626 | 515.94 | 604 | 589 | 116.4 |
| B | 4 | 81 | 25599 | 214.93 | 604 | 589 | 116.4 |
| C | 0 | 10 | 836714 | 6246.95 | 572 | 575 | 133.8 |
| C | 15 | 214 | 216259 | 1611.42 | 572 | 575 | 133.8 |
| C | 4 | 254 | 68407 | 506.79 | 572 | 575 | 133.8 |
| D | 2 | 249 | 251585 | 1713.5 | 594 | 577 | 146.5 |
| D | 12 | 6 | 108580 | 737.28 | 594 | 577 | 146.5 |
| D | 13 | 249 | 37756 | 253.8 | 594 | 577 | 146.5 |
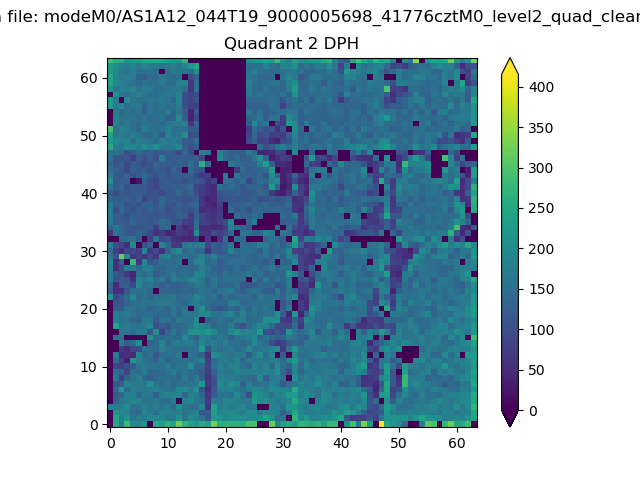
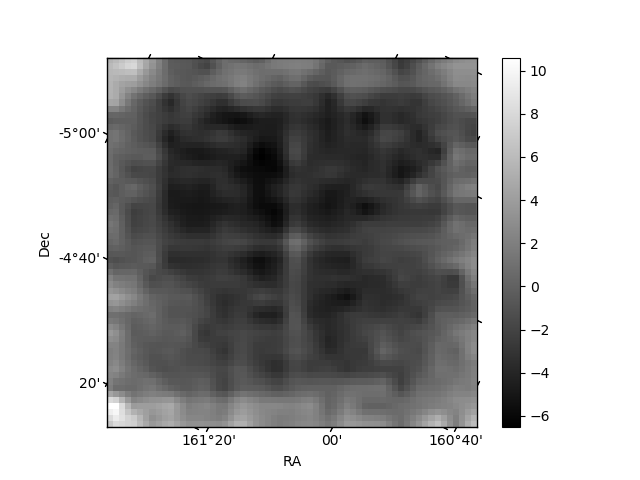
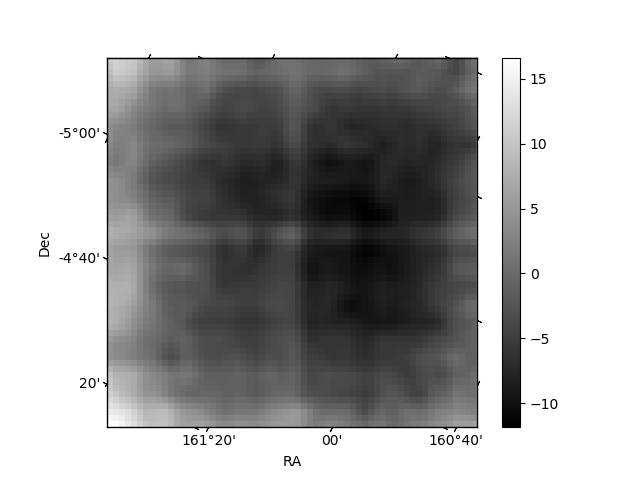
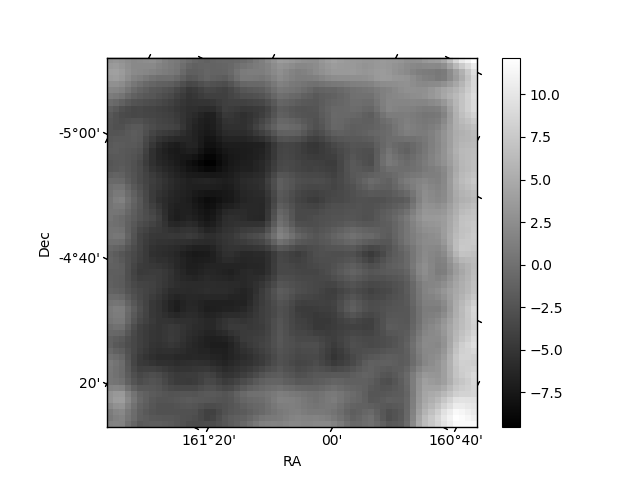
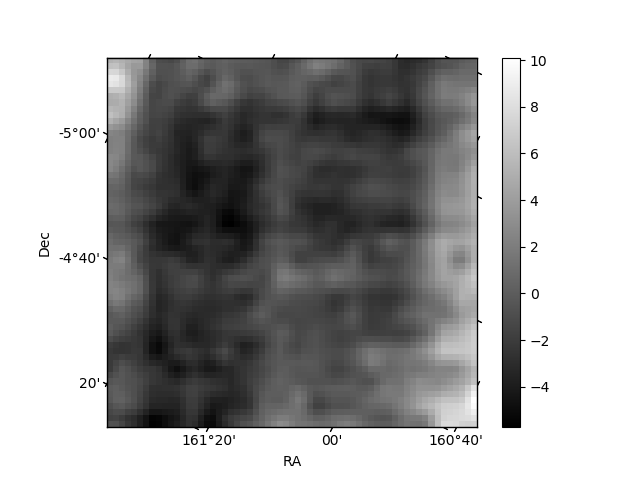
Histogram calculated using DETX and DETY for each event in the final _common_clean file
| Quadrant A | 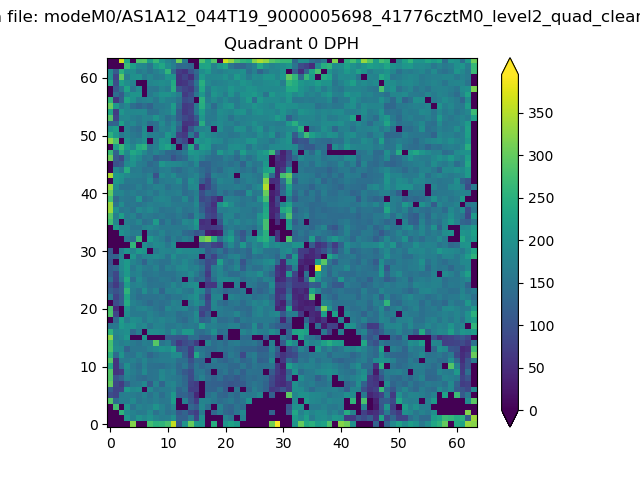 |
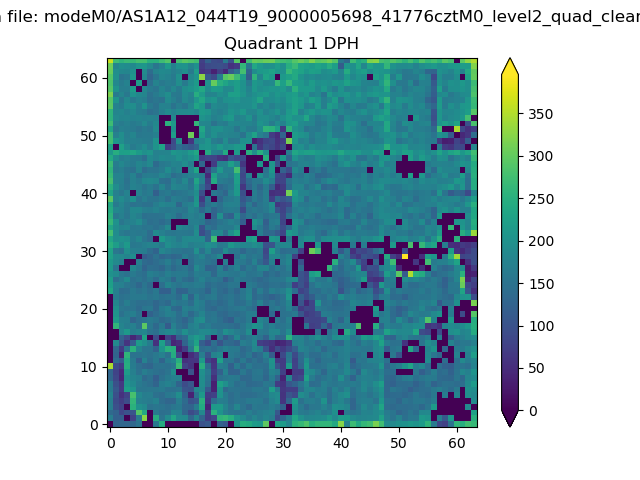 |
Quadrant B |
|---|---|---|---|
| Quadrant D | 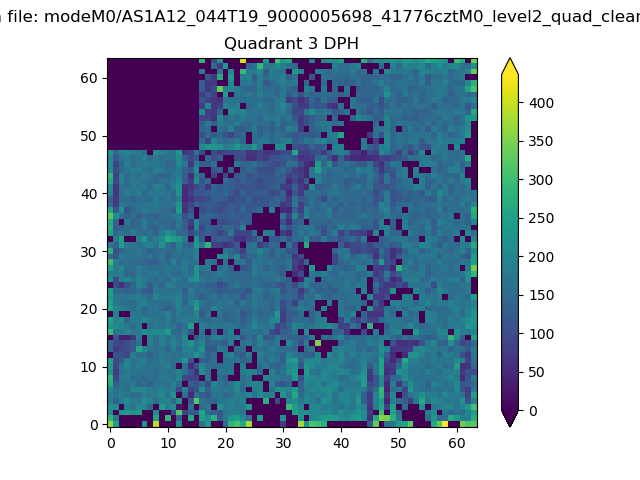 |
 |
Quadrant C |
| Plot type | Count rate plots | Images |
|---|---|---|
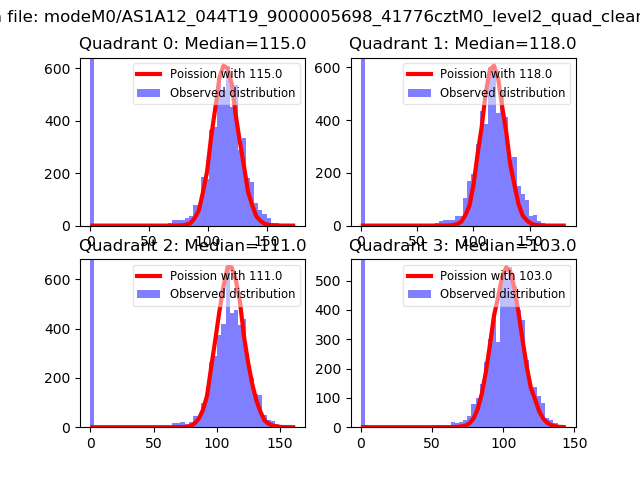
| Comparison with Poisson distribution Blue bars denote a histogram of data divided into 1 sec bins. Red curve is a Poisson curve with rate = median count rate of data. |
 |
 |
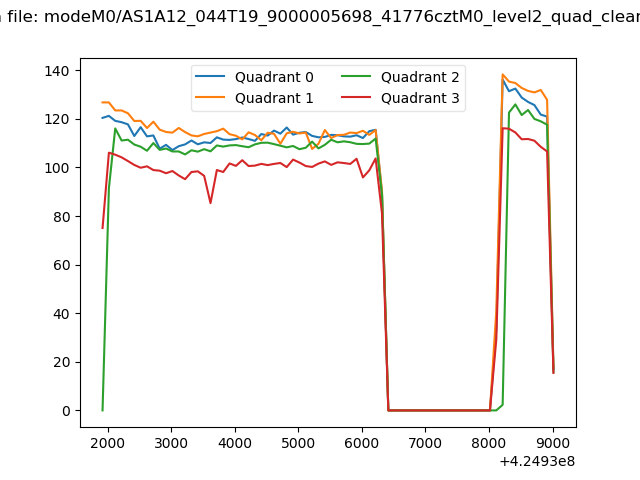
| Quadrant-wise count rates Data is divided into 100 sec bins |
 |
|
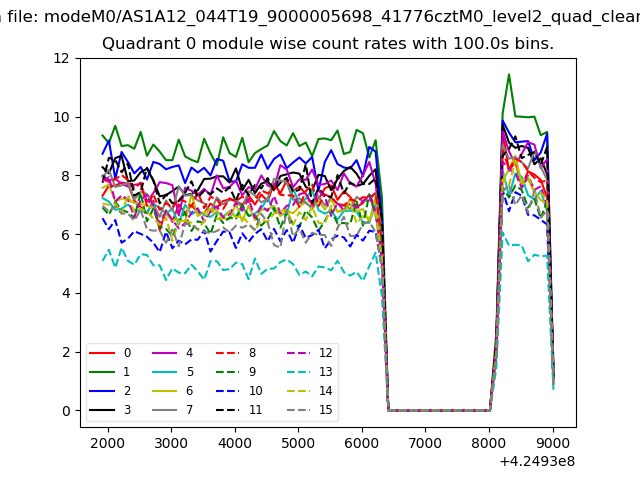
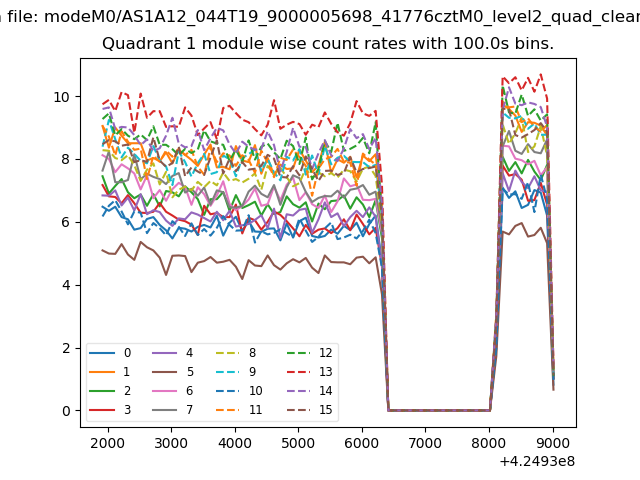
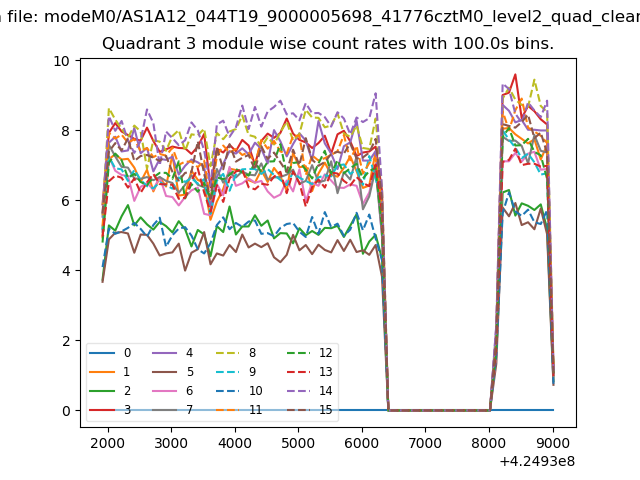
| Module-wise count rates for Quadrant A Data is divided into 100 sec bins |
 |
 |
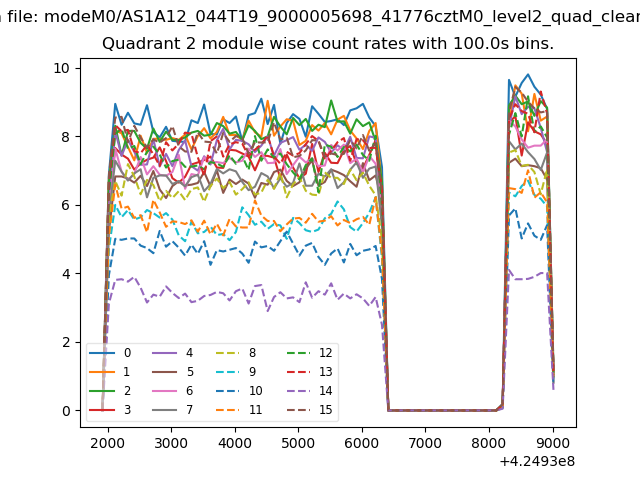
| Module-wise count rates for Quadrant B Data is divided into 100 sec bins |
 |
 |
| Module-wise count rates for Quadrant C Data is divided into 100 sec bins |
 |
 |
| Module-wise count rates for Quadrant D Data is divided into 100 sec bins |
 |
 |
| Parameter | Plot |
|---|---|
| CZT HV Monitor | 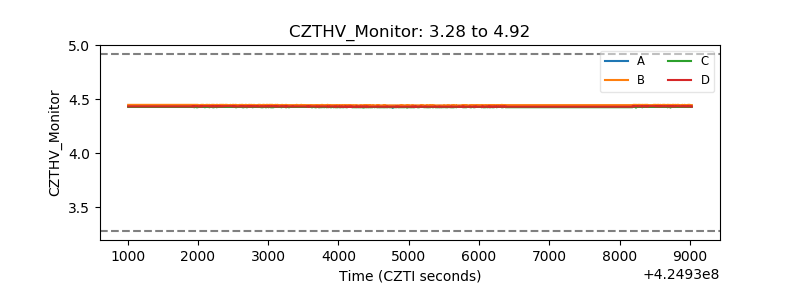 |
| D_VDD | 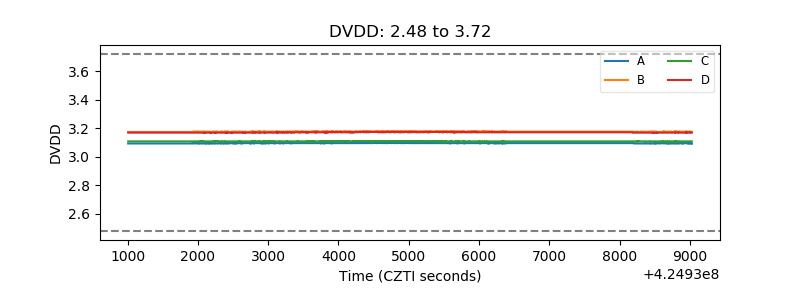 |
| Temperature 1 | 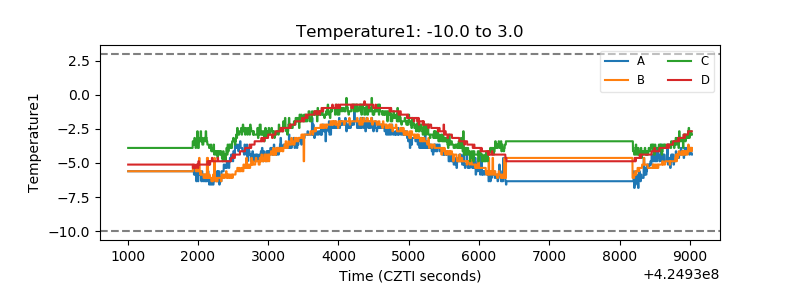 |
| Veto HV Monitor | 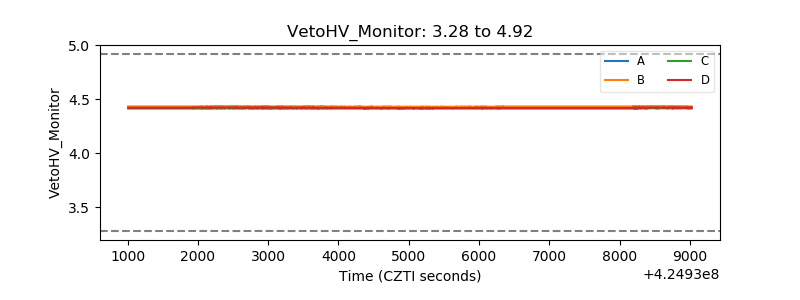 |
| Veto LLD | 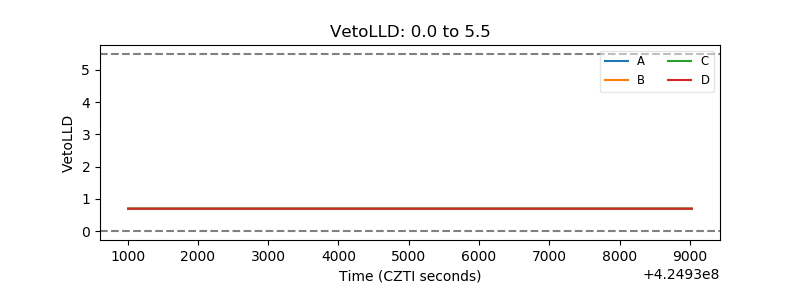 |
| Alpha Counter | 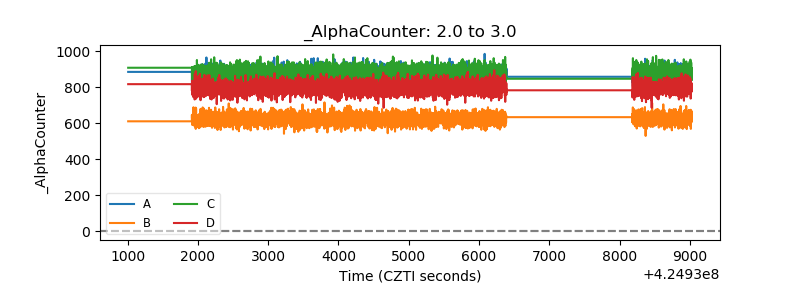 |
| _CPM_Rate | 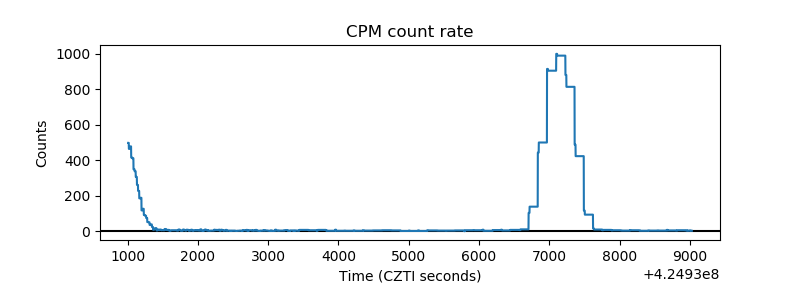 |
| CZT Counter | 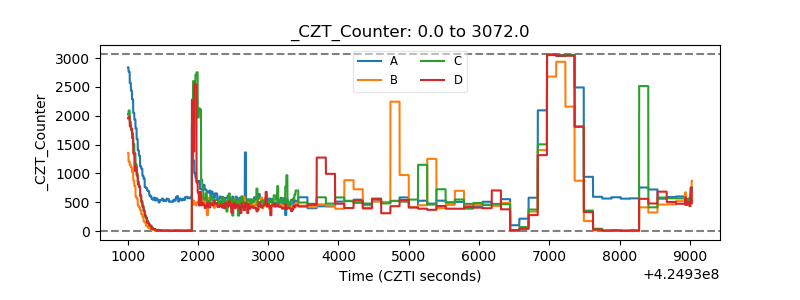 |
| +2.5 Volts monitor | 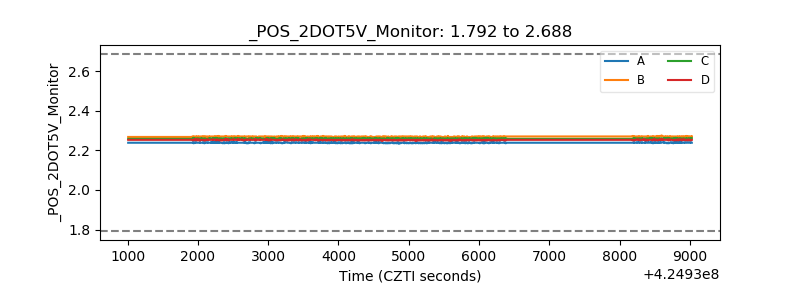 |
| +5 Volts monitor | 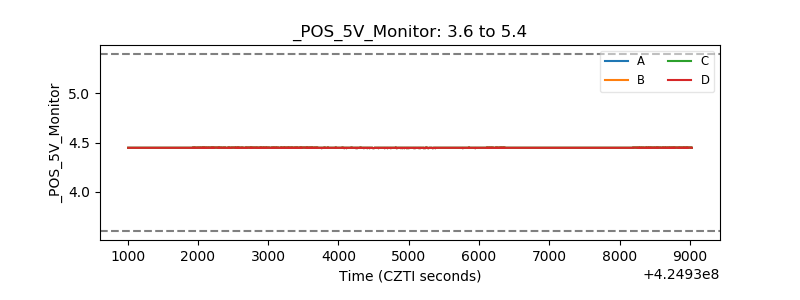 |
| _ROLL_ROT | 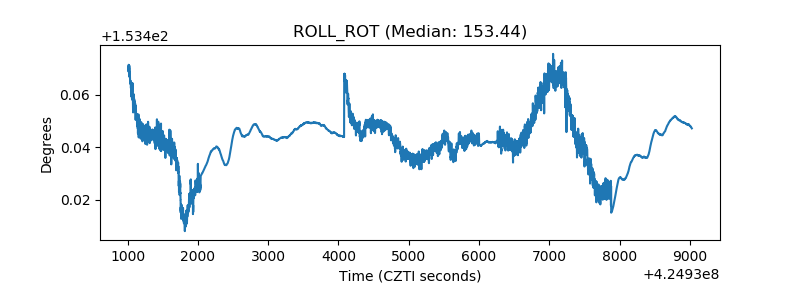 |
| _Roll_DEC | 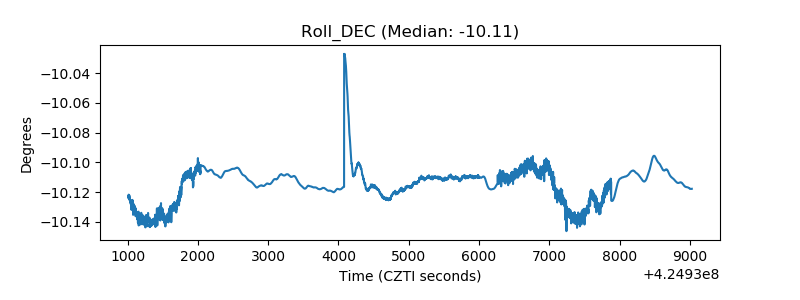 |
| _Roll_RA | 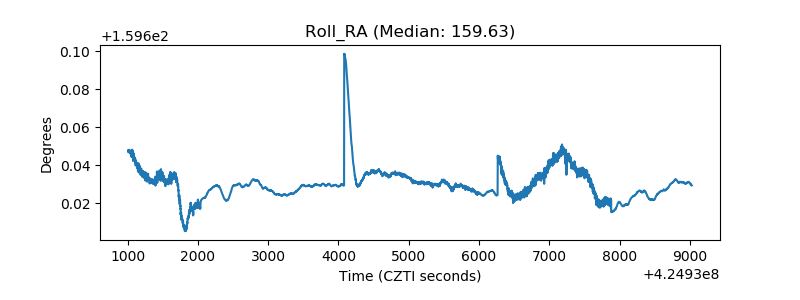 |
| Veto Counter | 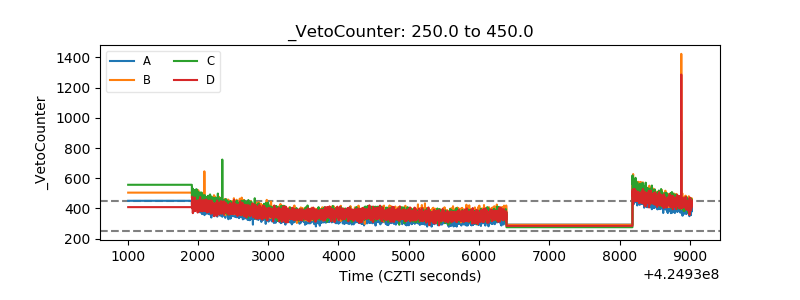 |