| Param | Original file | Final file |
|---|---|---|
| Filename | modeM0/AS1A12_044T19_9000005698_41777cztM0_level2.fits | modeM0/AS1A12_044T19_9000005698_41777cztM0_level2_quad_clean.evt |
| Size (bytes) | 324,319,680 | 89,847,360 |
| Size | 309.3 MB | 85.7 MB |
| Events in quadrant A | 2,943,055 | 621,172 |
| Events in quadrant B | 2,835,541 | 626,429 |
| Events in quadrant C | 3,195,421 | 564,472 |
| Events in quadrant D | 2,633,033 | 550,300 |
| Mode SS | |||
|---|---|---|---|
| Quadrant | BADHDUFLAG | Total packets | Discarded packets |
| A | 0 | 106 | 0 |
| B | 0 | 106 | 0 |
| C | 0 | 106 | 0 |
| D | 0 | 106 | 0 |
| Mode M0 | |||
|---|---|---|---|
| Quadrant | BADHDUFLAG | Total packets | Discarded packets |
| A | 0 | 11765 | 3 |
| B | 0 | 11544 | 2 |
| C | 0 | 12412 | 2 |
| D | 0 | 11267 | 2 |
| Mode M9 | |||
|---|---|---|---|
| Quadrant | BADHDUFLAG | Total packets | Discarded packets |
| A | 0 | 32 | 0 |
| B | 0 | 32 | 0 |
| C | 0 | 32 | 0 |
| D | 0 | 33 | 0 |
| Quadrant | Total seconds | Saturated seconds | Saturation percentage |
|---|---|---|---|
| A | 5109 | 17 | 0.332746% |
| B | 5109 | 101 | 1.976904% |
| C | 5109 | 272 | 5.323938% |
| D | 5109 | 64 | 1.252691% |
Noise dominated data is calculated using 1-second bins in cleaned event files. If a bin has >2000 counts, and if more than 50% of those come from <1% of pixels, then it is considered to be noise-dominated and hence unusable.
| Quadrant | # 1 sec bins | Bins with >0 counts | Bins with >2000 counts | High rate bins dominated by noise | Noise dominated (total time) | Noise dominated (detector-on time) | Marked lightcurve |
|---|---|---|---|---|---|---|---|
| A | 7052 | 5110 | 2 | 2 | 0.03% | 0.04% | 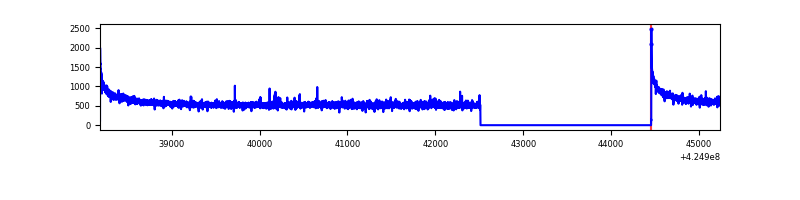 |
| B | 7052 | 5110 | 90 | 90 | 1.28% | 1.76% | 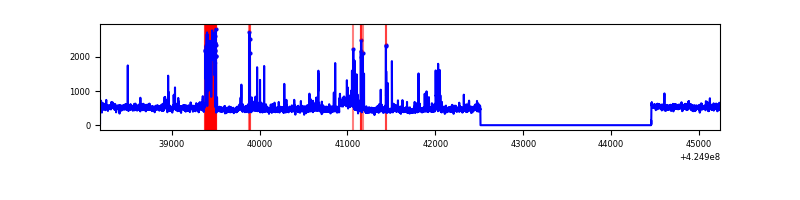 |
| C | 7052 | 5110 | 256 | 256 | 3.63% | 5.01% | 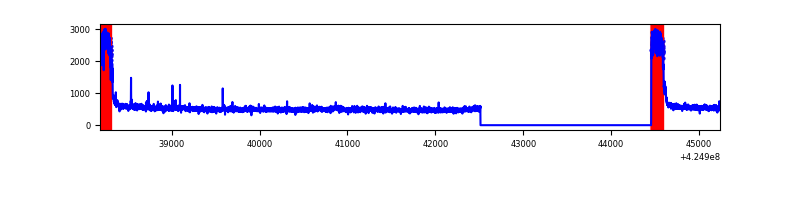 |
| D | 7052 | 5110 | 64 | 64 | 0.91% | 1.25% | 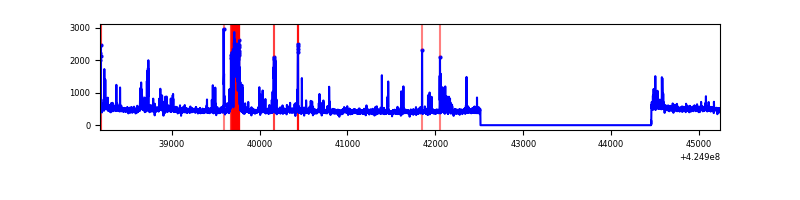 |
Top three noisy pixels from each quadrant. If the there are fewer than three noisy pixels in the level2.evt file, extra rows are filled as -1
| Pixel properties | Quadrant properties | ||||||
|---|---|---|---|---|---|---|---|
| Quadrant | DetID | PixID | Counts | Sigma | Mean | Median | Sigma |
| A | 10 | 83 | 542394 | 4300.88 | 608 | 597 | 126.0 |
| A | 2 | 79 | 30688 | 238.87 | 608 | 597 | 126.0 |
| A | 3 | 1 | 17211 | 131.88 | 608 | 597 | 126.0 |
| B | 3 | 112 | 230843 | 2000.54 | 594 | 578 | 115.1 |
| B | 4 | 141 | 92581 | 799.32 | 594 | 578 | 115.1 |
| B | 0 | 186 | 66050 | 568.82 | 594 | 578 | 115.1 |
| C | 0 | 10 | 789808 | 6049.2 | 560 | 565 | 130.5 |
| C | 15 | 214 | 203408 | 1554.7 | 560 | 565 | 130.5 |
| C | 4 | 254 | 11719 | 85.49 | 560 | 565 | 130.5 |
| D | 2 | 249 | 267747 | 1853.04 | 589 | 571 | 144.2 |
| D | 13 | 249 | 49436 | 338.91 | 589 | 571 | 144.2 |
| D | 2 | 234 | 25430 | 172.41 | 589 | 571 | 144.2 |
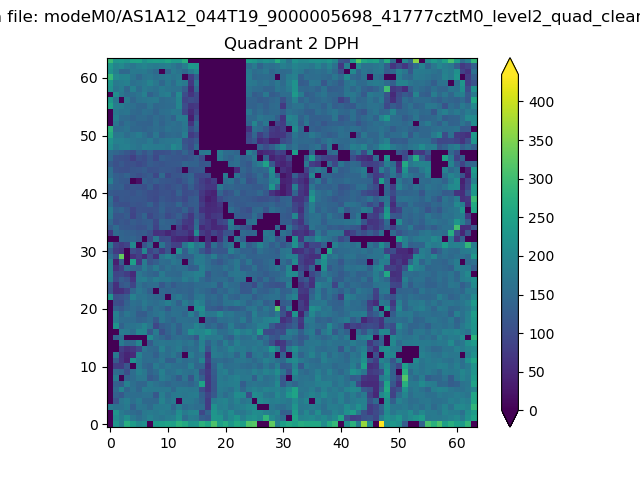
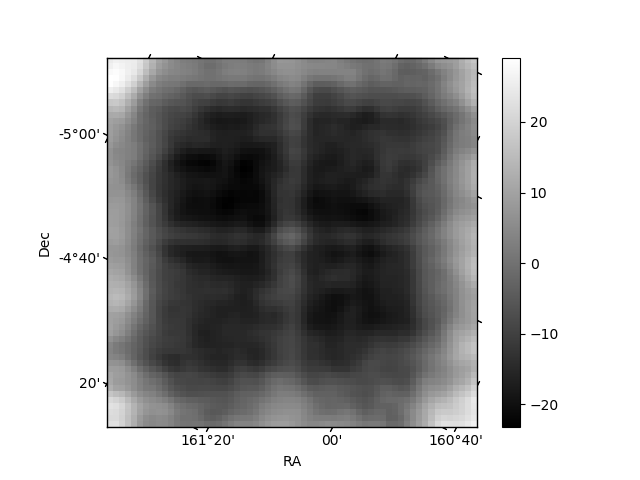
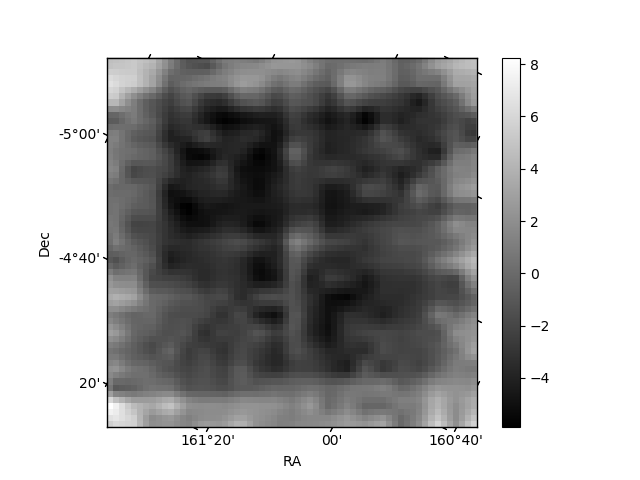
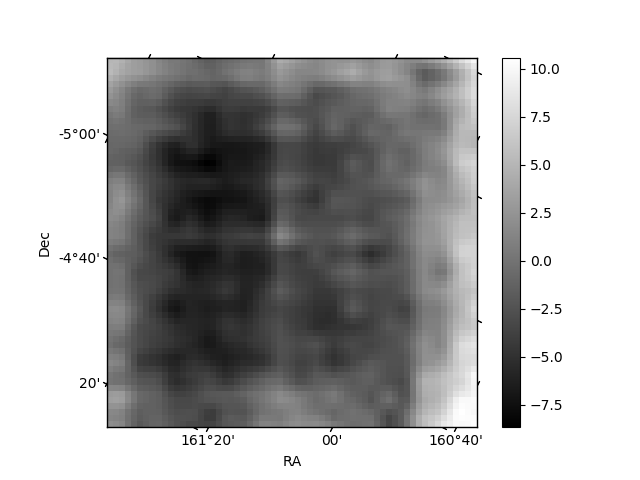
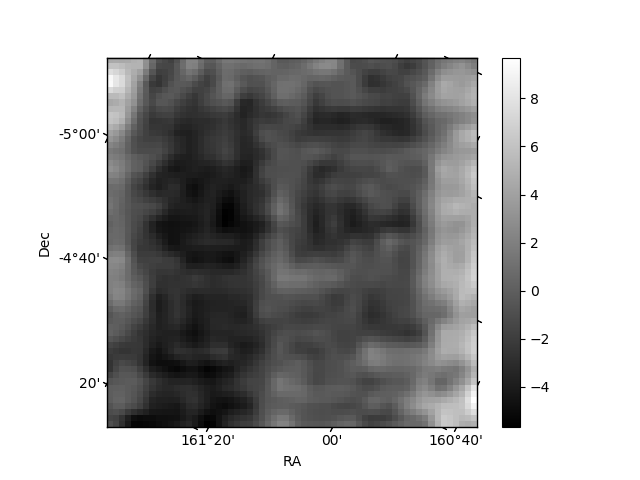
Histogram calculated using DETX and DETY for each event in the final _common_clean file
| Quadrant A | 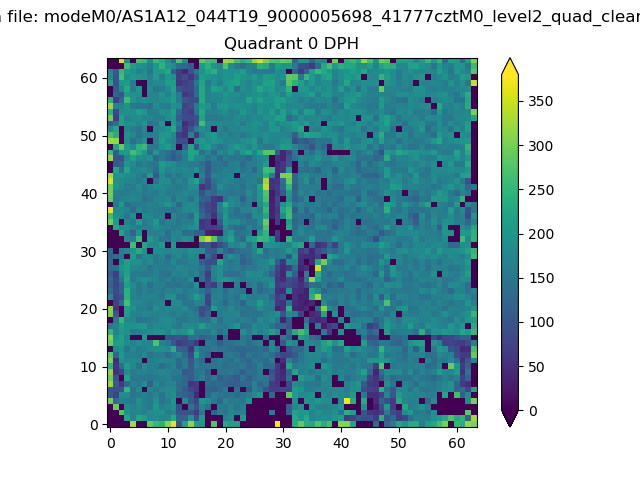 |
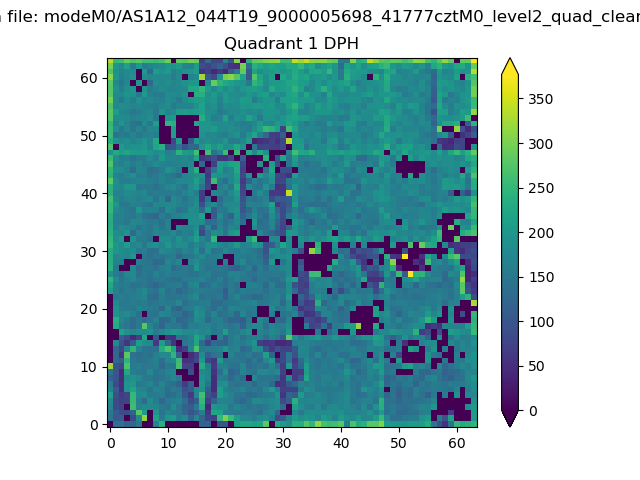 |
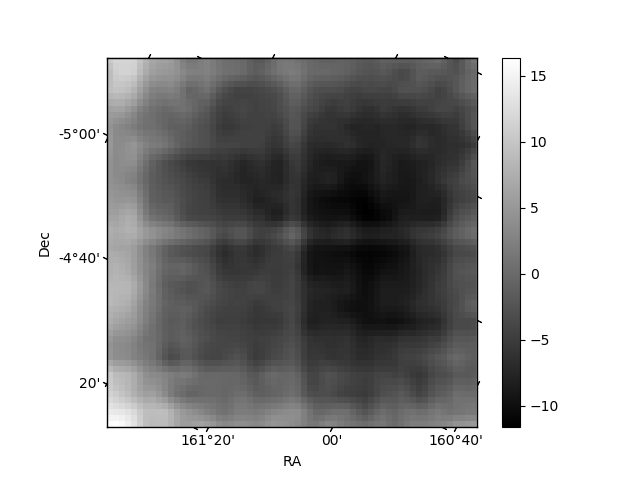
Quadrant B |
|---|---|---|---|
| Quadrant D | 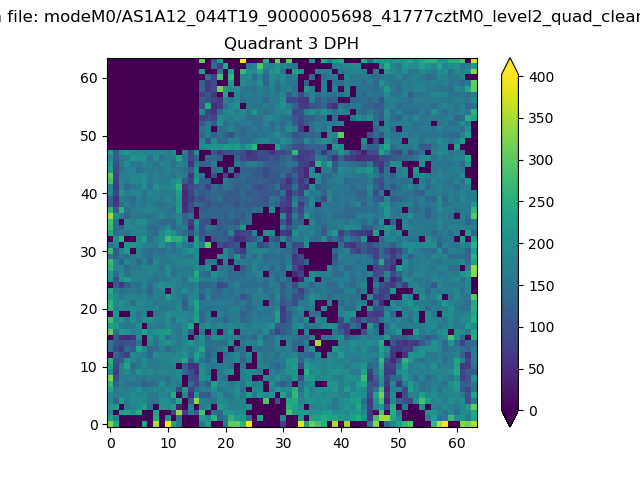 |
 |
Quadrant C |
| Plot type | Count rate plots | Images |
|---|---|---|
| Comparison with Poisson distribution Blue bars denote a histogram of data divided into 1 sec bins. Red curve is a Poisson curve with rate = median count rate of data. |
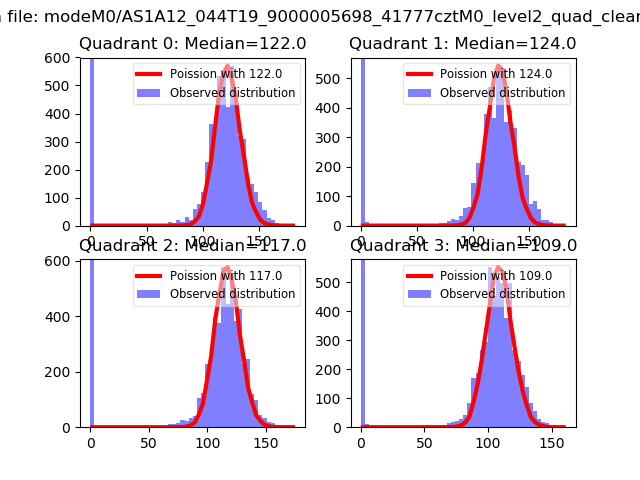 |
 |
| Quadrant-wise count rates Data is divided into 100 sec bins |
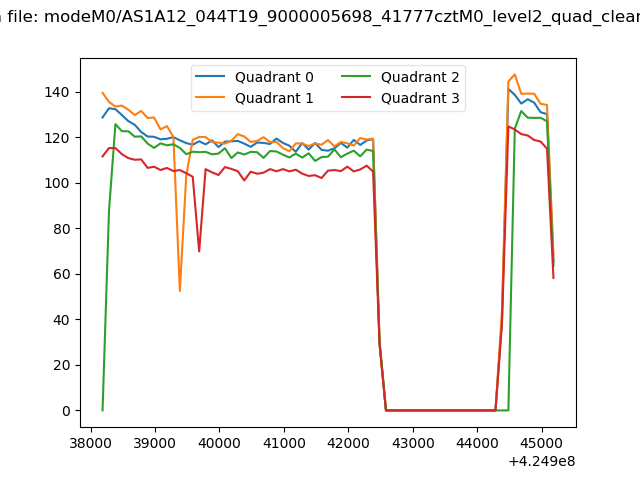 |
|
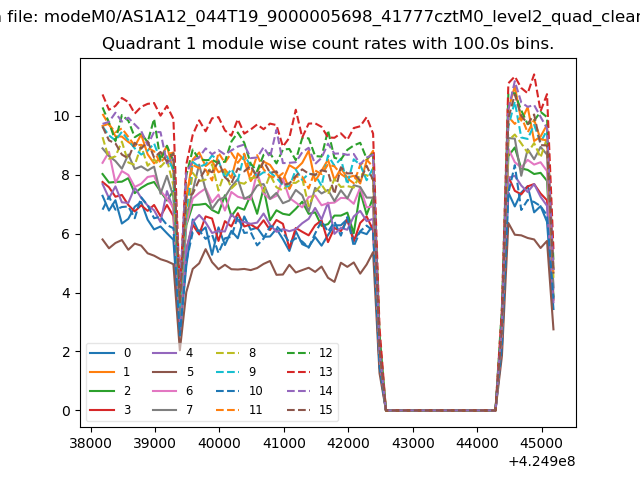
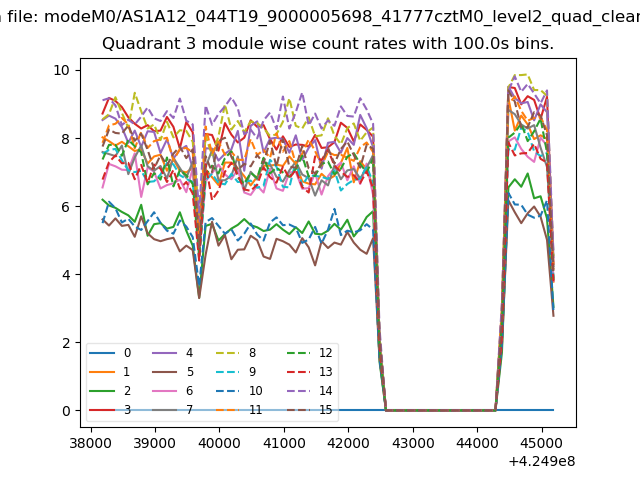
| Module-wise count rates for Quadrant A Data is divided into 100 sec bins |
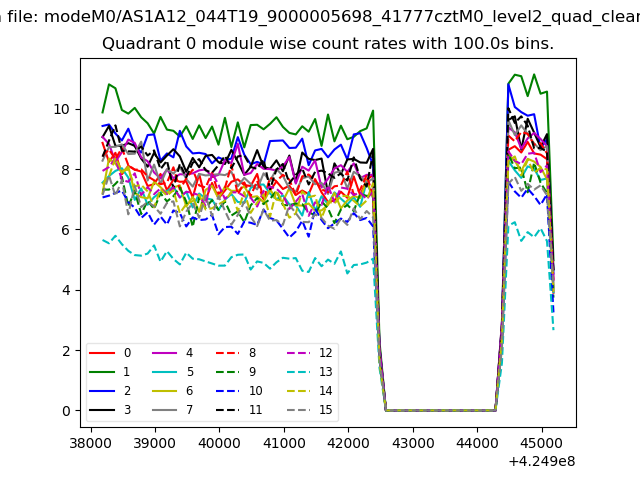 |
 |
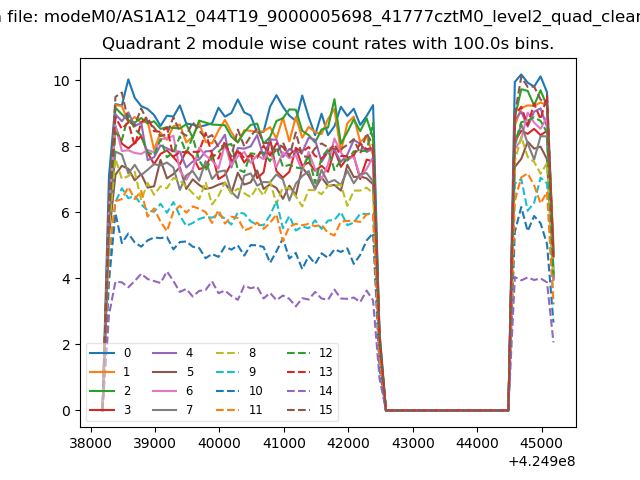
| Module-wise count rates for Quadrant B Data is divided into 100 sec bins |
 |
 |
| Module-wise count rates for Quadrant C Data is divided into 100 sec bins |
 |
 |
| Module-wise count rates for Quadrant D Data is divided into 100 sec bins |
 |
 |
| Parameter | Plot |
|---|---|
| CZT HV Monitor | 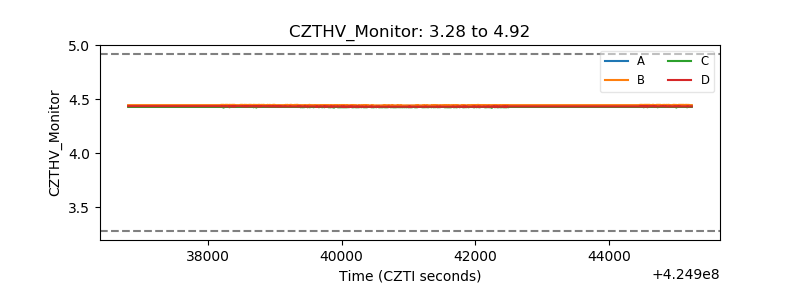 |
| D_VDD | 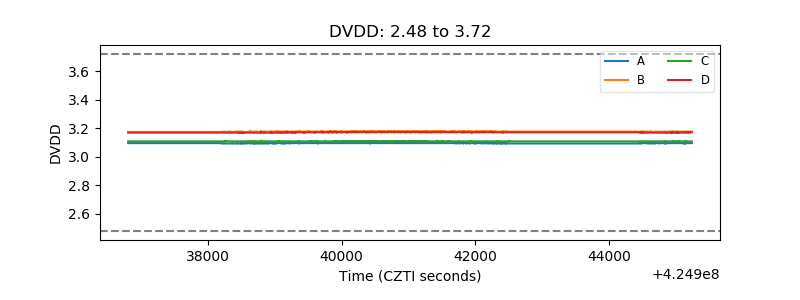 |
| Temperature 1 | 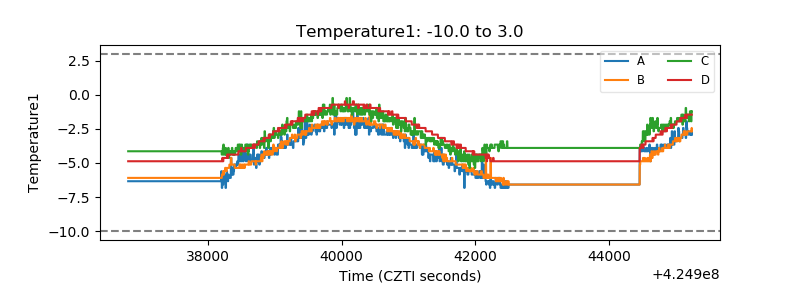 |
| Veto HV Monitor | 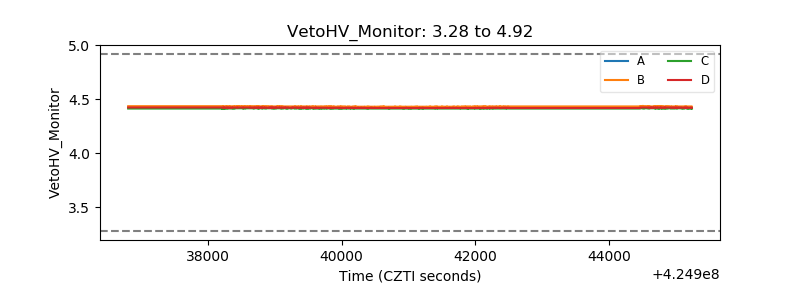 |
| Veto LLD | 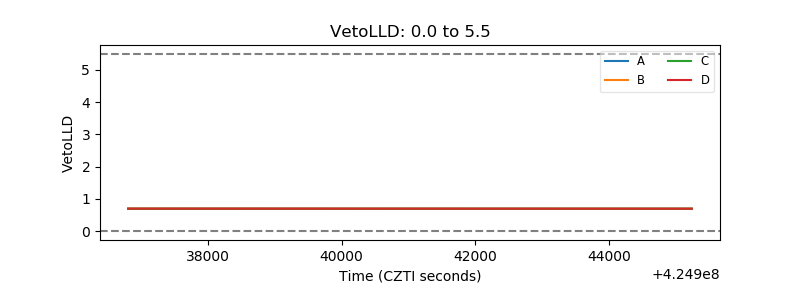 |
| Alpha Counter | 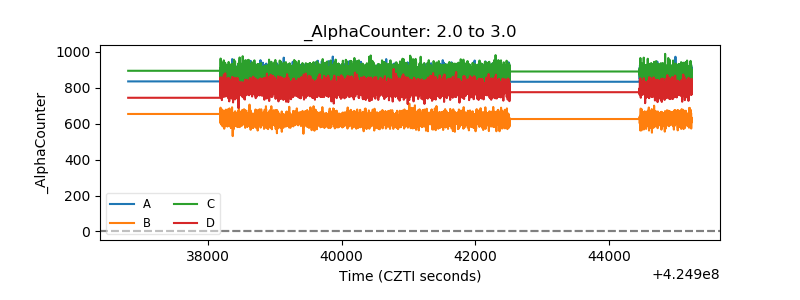 |
| _CPM_Rate | 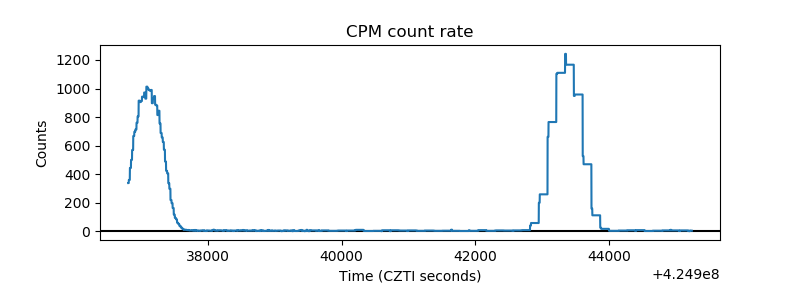 |
| CZT Counter | 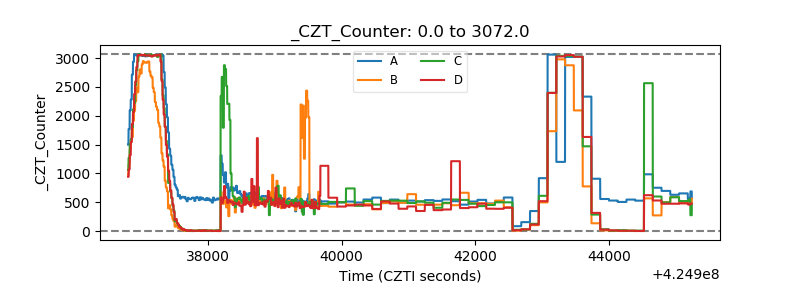 |
| +2.5 Volts monitor | 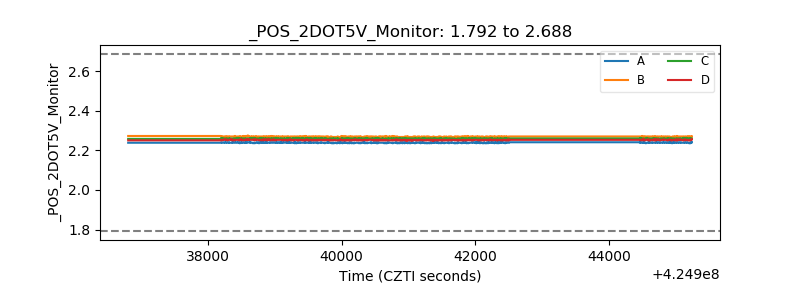 |
| +5 Volts monitor | 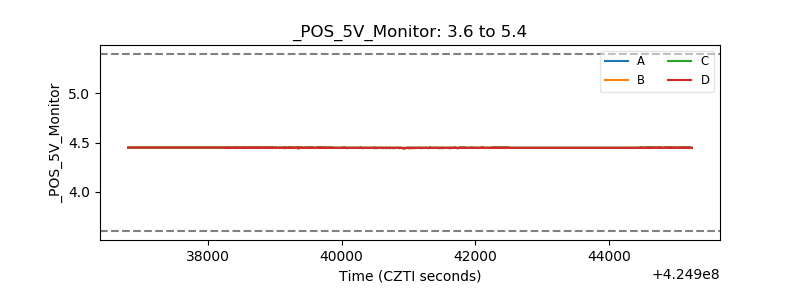 |
| _ROLL_ROT | 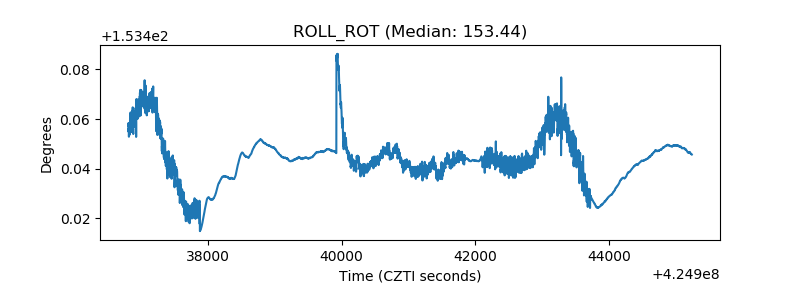 |
| _Roll_DEC | 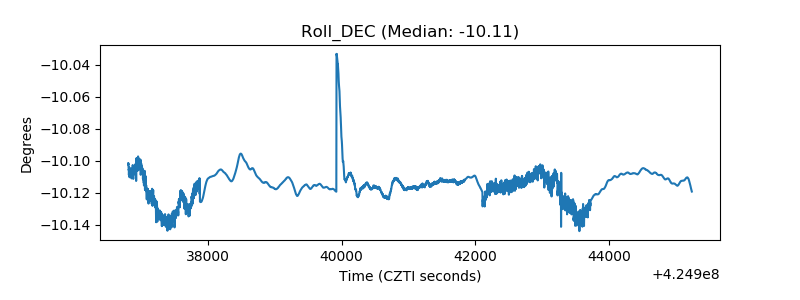 |
| _Roll_RA | 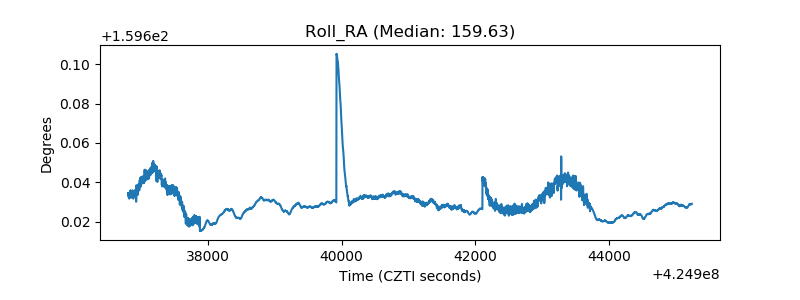 |
| Veto Counter | 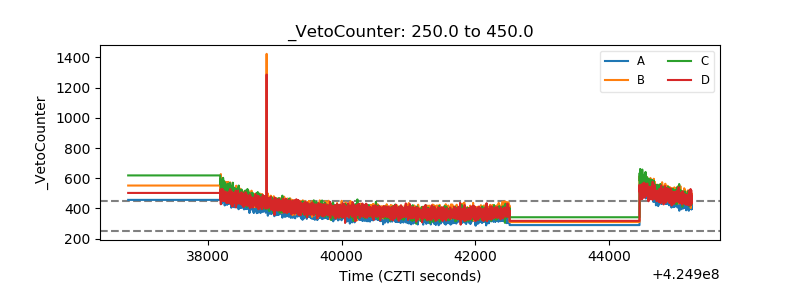 |