| Param | Original file | Final file |
|---|---|---|
| Filename | modeM0/AS1A12_044T19_9000005698_41778cztM0_level2.fits | modeM0/AS1A12_044T19_9000005698_41778cztM0_level2_quad_clean.evt |
| Size (bytes) | 241,591,680 | 62,665,920 |
| Size | 230.4 MB | 59.8 MB |
| Events in quadrant A | 2,113,792 | 439,174 |
| Events in quadrant B | 2,721,970 | 418,018 |
| Events in quadrant C | 2,118,732 | 400,090 |
| Events in quadrant D | 1,713,975 | 392,007 |
| Mode SS | |||
|---|---|---|---|
| Quadrant | BADHDUFLAG | Total packets | Discarded packets |
| A | 0 | 70 | 0 |
| B | 0 | 70 | 0 |
| C | 0 | 70 | 0 |
| D | 0 | 70 | 0 |
| Mode M0 | |||
|---|---|---|---|
| Quadrant | BADHDUFLAG | Total packets | Discarded packets |
| A | 0 | 8370 | 1 |
| B | 0 | 10269 | 1 |
| C | 0 | 8282 | 1 |
| D | 0 | 7454 | 1 |
| Mode M9 | |||
|---|---|---|---|
| Quadrant | BADHDUFLAG | Total packets | Discarded packets |
| A | 0 | 7 | 0 |
| B | 0 | 7 | 0 |
| C | 0 | 7 | 0 |
| D | 0 | 8 | 0 |
| Quadrant | Total seconds | Saturated seconds | Saturation percentage |
|---|---|---|---|
| A | 3510 | 17 | 0.484330% |
| B | 3510 | 282 | 8.034188% |
| C | 3510 | 140 | 3.988604% |
| D | 3510 | 7 | 0.199430% |
Noise dominated data is calculated using 1-second bins in cleaned event files. If a bin has >2000 counts, and if more than 50% of those come from <1% of pixels, then it is considered to be noise-dominated and hence unusable.
| Quadrant | # 1 sec bins | Bins with >0 counts | Bins with >2000 counts | High rate bins dominated by noise | Noise dominated (total time) | Noise dominated (detector-on time) | Marked lightcurve |
|---|---|---|---|---|---|---|---|
| A | 3510 | 3510 | 7 | 7 | 0.20% | 0.20% | 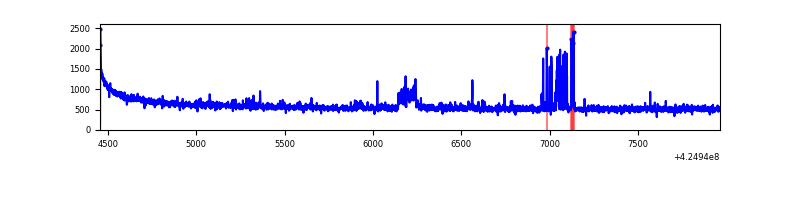 |
| B | 3510 | 3510 | 262 | 262 | 7.46% | 7.46% | 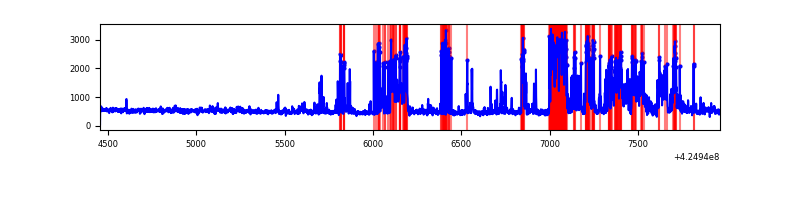 |
| C | 3510 | 3510 | 140 | 140 | 3.99% | 3.99% | 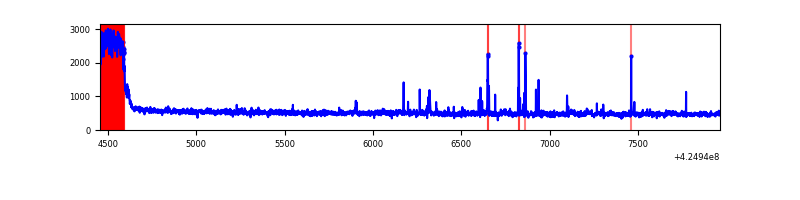 |
| D | 3510 | 3510 | 7 | 7 | 0.20% | 0.20% | 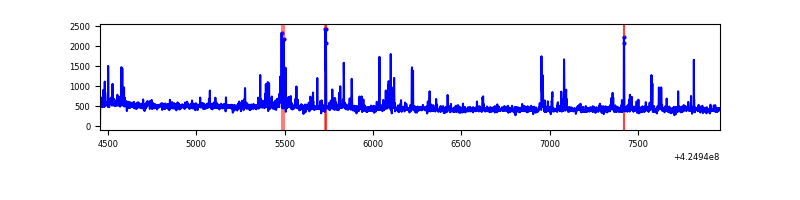 |
Top three noisy pixels from each quadrant. If the there are fewer than three noisy pixels in the level2.evt file, extra rows are filled as -1
| Pixel properties | Quadrant properties | ||||||
|---|---|---|---|---|---|---|---|
| Quadrant | DetID | PixID | Counts | Sigma | Mean | Median | Sigma |
| A | 10 | 83 | 360215 | 4219.93 | 417 | 409 | 85.3 |
| A | 2 | 79 | 90832 | 1060.51 | 417 | 409 | 85.3 |
| A | 15 | 223 | 38818 | 450.47 | 417 | 409 | 85.3 |
| B | 4 | 141 | 591220 | 7756.51 | 390 | 381 | 76.2 |
| B | 0 | 190 | 223239 | 2925.67 | 390 | 381 | 76.2 |
| B | 5 | 255 | 200833 | 2631.53 | 390 | 381 | 76.2 |
| C | 0 | 10 | 409931 | 4489.95 | 386 | 389 | 91.2 |
| C | 15 | 214 | 140645 | 1537.67 | 386 | 389 | 91.2 |
| C | 14 | 254 | 33186 | 359.56 | 386 | 389 | 91.2 |
| D | 2 | 249 | 55304 | 544.63 | 405 | 394 | 100.8 |
| D | 13 | 249 | 30290 | 296.52 | 405 | 394 | 100.8 |
| D | 10 | 199 | 21531 | 209.65 | 405 | 394 | 100.8 |
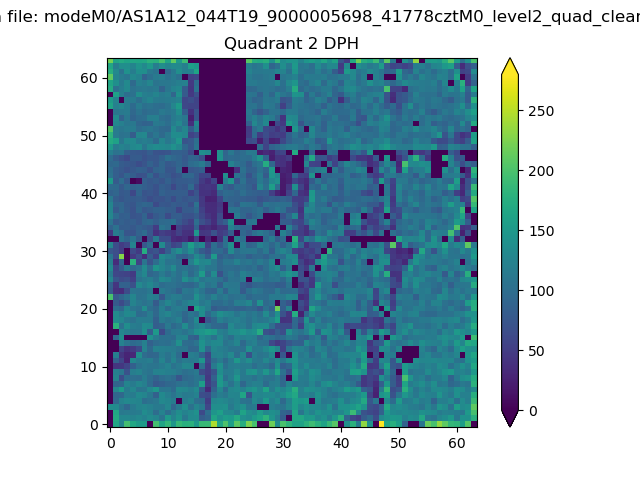
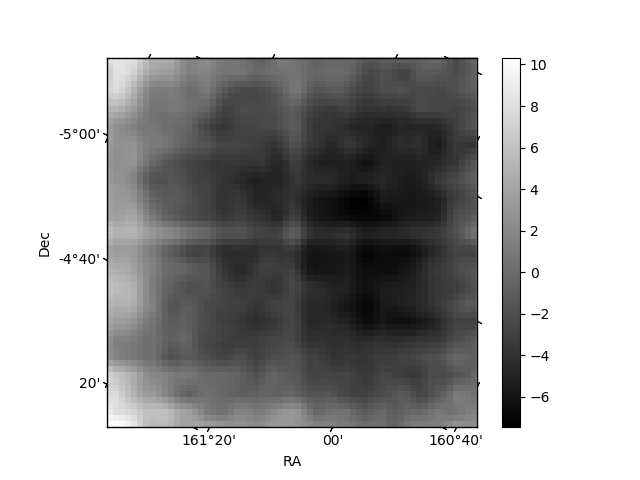
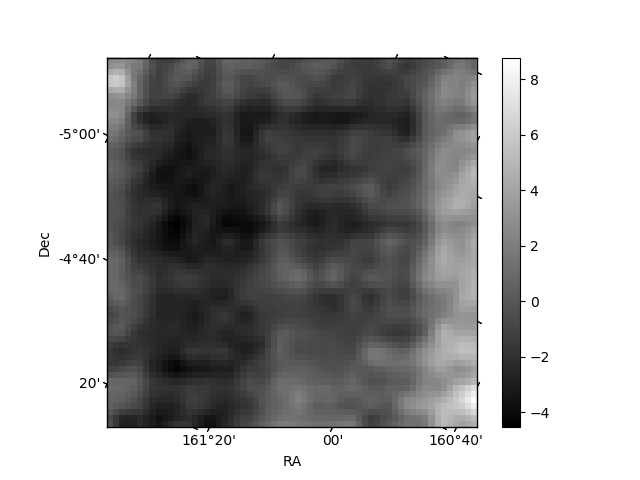
Histogram calculated using DETX and DETY for each event in the final _common_clean file
| Quadrant A | 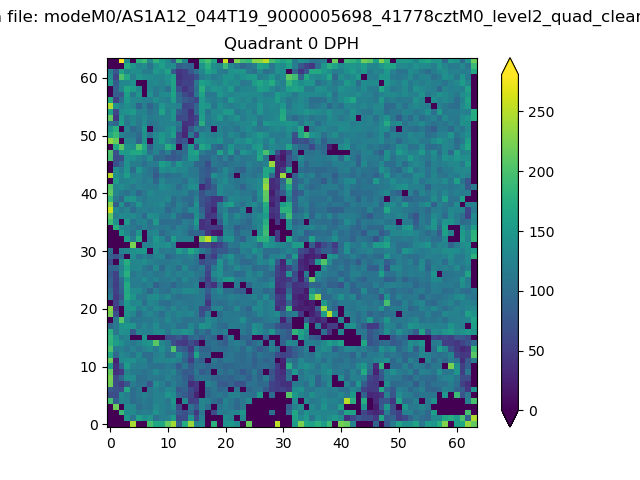 |
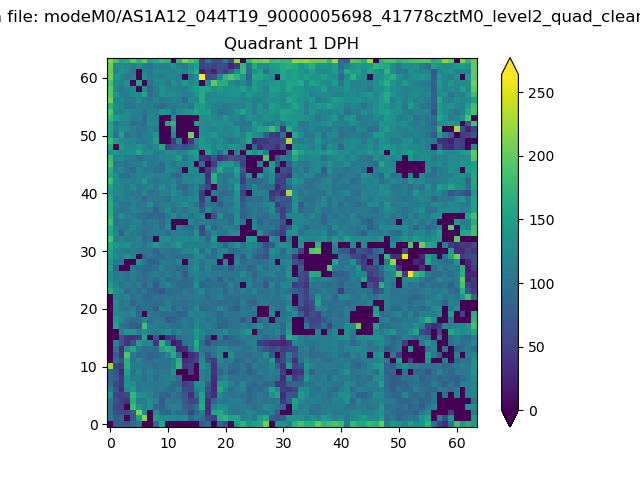 |
Quadrant B |
|---|---|---|---|
| Quadrant D | 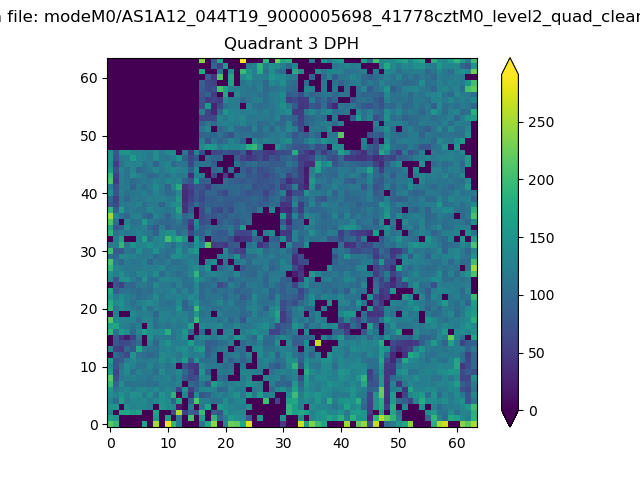 |
 |
Quadrant C |
| Plot type | Count rate plots | Images |
|---|---|---|
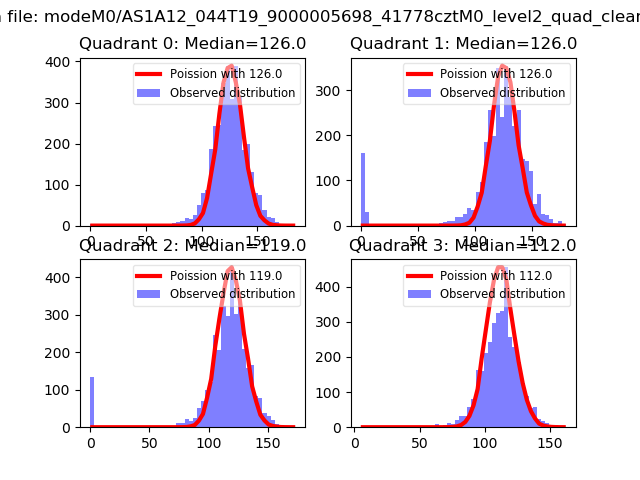
| Comparison with Poisson distribution Blue bars denote a histogram of data divided into 1 sec bins. Red curve is a Poisson curve with rate = median count rate of data. |
 |
 |
| Quadrant-wise count rates Data is divided into 100 sec bins |
 |
|
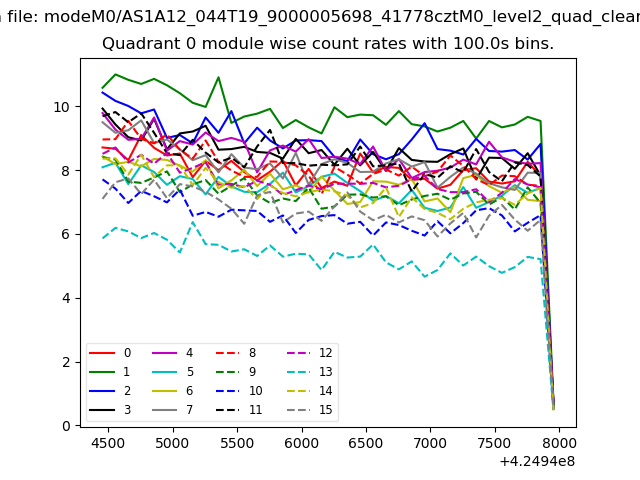
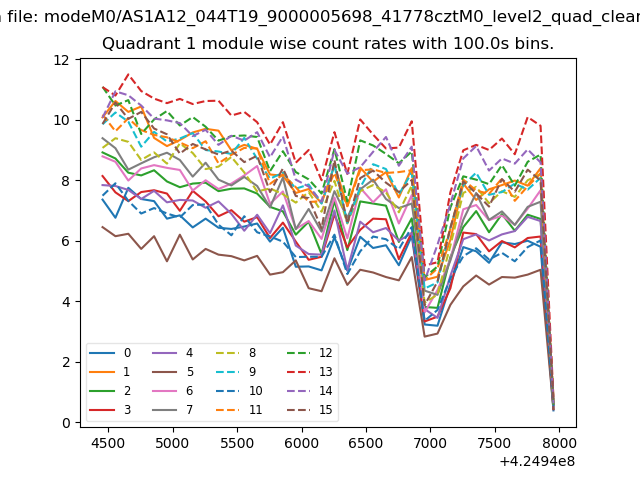
| Module-wise count rates for Quadrant A Data is divided into 100 sec bins |
 |
 |
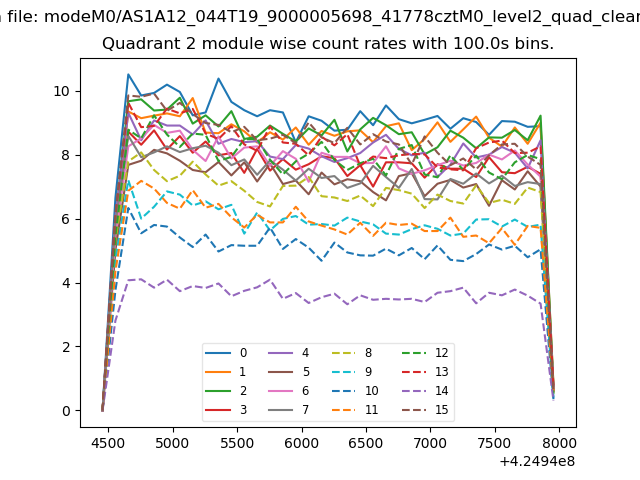
| Module-wise count rates for Quadrant B Data is divided into 100 sec bins |
 |
 |
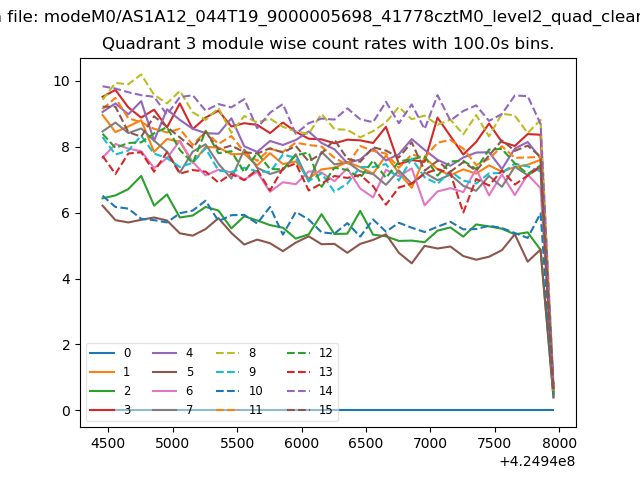
| Module-wise count rates for Quadrant C Data is divided into 100 sec bins |
 |
 |
| Module-wise count rates for Quadrant D Data is divided into 100 sec bins |
 |
 |
| Parameter | Plot |
|---|---|
| CZT HV Monitor | 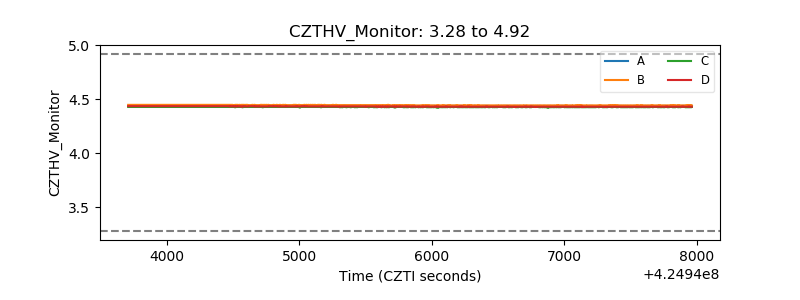 |
| D_VDD |  |
| Temperature 1 | 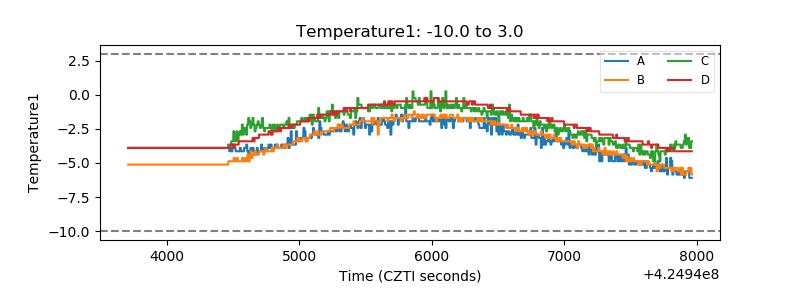 |
| Veto HV Monitor | 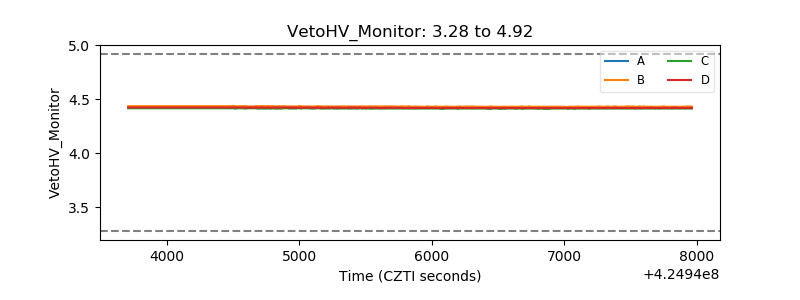 |
| Veto LLD | 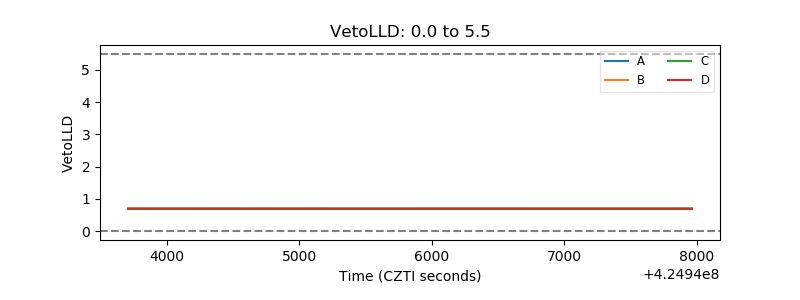 |
| Alpha Counter | 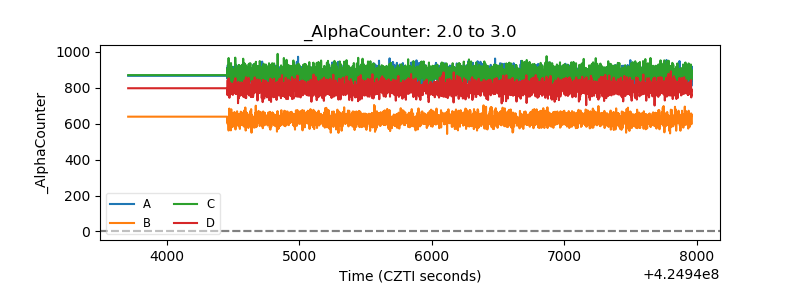 |
| _CPM_Rate | 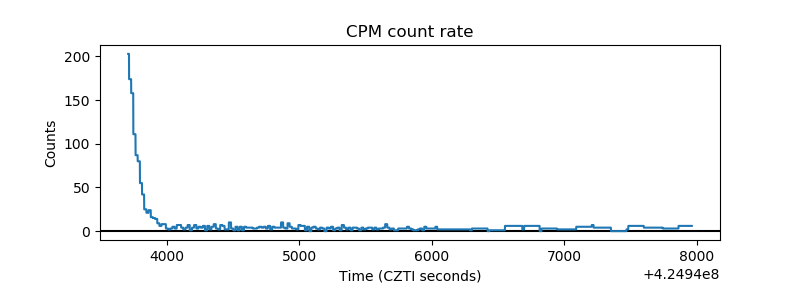 |
| CZT Counter | 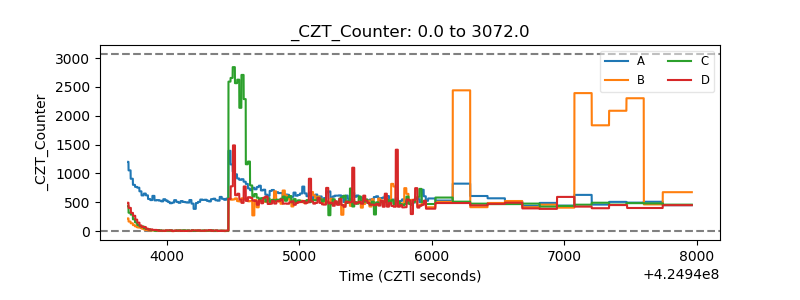 |
| +2.5 Volts monitor | 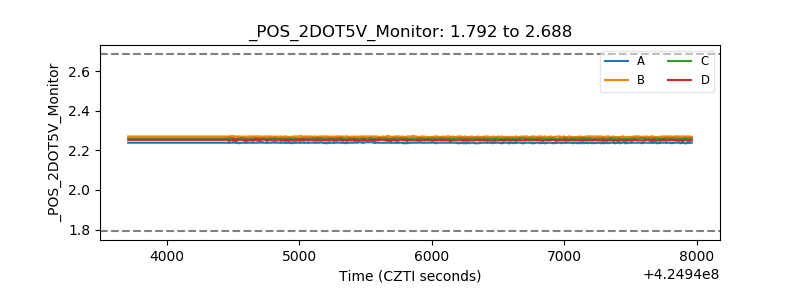 |
| +5 Volts monitor | 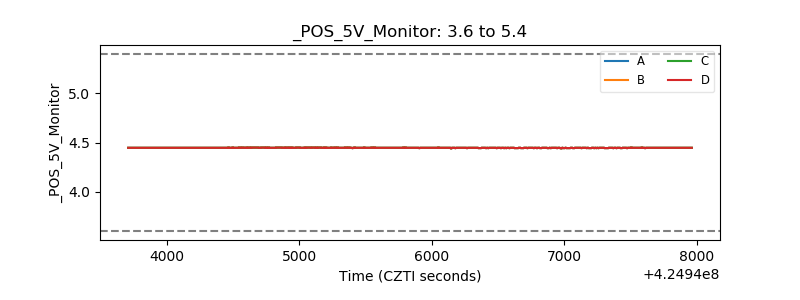 |
| _ROLL_ROT | 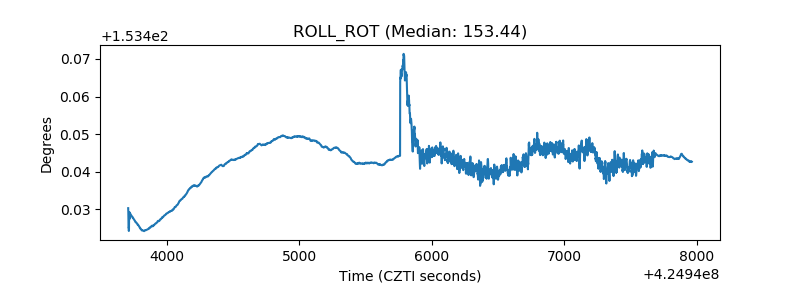 |
| _Roll_DEC | 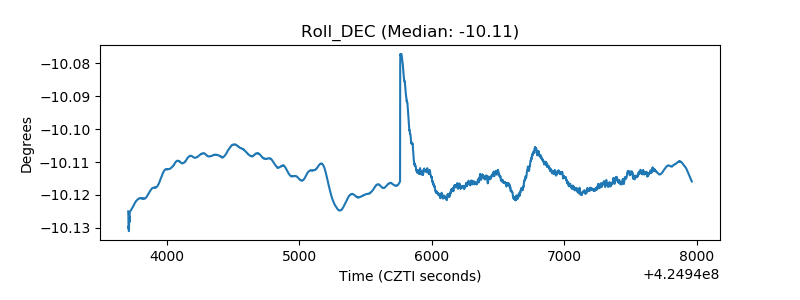 |
| _Roll_RA | 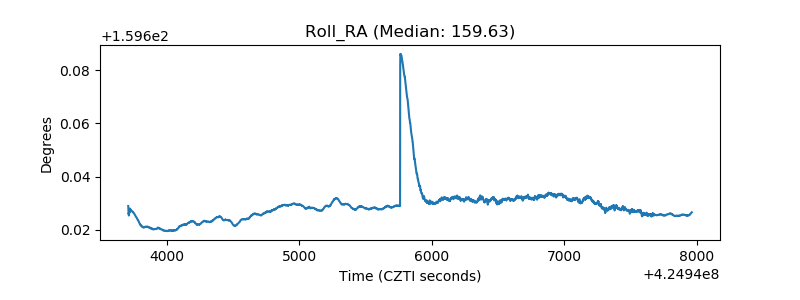 |
| Veto Counter | 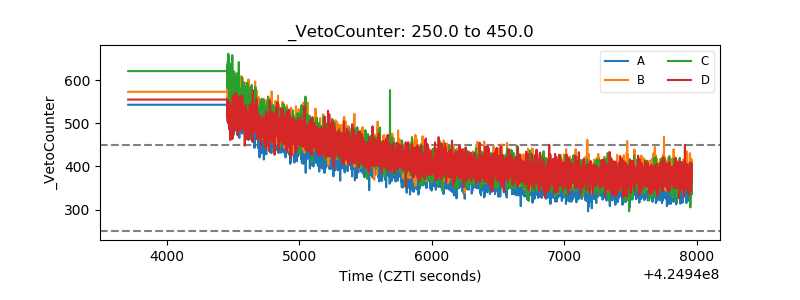 |