| Param | Original file | Final file |
|---|---|---|
| Filename | modeM0/AS1A12_052T04_9000005700_41778cztM0_level2.fits | modeM0/AS1A12_052T04_9000005700_41778cztM0_level2_quad_clean.evt |
| Size (bytes) | 89,536,320 | 21,542,400 |
| Size | 85.4 MB | 20.5 MB |
| Events in quadrant A | 738,650 | 151,937 |
| Events in quadrant B | 875,090 | 144,597 |
| Events in quadrant C | 939,691 | 131,506 |
| Events in quadrant D | 668,105 | 137,448 |
| Mode M9 | |||
|---|---|---|---|
| Quadrant | BADHDUFLAG | Total packets | Discarded packets |
| A | 0 | 16 | 0 |
| B | 0 | 16 | 0 |
| C | 0 | 16 | 0 |
| D | 0 | 16 | 0 |
| Mode SS | |||
|---|---|---|---|
| Quadrant | BADHDUFLAG | Total packets | Discarded packets |
| A | 0 | 22 | 0 |
| B | 0 | 22 | 0 |
| C | 0 | 22 | 0 |
| D | 0 | 22 | 0 |
| Mode M0 | |||
|---|---|---|---|
| Quadrant | BADHDUFLAG | Total packets | Discarded packets |
| A | 0 | 2957 | 2 |
| B | 0 | 3299 | 1 |
| C | 0 | 3451 | 1 |
| D | 0 | 2673 | 1 |
| Quadrant | Total seconds | Saturated seconds | Saturation percentage |
|---|---|---|---|
| A | 1156 | 7 | 0.605536% |
| B | 1156 | 108 | 9.342561% |
| C | 1156 | 139 | 12.024221% |
| D | 1156 | 6 | 0.519031% |
Noise dominated data is calculated using 1-second bins in cleaned event files. If a bin has >2000 counts, and if more than 50% of those come from <1% of pixels, then it is considered to be noise-dominated and hence unusable.
| Quadrant | # 1 sec bins | Bins with >0 counts | Bins with >2000 counts | High rate bins dominated by noise | Noise dominated (total time) | Noise dominated (detector-on time) | Marked lightcurve |
|---|---|---|---|---|---|---|---|
| A | 1156 | 1156 | 2 | 2 | 0.17% | 0.17% | 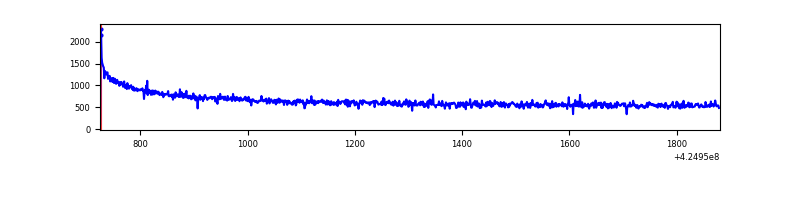 |
| B | 1156 | 1156 | 89 | 89 | 7.70% | 7.70% | 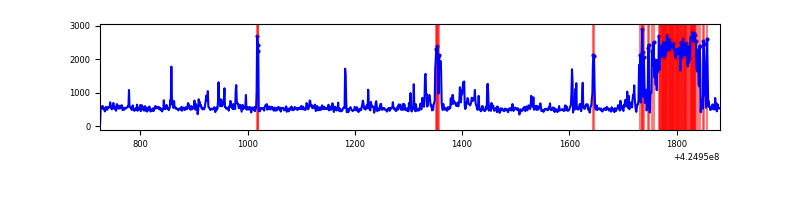 |
| C | 1156 | 1156 | 133 | 133 | 11.51% | 11.51% | 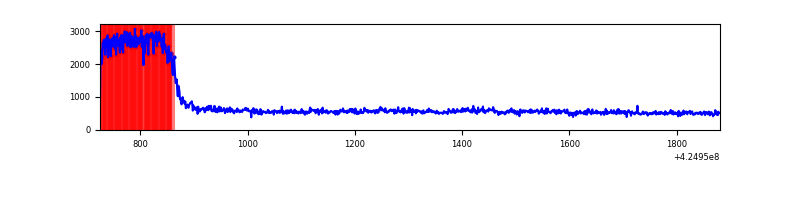 |
| D | 1156 | 1156 | 4 | 4 | 0.35% | 0.35% | 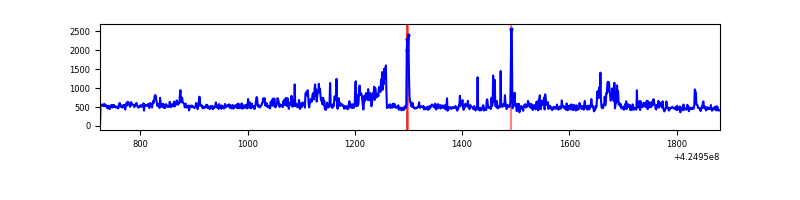 |
Top three noisy pixels from each quadrant. If the there are fewer than three noisy pixels in the level2.evt file, extra rows are filled as -1
| Pixel properties | Quadrant properties | ||||||
|---|---|---|---|---|---|---|---|
| Quadrant | DetID | PixID | Counts | Sigma | Mean | Median | Sigma |
| A | 10 | 83 | 174485 | 5595.33 | 145 | 141 | 31.2 |
| A | 13 | 254 | 1842 | 54.59 | 145 | 141 | 31.2 |
| A | 2 | 79 | 1408 | 40.66 | 145 | 141 | 31.2 |
| B | 4 | 141 | 232982 | 8268.39 | 136 | 133 | 28.2 |
| B | 5 | 255 | 49361 | 1748.07 | 136 | 133 | 28.2 |
| B | 0 | 190 | 24707 | 872.61 | 136 | 133 | 28.2 |
| C | 0 | 10 | 396848 | 12902.25 | 126 | 127 | 30.7 |
| C | 15 | 214 | 46554 | 1509.91 | 126 | 127 | 30.7 |
| C | 13 | 61 | 890 | 24.81 | 126 | 127 | 30.7 |
| D | 1 | 52 | 43672 | 1210.35 | 143 | 138 | 36.0 |
| D | 13 | 249 | 39536 | 1095.36 | 143 | 138 | 36.0 |
| D | 2 | 249 | 21724 | 600.14 | 143 | 138 | 36.0 |
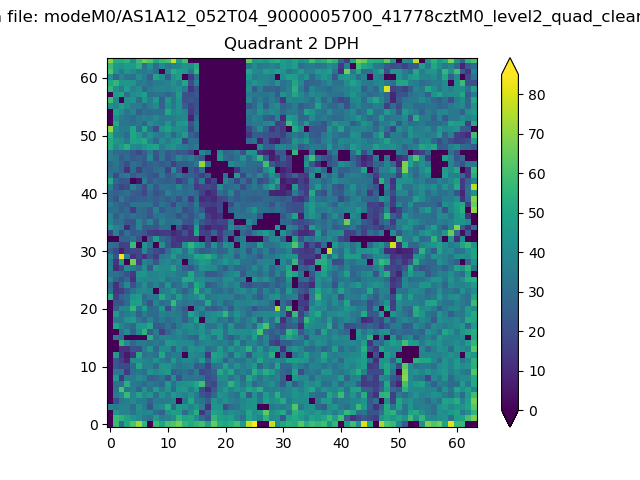
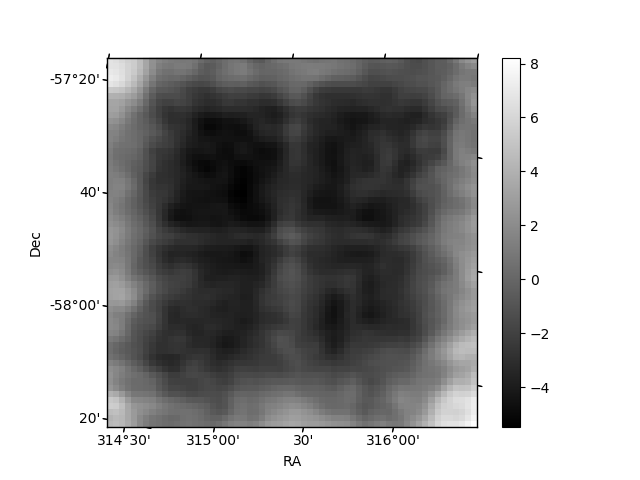
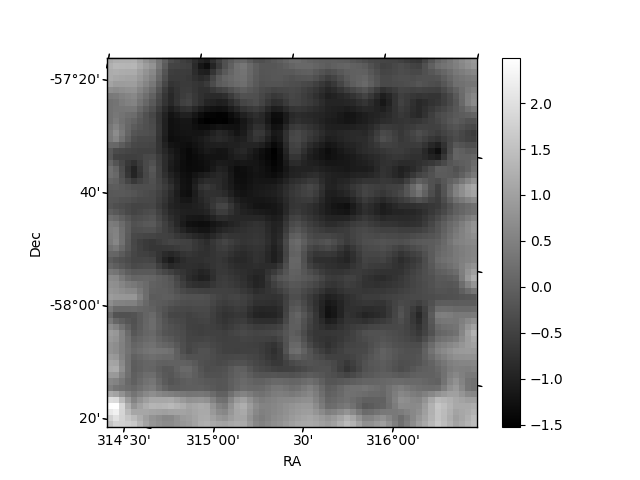
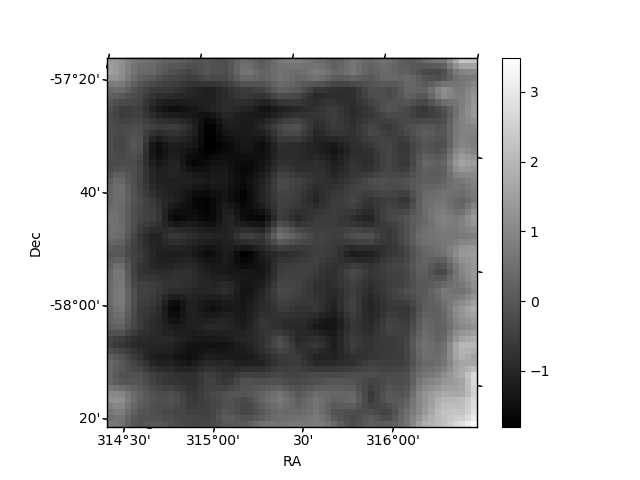
Histogram calculated using DETX and DETY for each event in the final _common_clean file
| Quadrant A | 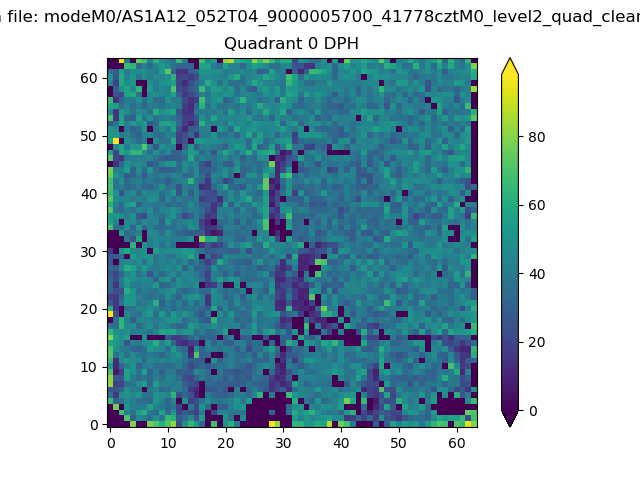 |
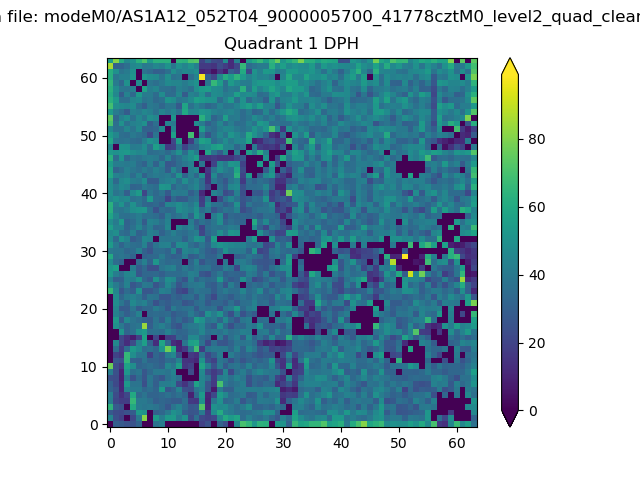 |
Quadrant B |
|---|---|---|---|
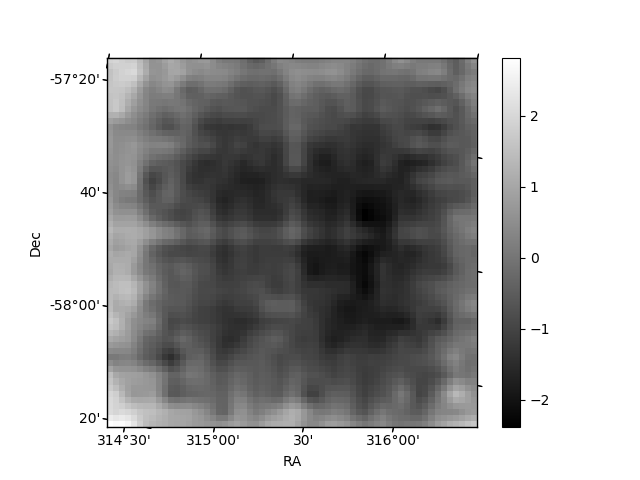
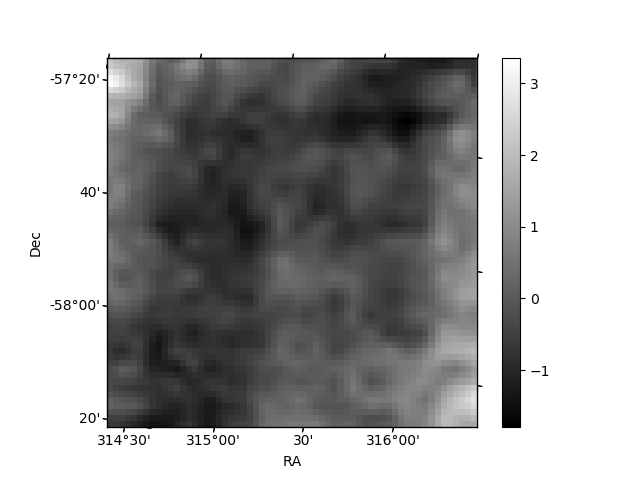
| Quadrant D | 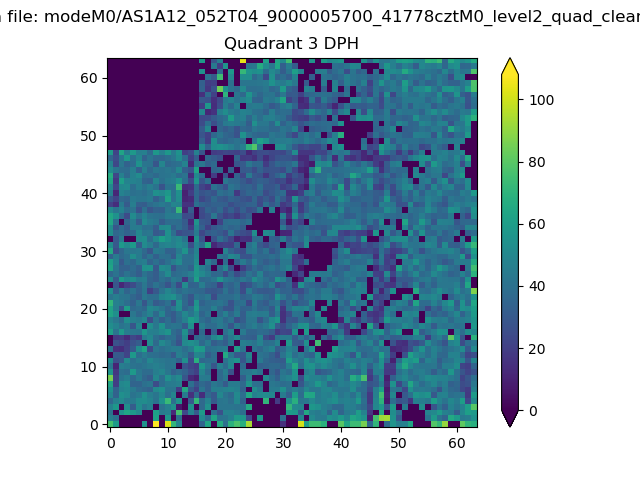 |
 |
Quadrant C |
| Plot type | Count rate plots | Images |
|---|---|---|
| Comparison with Poisson distribution Blue bars denote a histogram of data divided into 1 sec bins. Red curve is a Poisson curve with rate = median count rate of data. |
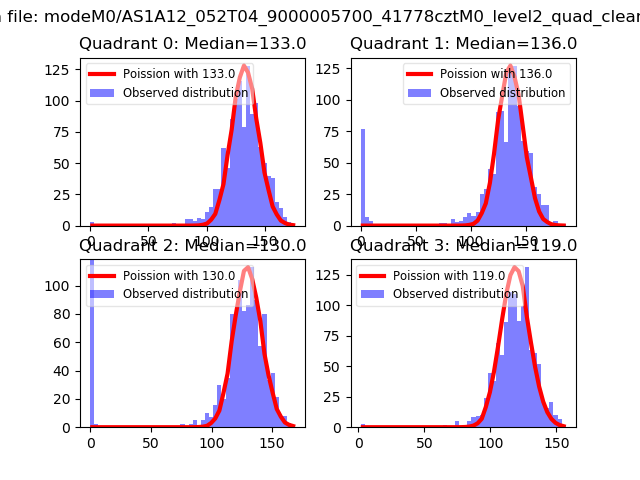 |
 |
| Quadrant-wise count rates Data is divided into 100 sec bins |
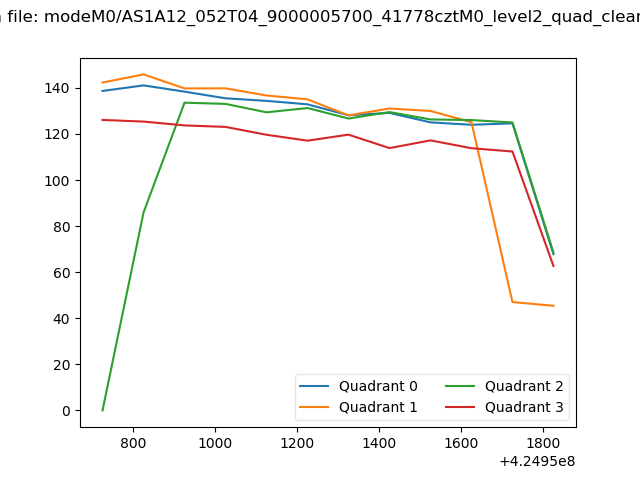 |
|
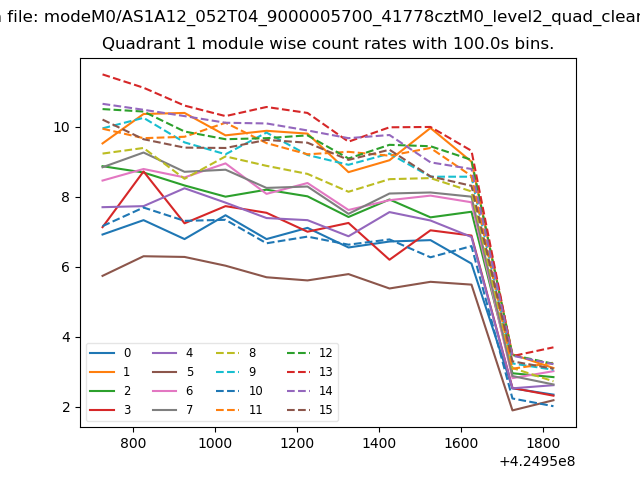
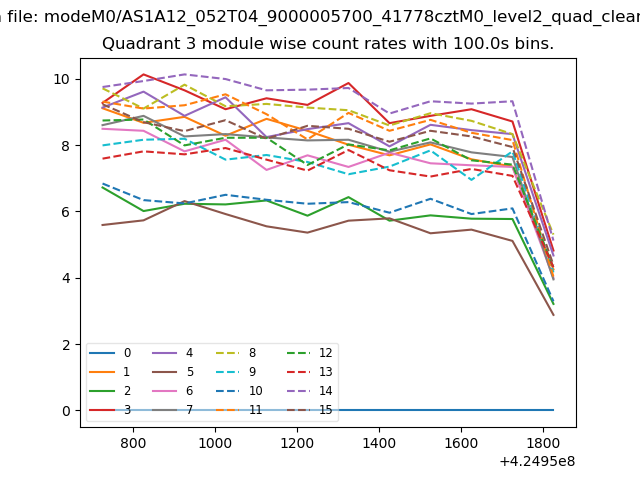
| Module-wise count rates for Quadrant A Data is divided into 100 sec bins |
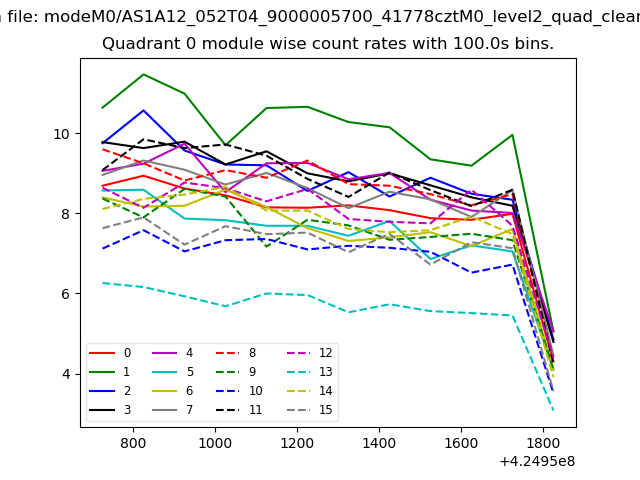 |
 |
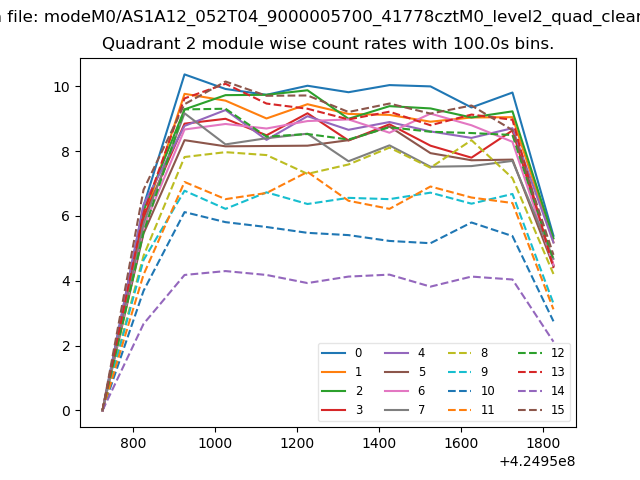
| Module-wise count rates for Quadrant B Data is divided into 100 sec bins |
 |
 |
| Module-wise count rates for Quadrant C Data is divided into 100 sec bins |
 |
 |
| Module-wise count rates for Quadrant D Data is divided into 100 sec bins |
 |
 |
| Parameter | Plot |
|---|---|
| CZT HV Monitor | 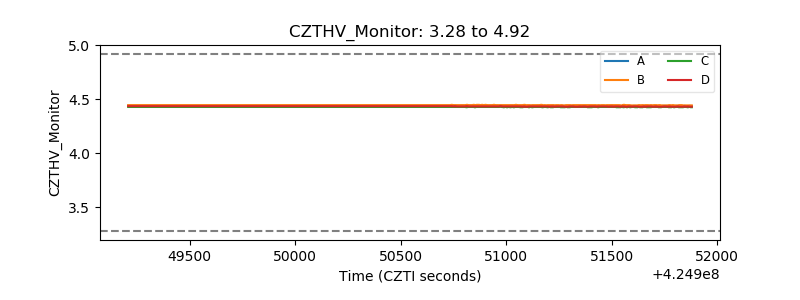 |
| D_VDD | 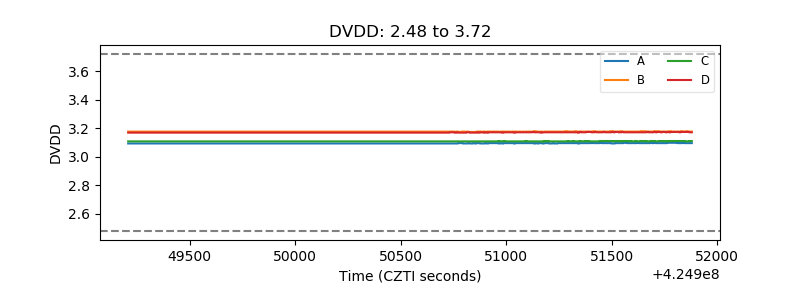 |
| Temperature 1 | 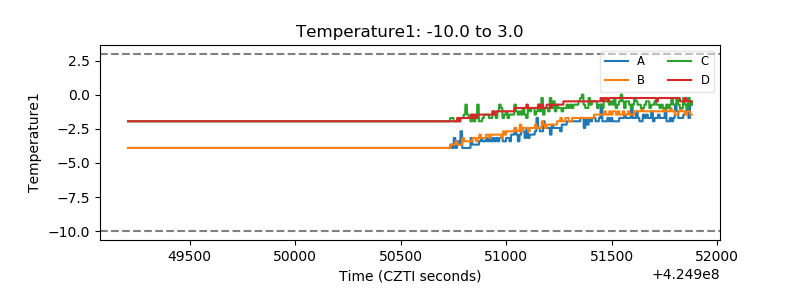 |
| Veto HV Monitor | 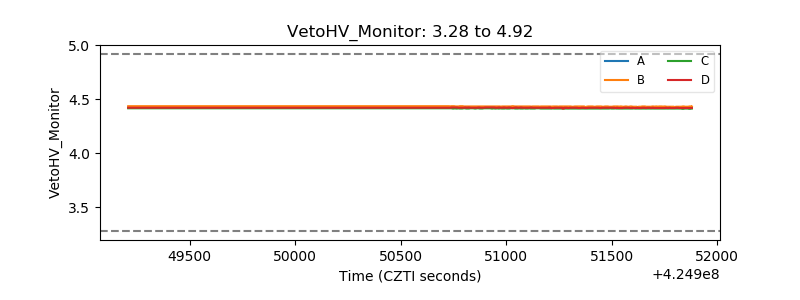 |
| Veto LLD | 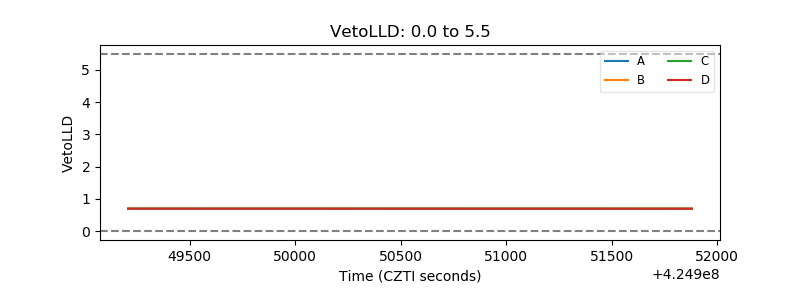 |
| Alpha Counter | 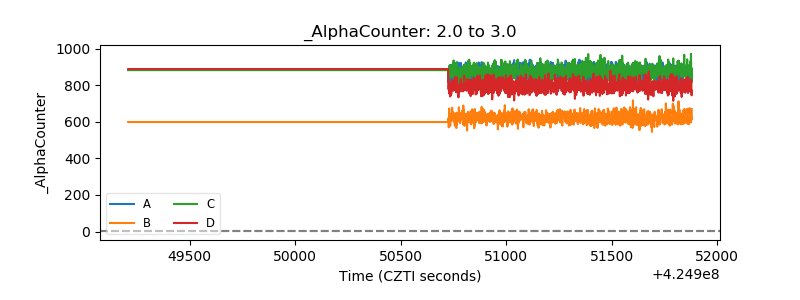 |
| _CPM_Rate | 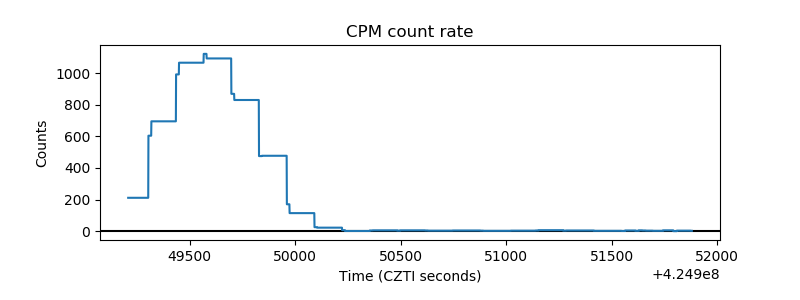 |
| CZT Counter | 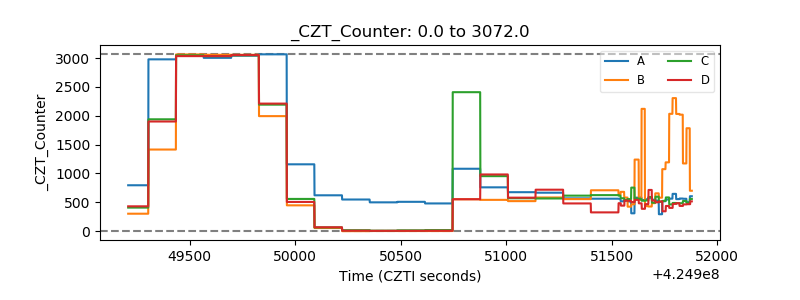 |
| +2.5 Volts monitor | 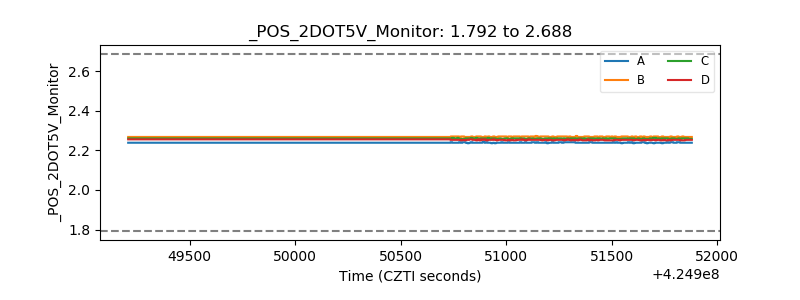 |
| +5 Volts monitor | 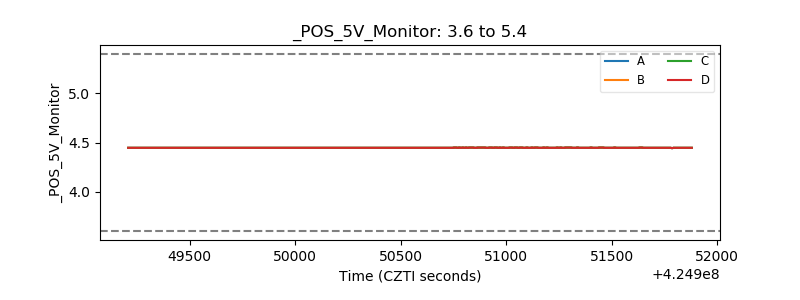 |
| _ROLL_ROT | 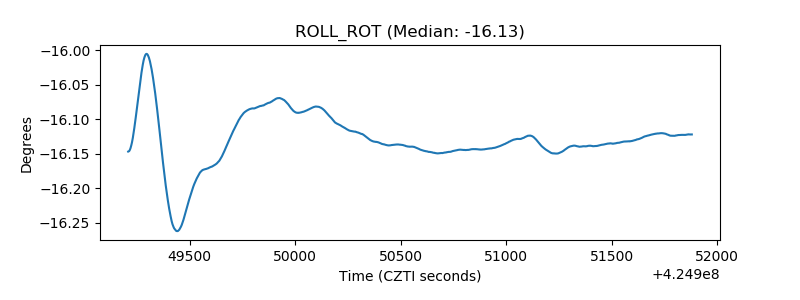 |
| _Roll_DEC | 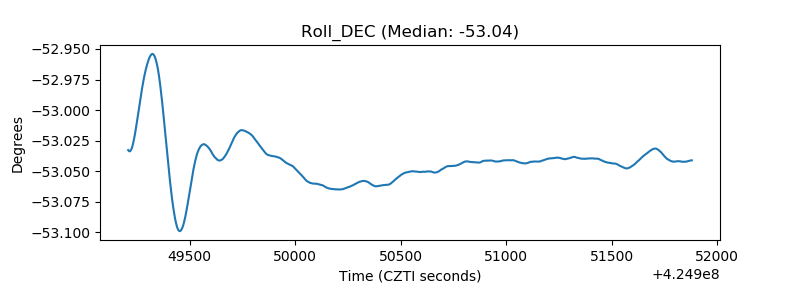 |
| _Roll_RA | 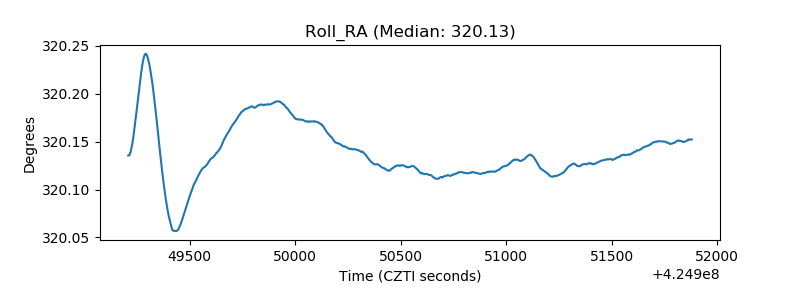 |
| Veto Counter | 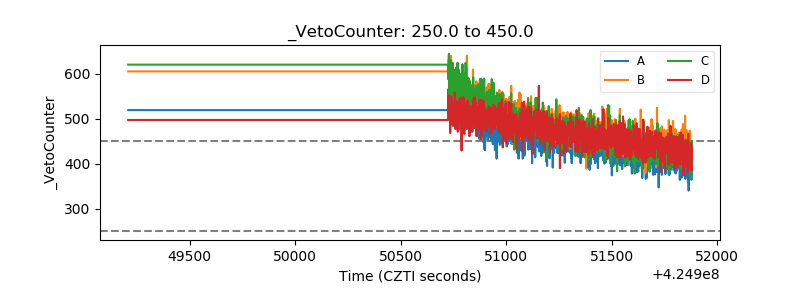 |