| Param | Original file | Final file |
|---|---|---|
| Filename | modeM0/AS1A12_052T04_9000005700_41779cztM0_level2.fits | modeM0/AS1A12_052T04_9000005700_41779cztM0_level2_quad_clean.evt |
| Size (bytes) | 340,776,000 | 93,911,040 |
| Size | 325.0 MB | 89.6 MB |
| Events in quadrant A | 3,004,403 | 650,310 |
| Events in quadrant B | 3,276,637 | 641,656 |
| Events in quadrant C | 3,291,611 | 598,002 |
| Events in quadrant D | 2,634,827 | 588,002 |
| Mode M9 | |||
|---|---|---|---|
| Quadrant | BADHDUFLAG | Total packets | Discarded packets |
| A | 0 | 22 | 0 |
| B | 0 | 22 | 0 |
| C | 0 | 22 | 0 |
| D | 0 | 23 | 0 |
| Mode SS | |||
|---|---|---|---|
| Quadrant | BADHDUFLAG | Total packets | Discarded packets |
| A | 0 | 106 | 0 |
| B | 0 | 106 | 0 |
| C | 0 | 106 | 0 |
| D | 0 | 106 | 0 |
| Mode M0 | |||
|---|---|---|---|
| Quadrant | BADHDUFLAG | Total packets | Discarded packets |
| A | 0 | 11919 | 3 |
| B | 0 | 13046 | 2 |
| C | 0 | 12735 | 2 |
| D | 0 | 11324 | 2 |
| Quadrant | Total seconds | Saturated seconds | Saturation percentage |
|---|---|---|---|
| A | 5224 | 19 | 0.363706% |
| B | 5224 | 161 | 3.081930% |
| C | 5224 | 273 | 5.225881% |
| D | 5224 | 14 | 0.267994% |
Noise dominated data is calculated using 1-second bins in cleaned event files. If a bin has >2000 counts, and if more than 50% of those come from <1% of pixels, then it is considered to be noise-dominated and hence unusable.
| Quadrant | # 1 sec bins | Bins with >0 counts | Bins with >2000 counts | High rate bins dominated by noise | Noise dominated (total time) | Noise dominated (detector-on time) | Marked lightcurve |
|---|---|---|---|---|---|---|---|
| A | 7318 | 5225 | 5 | 5 | 0.07% | 0.10% | 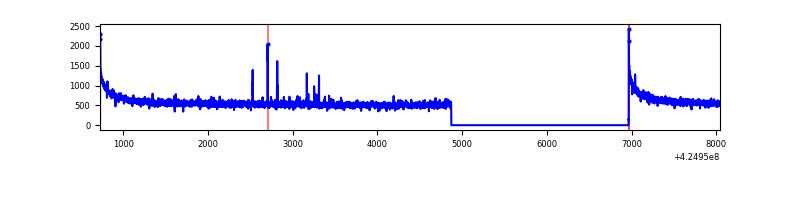 |
| B | 7318 | 5225 | 119 | 119 | 1.63% | 2.28% | 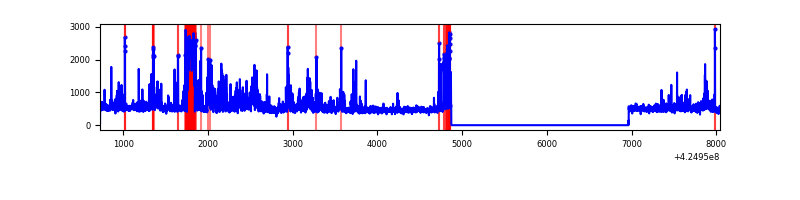 |
| C | 7318 | 5225 | 261 | 261 | 3.57% | 5.00% | 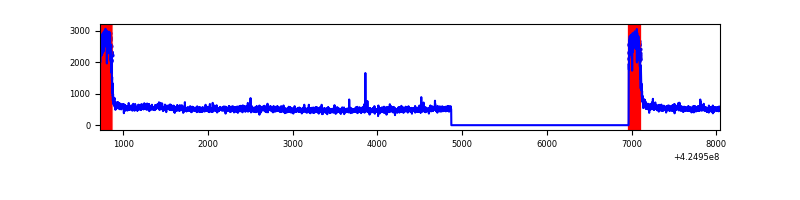 |
| D | 7318 | 5225 | 10 | 10 | 0.14% | 0.19% | 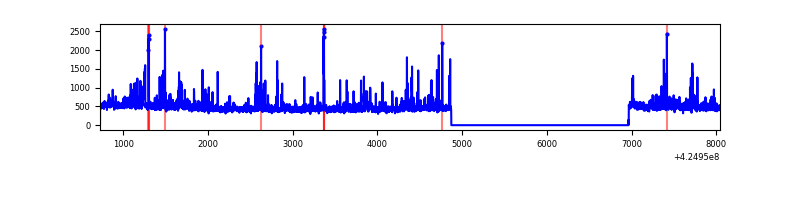 |
Top three noisy pixels from each quadrant. If the there are fewer than three noisy pixels in the level2.evt file, extra rows are filled as -1
| Pixel properties | Quadrant properties | ||||||
|---|---|---|---|---|---|---|---|
| Quadrant | DetID | PixID | Counts | Sigma | Mean | Median | Sigma |
| A | 10 | 83 | 569593 | 4487.25 | 618 | 606 | 126.8 |
| A | 15 | 223 | 32122 | 248.55 | 618 | 606 | 126.8 |
| A | 13 | 254 | 9237 | 68.07 | 618 | 606 | 126.8 |
| B | 0 | 190 | 334788 | 2923.71 | 601 | 585 | 114.3 |
| B | 4 | 141 | 276231 | 2411.44 | 601 | 585 | 114.3 |
| B | 5 | 255 | 176881 | 1542.29 | 601 | 585 | 114.3 |
| C | 0 | 10 | 846988 | 6445.49 | 570 | 573 | 131.3 |
| C | 15 | 214 | 209426 | 1590.42 | 570 | 573 | 131.3 |
| C | 12 | 249 | 7520 | 52.9 | 570 | 573 | 131.3 |
| D | 2 | 249 | 84804 | 575.12 | 601 | 584 | 146.4 |
| D | 13 | 249 | 66389 | 449.36 | 601 | 584 | 146.4 |
| D | 1 | 52 | 52628 | 355.39 | 601 | 584 | 146.4 |
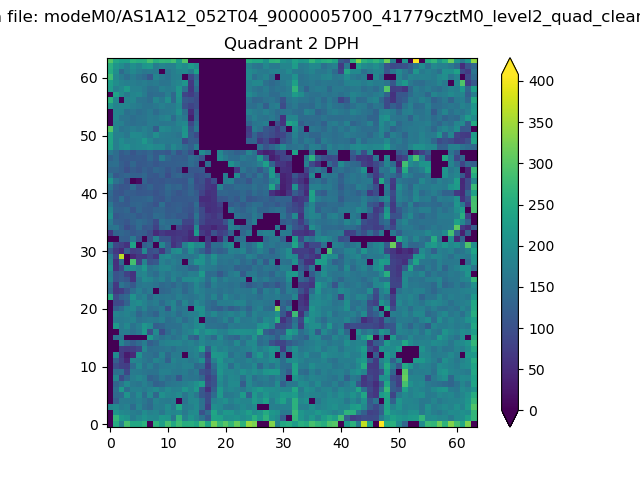
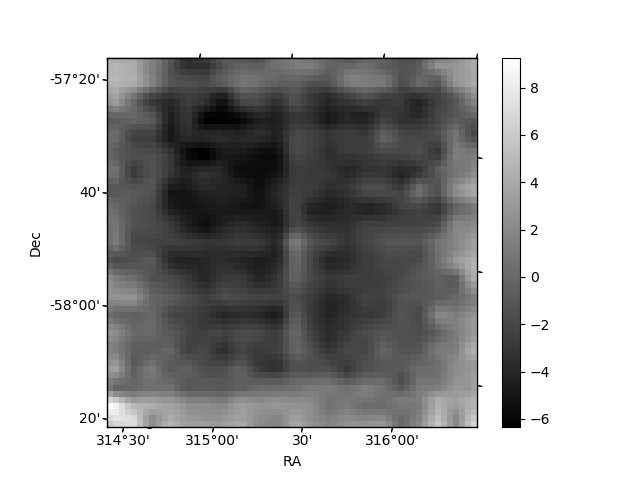
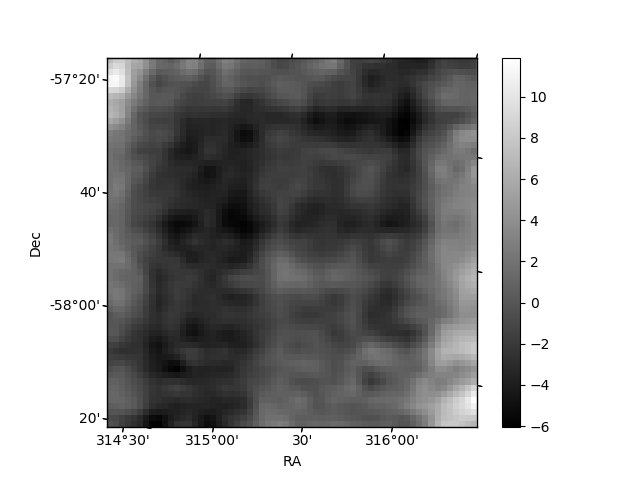
Histogram calculated using DETX and DETY for each event in the final _common_clean file
| Quadrant A | 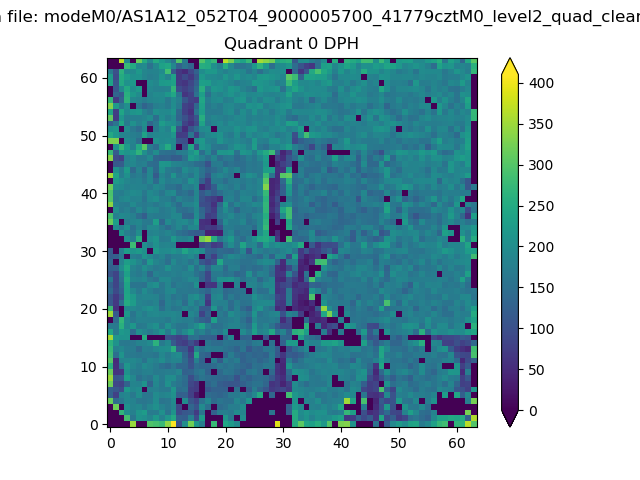 |
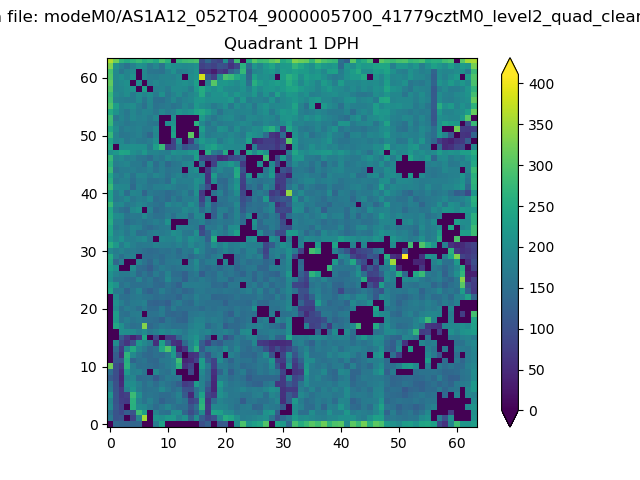 |
Quadrant B |
|---|---|---|---|
| Quadrant D | 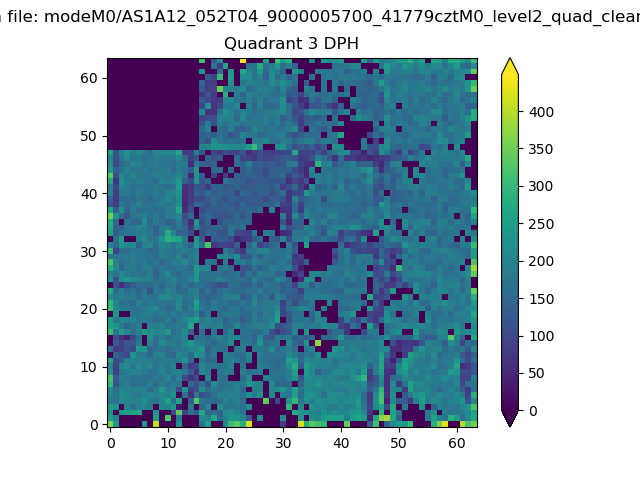 |
 |
Quadrant C |
| Plot type | Count rate plots | Images |
|---|---|---|
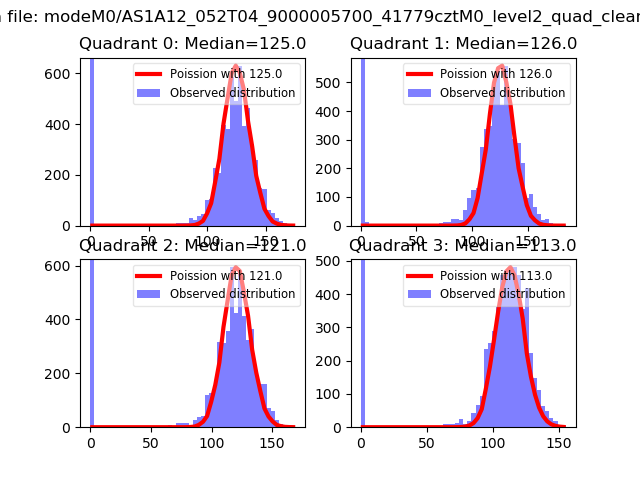
| Comparison with Poisson distribution Blue bars denote a histogram of data divided into 1 sec bins. Red curve is a Poisson curve with rate = median count rate of data. |
 |
 |
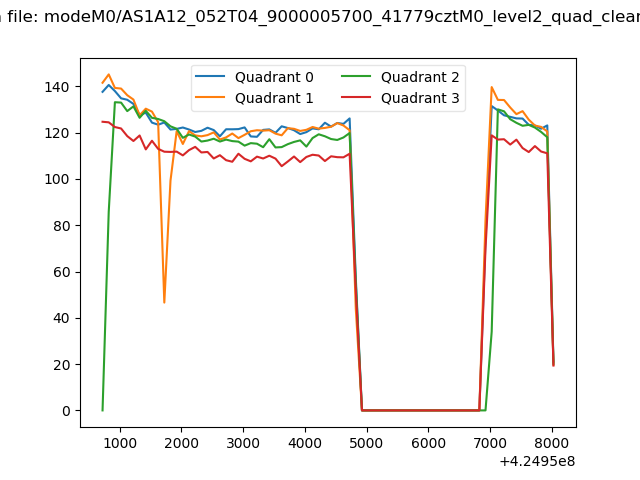
| Quadrant-wise count rates Data is divided into 100 sec bins |
 |
|
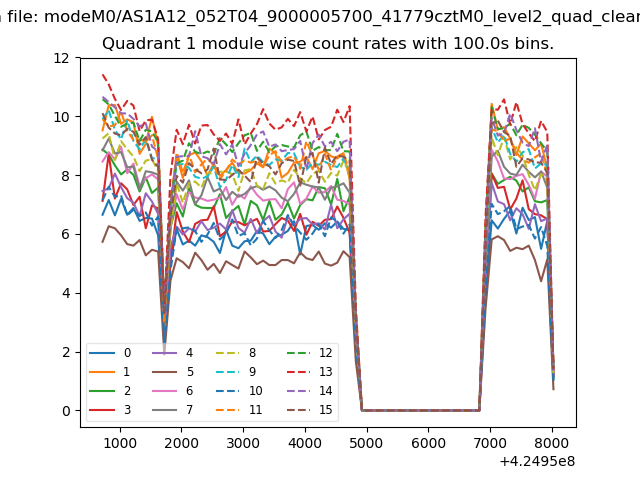
| Module-wise count rates for Quadrant A Data is divided into 100 sec bins |
 |
 |
| Module-wise count rates for Quadrant B Data is divided into 100 sec bins |
 |
 |
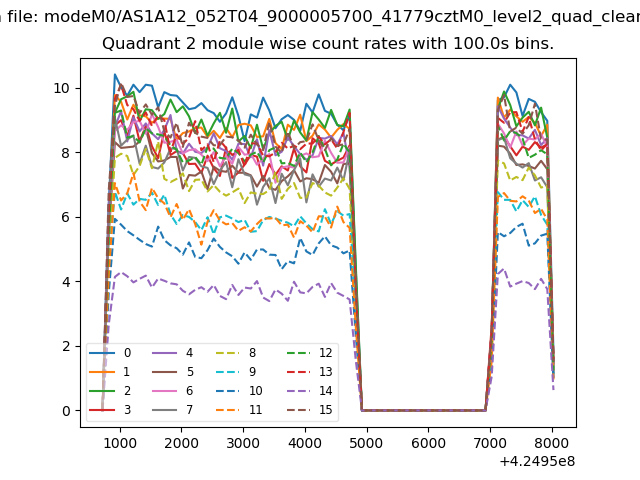
| Module-wise count rates for Quadrant C Data is divided into 100 sec bins |
 |
 |
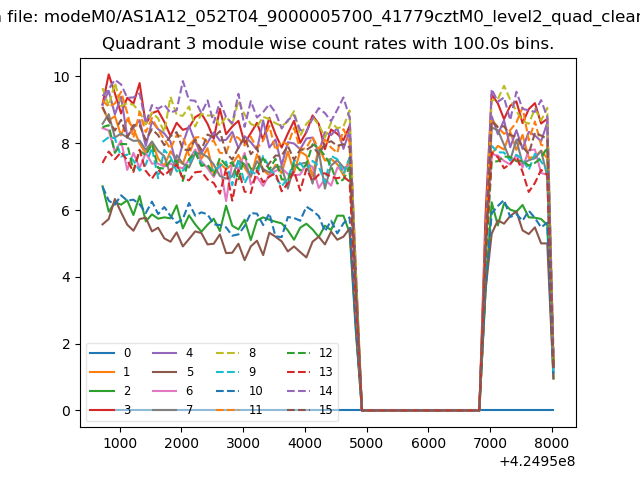
| Module-wise count rates for Quadrant D Data is divided into 100 sec bins |
 |
 |
| Parameter | Plot |
|---|---|
| CZT HV Monitor | 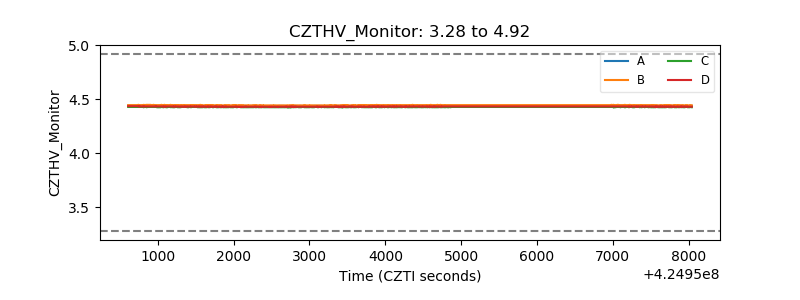 |
| D_VDD | 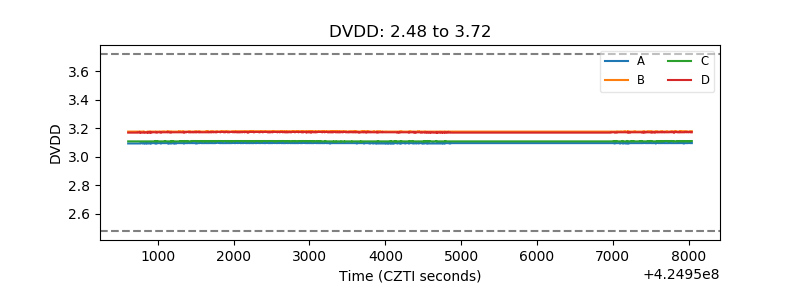 |
| Temperature 1 | 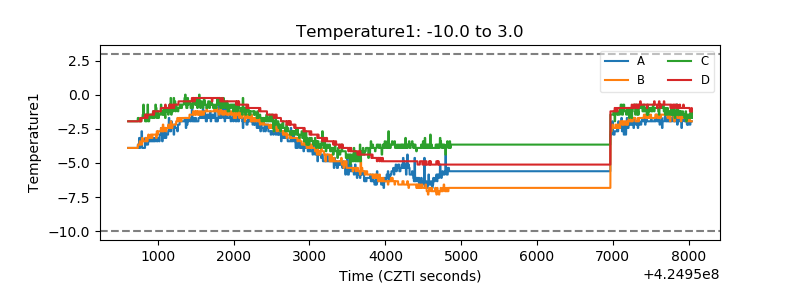 |
| Veto HV Monitor | 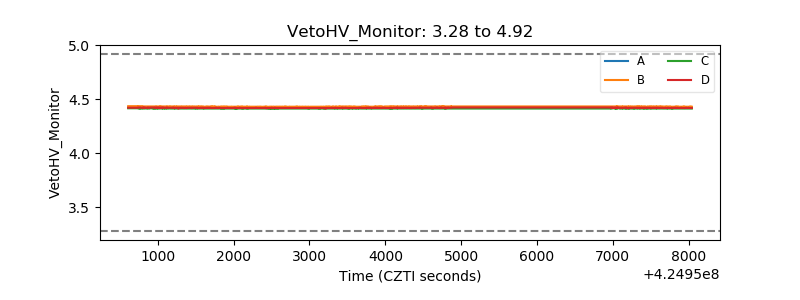 |
| Veto LLD | 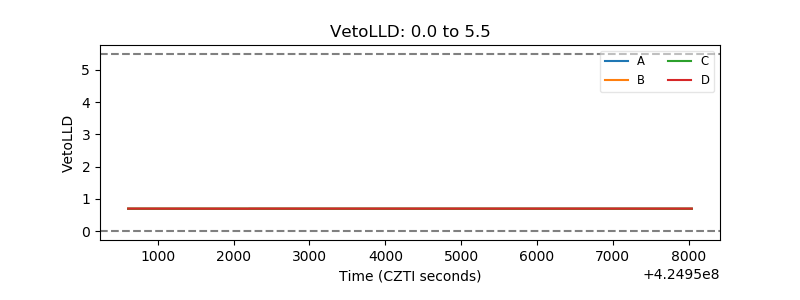 |
| Alpha Counter | 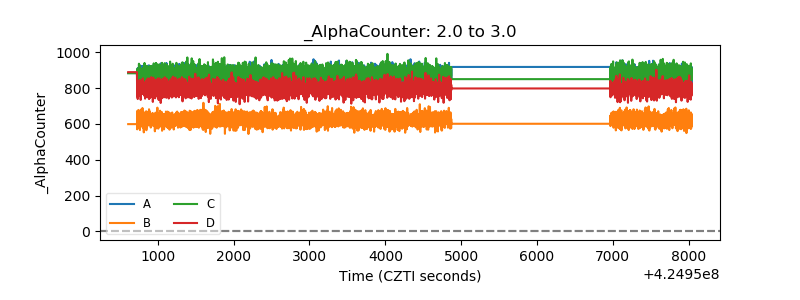 |
| _CPM_Rate | 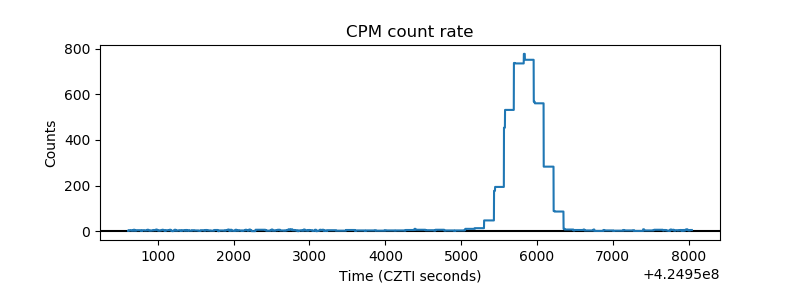 |
| CZT Counter |  |
| +2.5 Volts monitor |  |
| +5 Volts monitor |  |
| _ROLL_ROT | 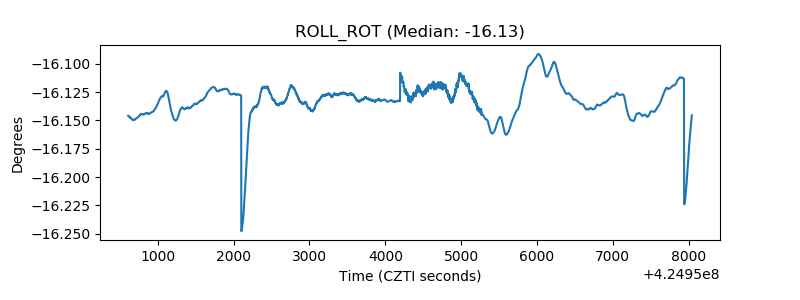 |
| _Roll_DEC | 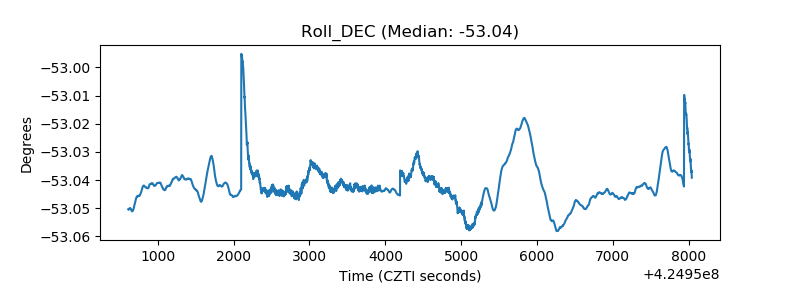 |
| _Roll_RA |  |
| Veto Counter | 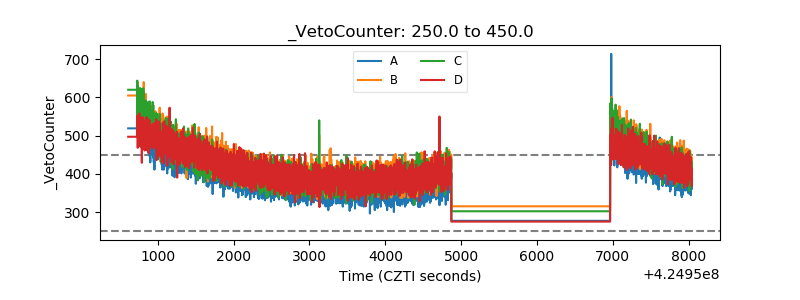 |