| Param | Original file | Final file |
|---|---|---|
| Filename | modeM0/AS1A12_052T04_9000005700_41780cztM0_level2.fits | modeM0/AS1A12_052T04_9000005700_41780cztM0_level2_quad_clean.evt |
| Size (bytes) | 316,005,120 | 90,780,480 |
| Size | 301.4 MB | 86.6 MB |
| Events in quadrant A | 2,884,793 | 620,235 |
| Events in quadrant B | 2,773,551 | 627,763 |
| Events in quadrant C | 3,119,950 | 574,572 |
| Events in quadrant D | 2,516,356 | 564,271 |
| Mode M9 | |||
|---|---|---|---|
| Quadrant | BADHDUFLAG | Total packets | Discarded packets |
| A | 0 | 29 | 0 |
| B | 0 | 29 | 0 |
| C | 0 | 29 | 0 |
| D | 0 | 30 | 0 |
| Mode SS | |||
|---|---|---|---|
| Quadrant | BADHDUFLAG | Total packets | Discarded packets |
| A | 0 | 106 | 0 |
| B | 0 | 106 | 0 |
| C | 0 | 106 | 0 |
| D | 0 | 106 | 0 |
| Mode M0 | |||
|---|---|---|---|
| Quadrant | BADHDUFLAG | Total packets | Discarded packets |
| A | 0 | 11585 | 3 |
| B | 0 | 11551 | 2 |
| C | 0 | 12354 | 2 |
| D | 0 | 11081 | 2 |
| Quadrant | Total seconds | Saturated seconds | Saturation percentage |
|---|---|---|---|
| A | 5167 | 14 | 0.270950% |
| B | 5167 | 38 | 0.735436% |
| C | 5167 | 261 | 5.051287% |
| D | 5167 | 26 | 0.503193% |
Noise dominated data is calculated using 1-second bins in cleaned event files. If a bin has >2000 counts, and if more than 50% of those come from <1% of pixels, then it is considered to be noise-dominated and hence unusable.
| Quadrant | # 1 sec bins | Bins with >0 counts | Bins with >2000 counts | High rate bins dominated by noise | Noise dominated (total time) | Noise dominated (detector-on time) | Marked lightcurve |
|---|---|---|---|---|---|---|---|
| A | 7290 | 5168 | 4 | 4 | 0.05% | 0.08% | 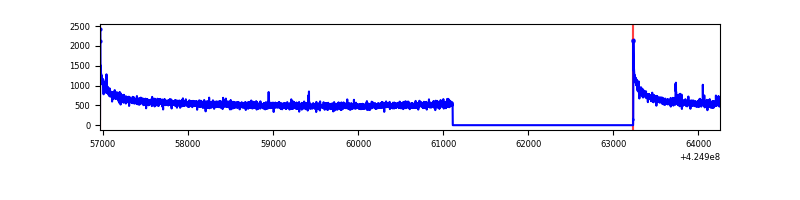 |
| B | 7290 | 5168 | 10 | 10 | 0.14% | 0.19% | 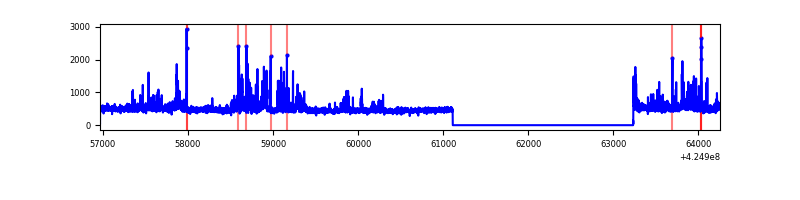 |
| C | 7290 | 5168 | 250 | 250 | 3.43% | 4.84% | 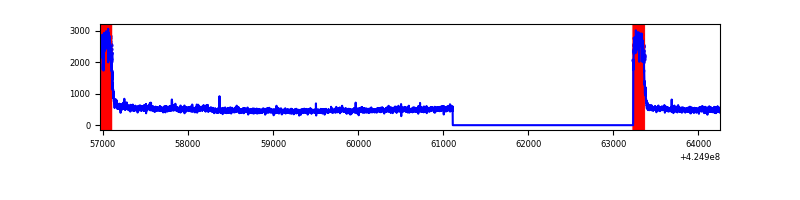 |
| D | 7290 | 5168 | 21 | 21 | 0.29% | 0.41% | 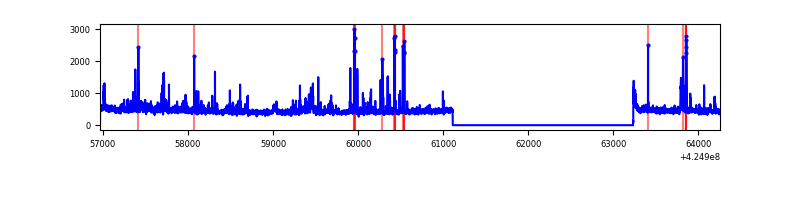 |
Top three noisy pixels from each quadrant. If the there are fewer than three noisy pixels in the level2.evt file, extra rows are filled as -1
| Pixel properties | Quadrant properties | ||||||
|---|---|---|---|---|---|---|---|
| Quadrant | DetID | PixID | Counts | Sigma | Mean | Median | Sigma |
| A | 10 | 83 | 565412 | 4624.24 | 594 | 582 | 122.1 |
| A | 15 | 223 | 12042 | 93.82 | 594 | 582 | 122.1 |
| A | 13 | 254 | 9029 | 69.16 | 594 | 582 | 122.1 |
| B | 0 | 190 | 229161 | 2029.9 | 585 | 569 | 112.6 |
| B | 4 | 141 | 98942 | 873.55 | 585 | 569 | 112.6 |
| B | 0 | 186 | 65813 | 579.37 | 585 | 569 | 112.6 |
| C | 0 | 10 | 766389 | 6069.0 | 548 | 550 | 126.2 |
| C | 15 | 214 | 202172 | 1597.78 | 548 | 550 | 126.2 |
| C | 12 | 249 | 6085 | 43.86 | 548 | 550 | 126.2 |
| D | 2 | 249 | 72760 | 511.92 | 577 | 561 | 141.0 |
| D | 12 | 233 | 56238 | 394.77 | 577 | 561 | 141.0 |
| D | 13 | 249 | 54826 | 384.76 | 577 | 561 | 141.0 |
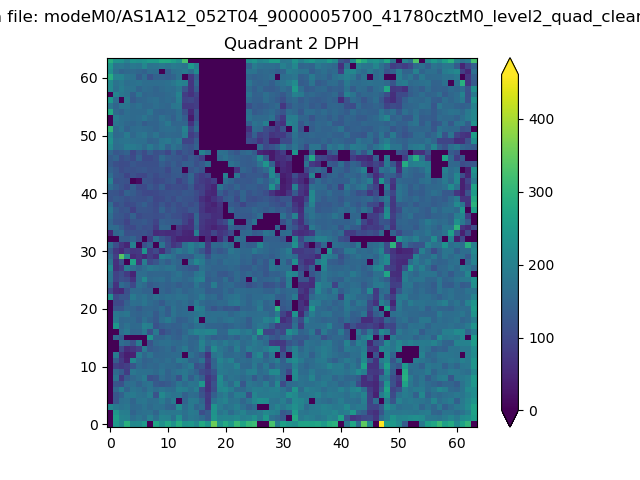
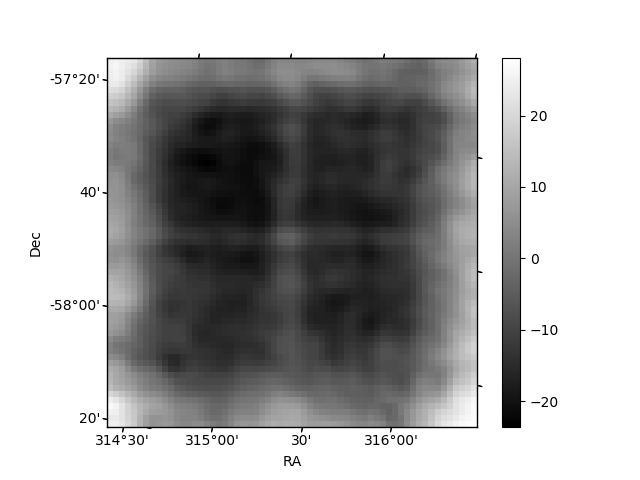
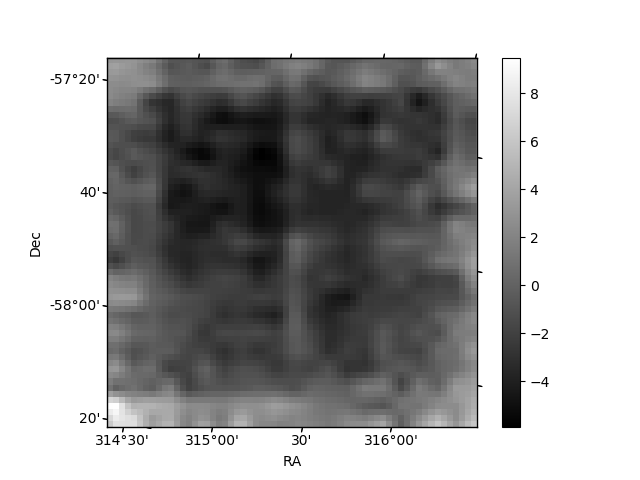
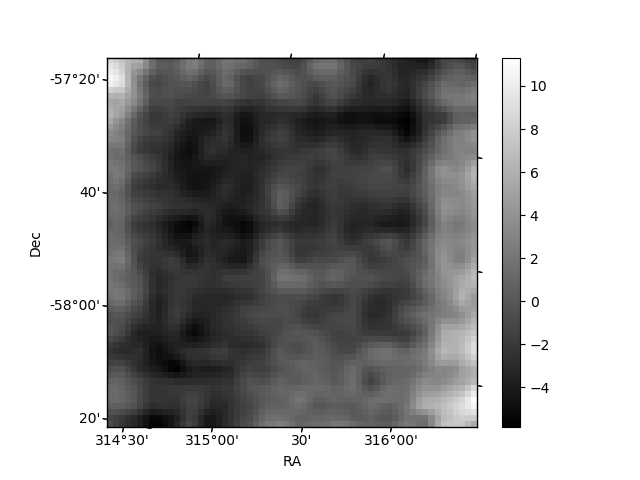
Histogram calculated using DETX and DETY for each event in the final _common_clean file
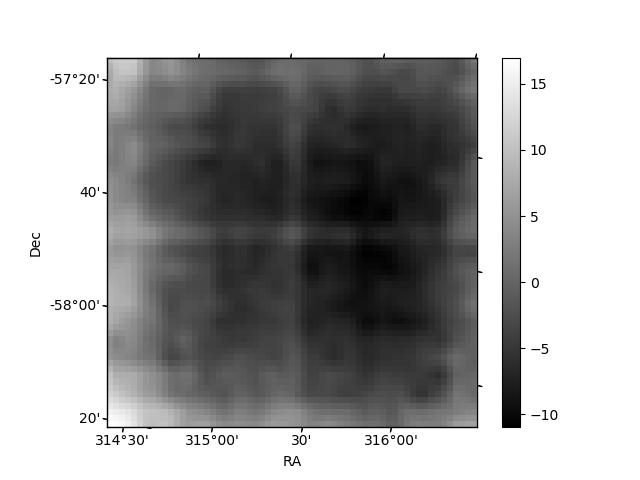
| Quadrant A | 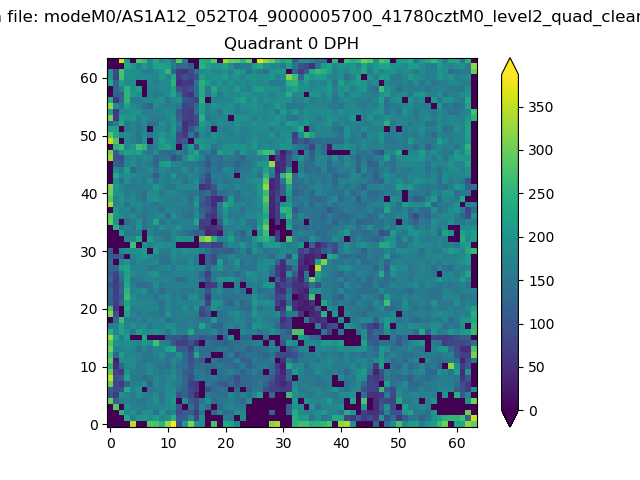 |
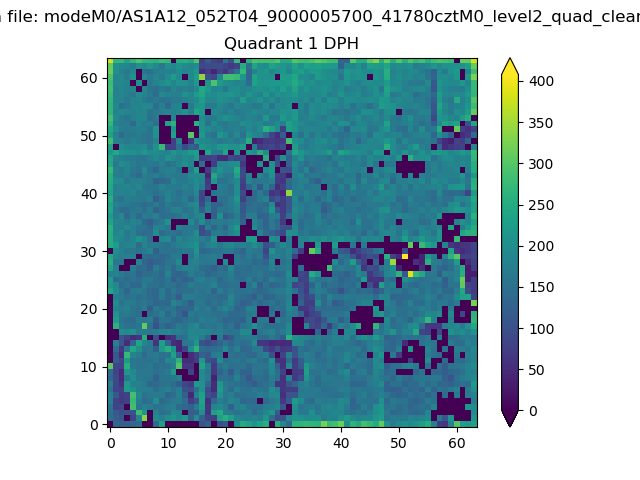 |
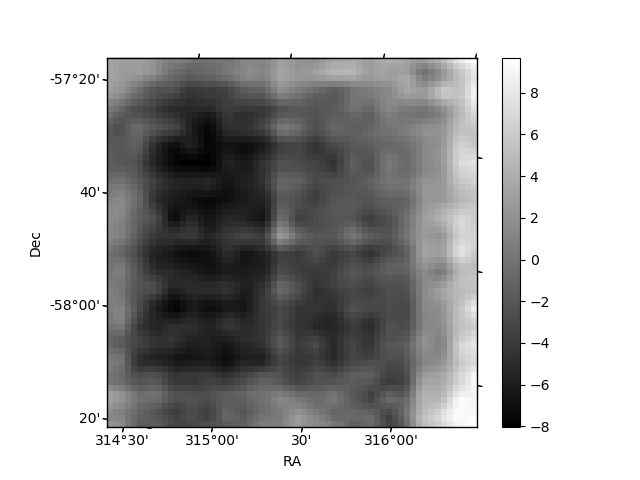
Quadrant B |
|---|---|---|---|
| Quadrant D | 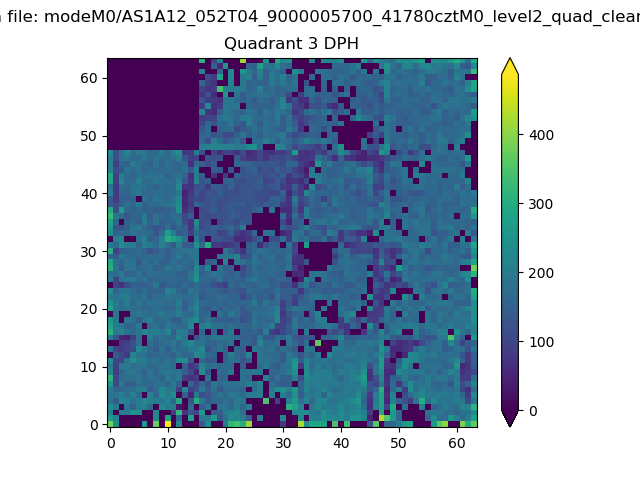 |
 |
Quadrant C |
| Plot type | Count rate plots | Images |
|---|---|---|
| Comparison with Poisson distribution Blue bars denote a histogram of data divided into 1 sec bins. Red curve is a Poisson curve with rate = median count rate of data. |
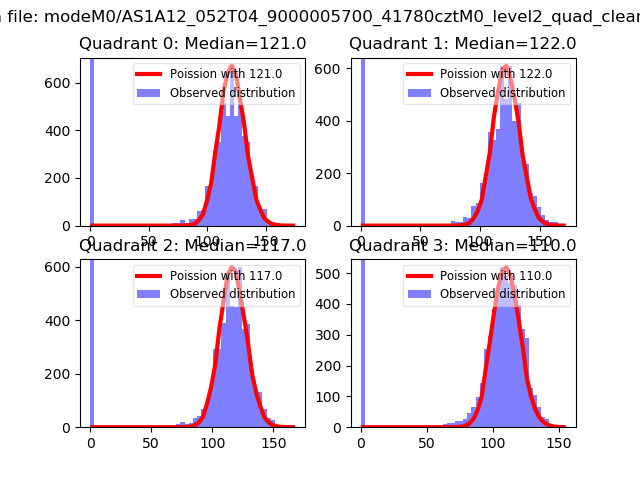 |
 |
| Quadrant-wise count rates Data is divided into 100 sec bins |
 |
|
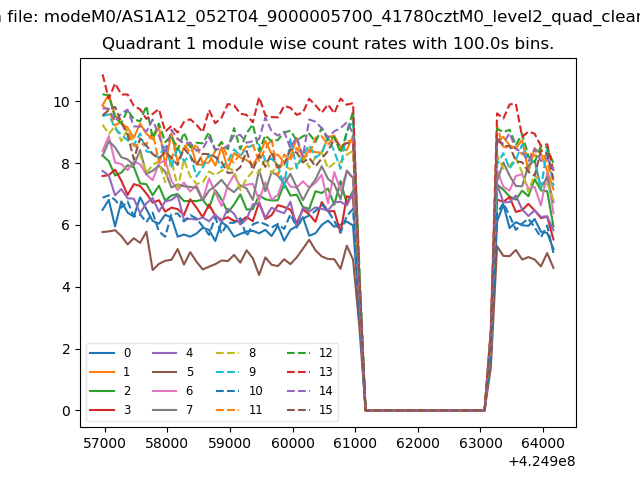
| Module-wise count rates for Quadrant A Data is divided into 100 sec bins |
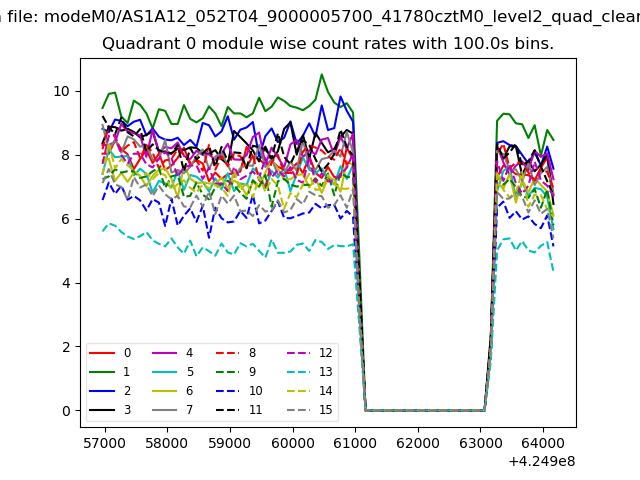 |
 |
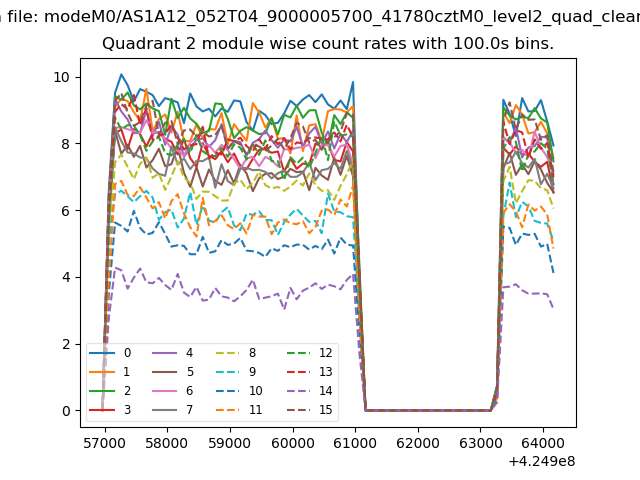
| Module-wise count rates for Quadrant B Data is divided into 100 sec bins |
 |
 |
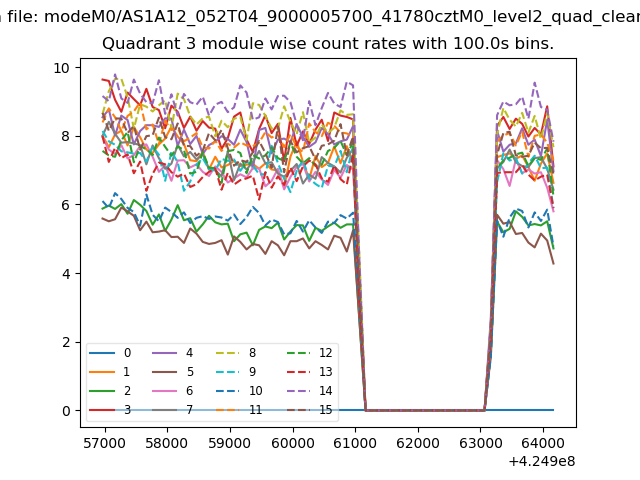
| Module-wise count rates for Quadrant C Data is divided into 100 sec bins |
 |
 |
| Module-wise count rates for Quadrant D Data is divided into 100 sec bins |
 |
 |
| Parameter | Plot |
|---|---|
| CZT HV Monitor | 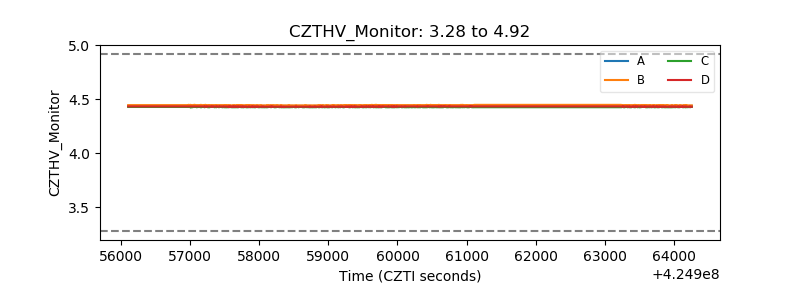 |
| D_VDD | 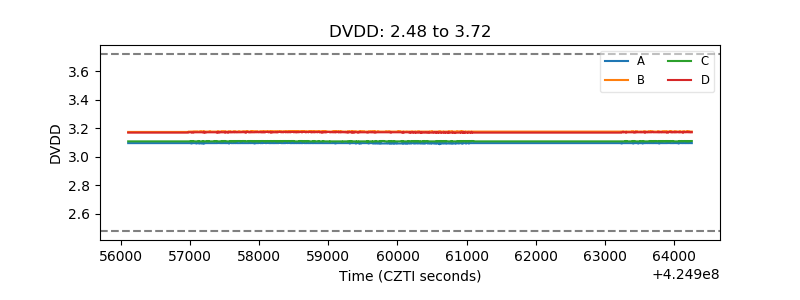 |
| Temperature 1 | 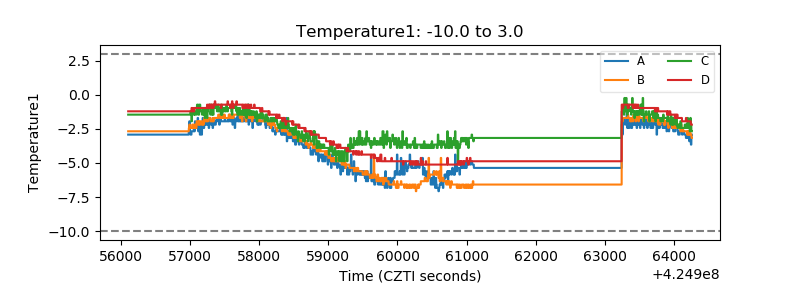 |
| Veto HV Monitor | 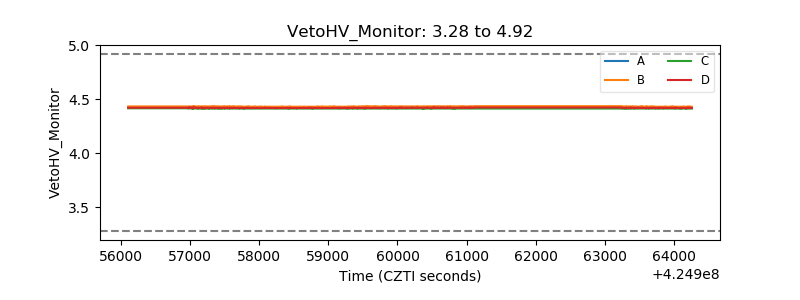 |
| Veto LLD | 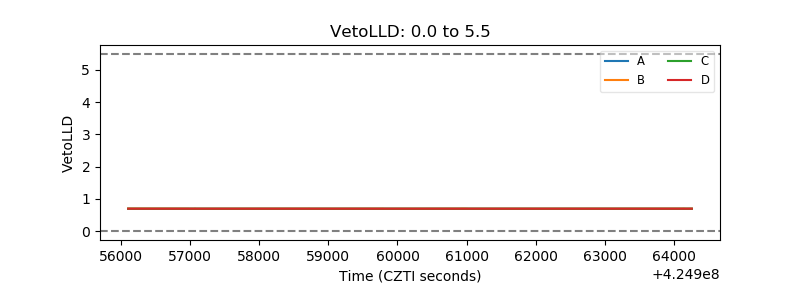 |
| Alpha Counter | 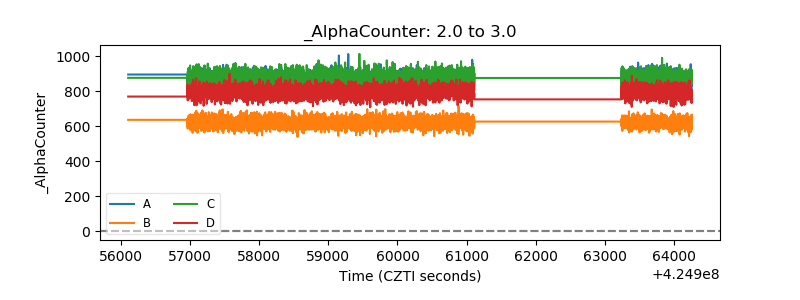 |
| _CPM_Rate | 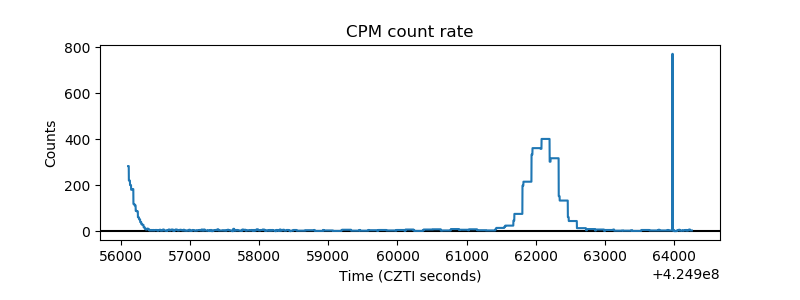 |
| CZT Counter | 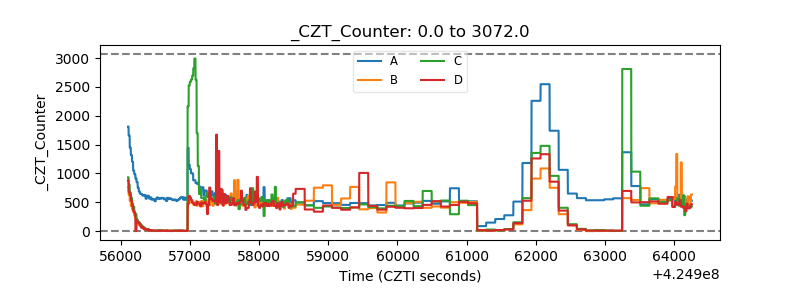 |
| +2.5 Volts monitor | 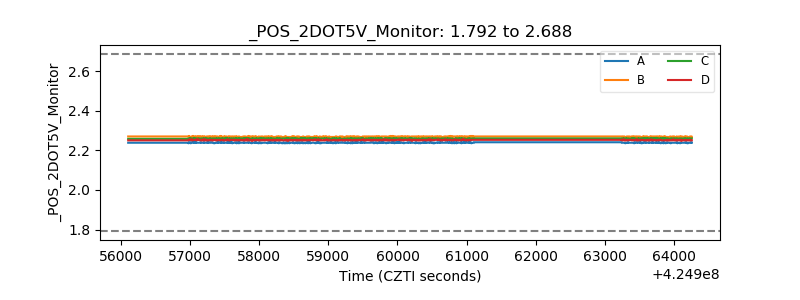 |
| +5 Volts monitor | 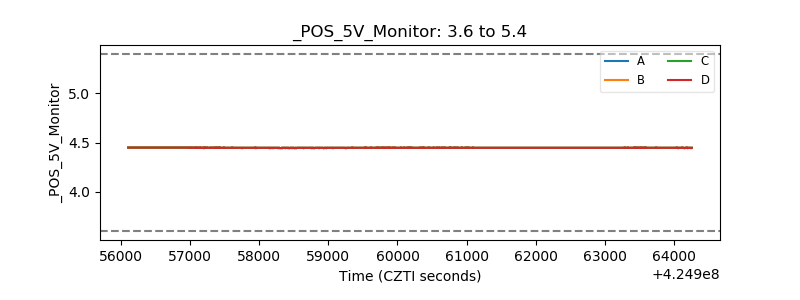 |
| _ROLL_ROT | 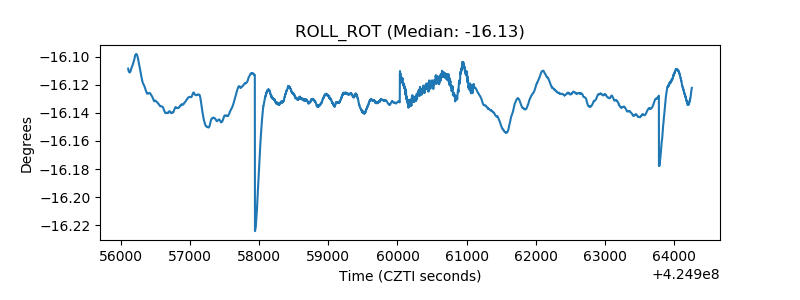 |
| _Roll_DEC | 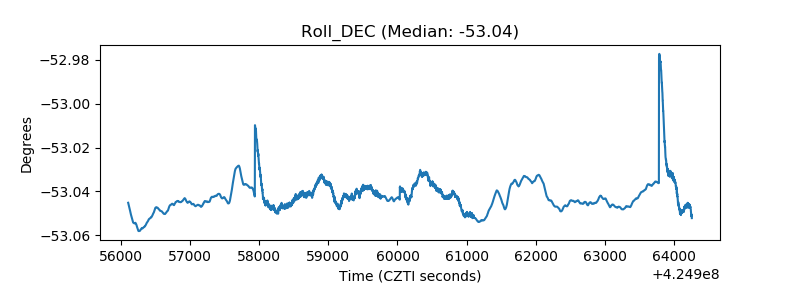 |
| _Roll_RA | 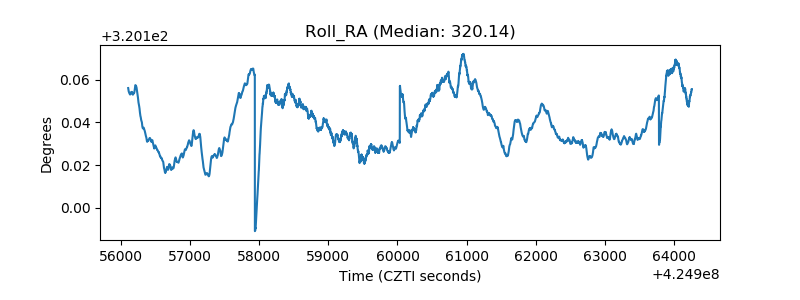 |
| Veto Counter | 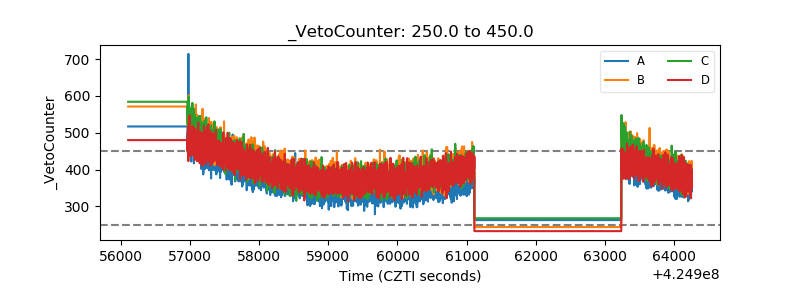 |