| Param | Original file | Final file |
|---|---|---|
| Filename | modeM0/AS1A12_052T04_9000005700_41781cztM0_level2.fits | modeM0/AS1A12_052T04_9000005700_41781cztM0_level2_quad_clean.evt |
| Size (bytes) | 316,483,200 | 86,198,400 |
| Size | 301.8 MB | 82.2 MB |
| Events in quadrant A | 2,820,860 | 589,510 |
| Events in quadrant B | 2,908,414 | 591,223 |
| Events in quadrant C | 3,022,108 | 542,288 |
| Events in quadrant D | 2,564,837 | 528,694 |
| Mode M9 | |||
|---|---|---|---|
| Quadrant | BADHDUFLAG | Total packets | Discarded packets |
| A | 0 | 26 | 0 |
| B | 0 | 26 | 0 |
| C | 0 | 26 | 0 |
| D | 0 | 27 | 0 |
| Mode SS | |||
|---|---|---|---|
| Quadrant | BADHDUFLAG | Total packets | Discarded packets |
| A | 0 | 104 | 0 |
| B | 0 | 104 | 0 |
| C | 0 | 104 | 0 |
| D | 0 | 104 | 0 |
| Mode M0 | |||
|---|---|---|---|
| Quadrant | BADHDUFLAG | Total packets | Discarded packets |
| A | 0 | 11484 | 3 |
| B | 0 | 12092 | 2 |
| C | 0 | 12141 | 2 |
| D | 0 | 11313 | 2 |
| Quadrant | Total seconds | Saturated seconds | Saturation percentage |
|---|---|---|---|
| A | 5117 | 17 | 0.332226% |
| B | 5117 | 73 | 1.426617% |
| C | 5117 | 258 | 5.042017% |
| D | 5117 | 82 | 1.602501% |
Noise dominated data is calculated using 1-second bins in cleaned event files. If a bin has >2000 counts, and if more than 50% of those come from <1% of pixels, then it is considered to be noise-dominated and hence unusable.
| Quadrant | # 1 sec bins | Bins with >0 counts | Bins with >2000 counts | High rate bins dominated by noise | Noise dominated (total time) | Noise dominated (detector-on time) | Marked lightcurve |
|---|---|---|---|---|---|---|---|
| A | 7150 | 5118 | 3 | 3 | 0.04% | 0.06% | 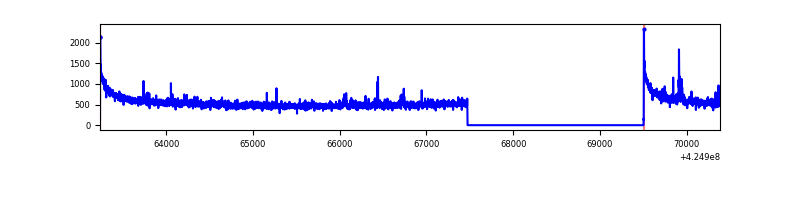 |
| B | 7150 | 5118 | 23 | 23 | 0.32% | 0.45% | 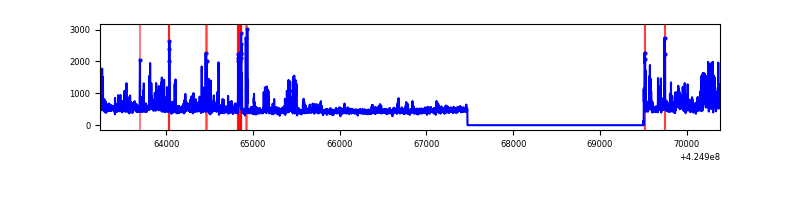 |
| C | 7150 | 5118 | 251 | 251 | 3.51% | 4.90% | 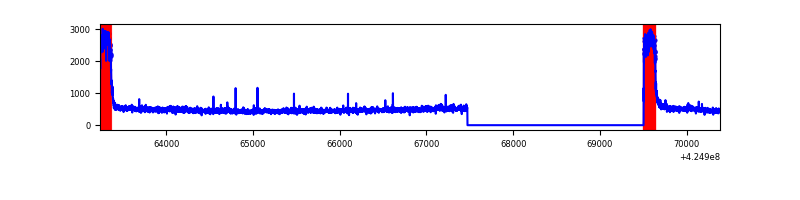 |
| D | 7150 | 5118 | 84 | 84 | 1.17% | 1.64% | 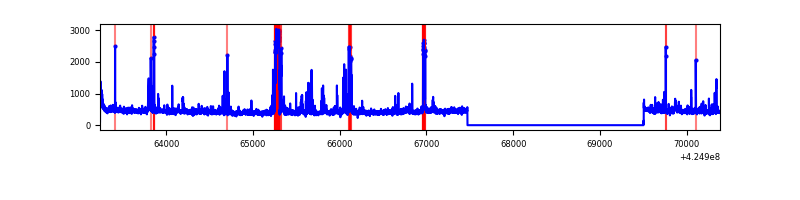 |
Top three noisy pixels from each quadrant. If the there are fewer than three noisy pixels in the level2.evt file, extra rows are filled as -1
| Pixel properties | Quadrant properties | ||||||
|---|---|---|---|---|---|---|---|
| Quadrant | DetID | PixID | Counts | Sigma | Mean | Median | Sigma |
| A | 10 | 83 | 553121 | 4762.74 | 568 | 558 | 116.0 |
| A | 15 | 223 | 43926 | 373.8 | 568 | 558 | 116.0 |
| A | 2 | 79 | 22845 | 192.1 | 568 | 558 | 116.0 |
| B | 0 | 190 | 334415 | 3085.39 | 561 | 545 | 108.2 |
| B | 4 | 141 | 104756 | 963.04 | 561 | 545 | 108.2 |
| B | 5 | 255 | 96498 | 886.73 | 561 | 545 | 108.2 |
| C | 0 | 10 | 749964 | 6138.89 | 527 | 529 | 122.1 |
| C | 15 | 214 | 202450 | 1654.01 | 527 | 529 | 122.1 |
| C | 12 | 249 | 7182 | 54.5 | 527 | 529 | 122.1 |
| D | 2 | 249 | 157918 | 1166.69 | 548 | 532 | 134.9 |
| D | 10 | 199 | 83637 | 616.05 | 548 | 532 | 134.9 |
| D | 12 | 233 | 63842 | 469.31 | 548 | 532 | 134.9 |
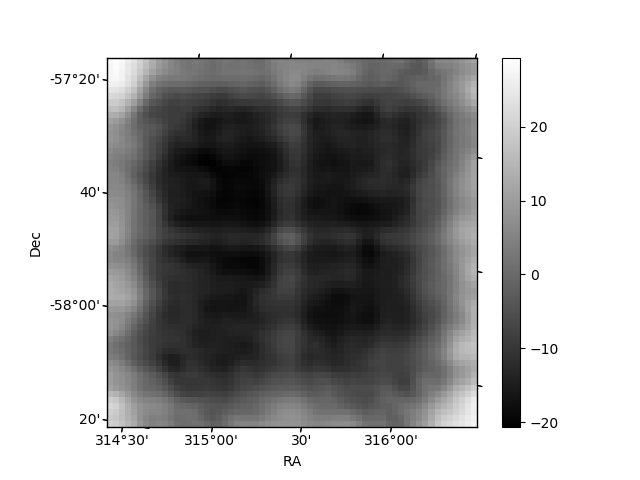
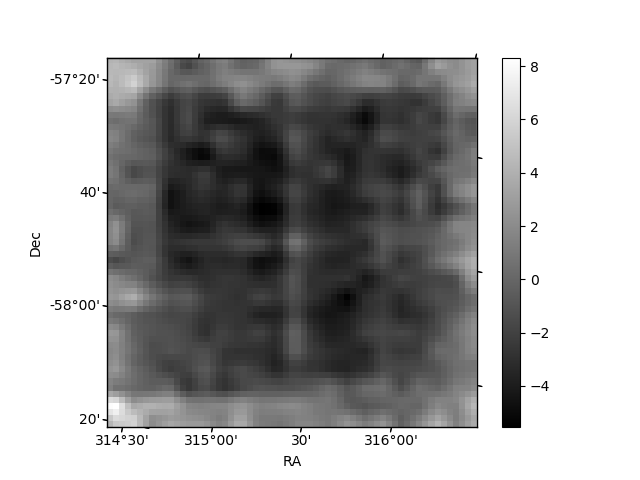
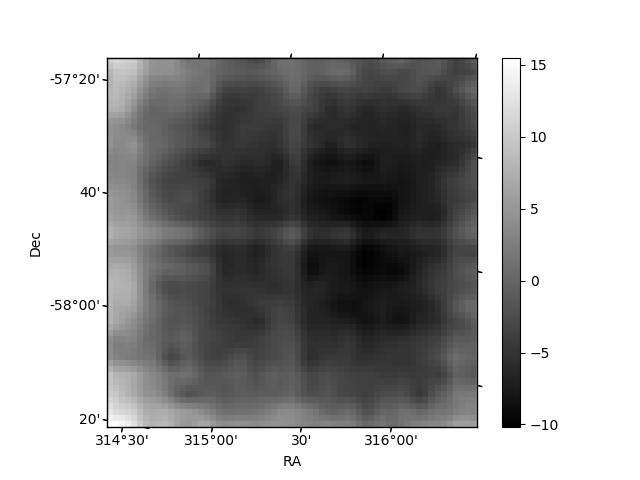
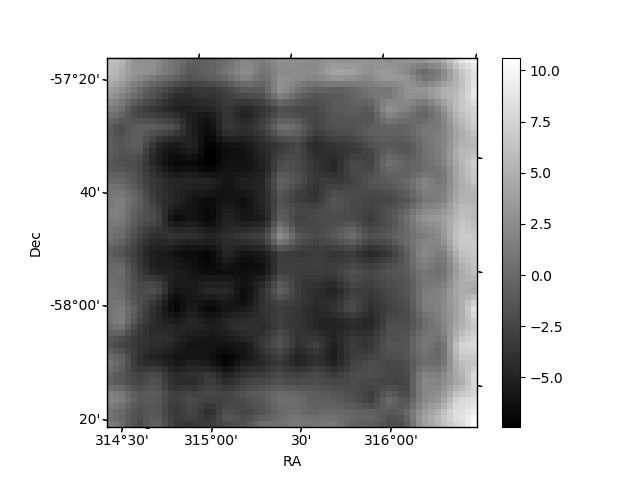
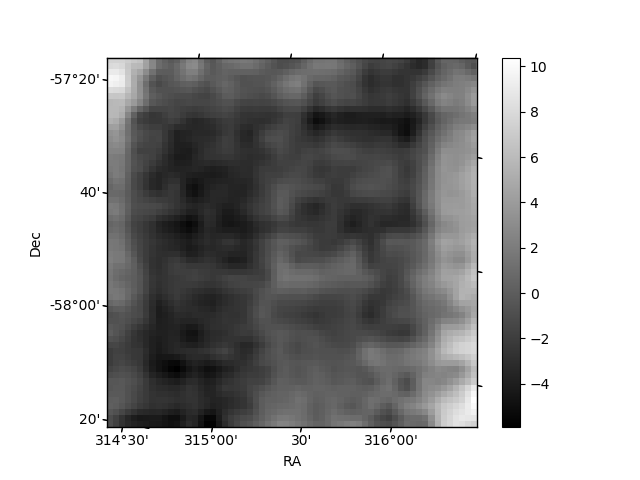
Histogram calculated using DETX and DETY for each event in the final _common_clean file
| Quadrant A | 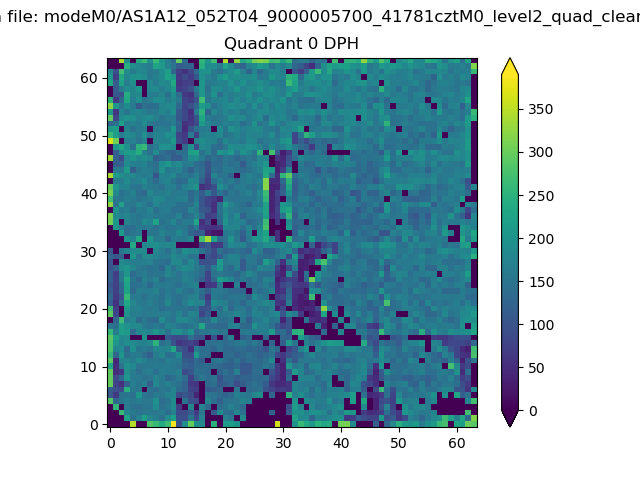 |
 |
Quadrant B |
|---|---|---|---|
| Quadrant D | 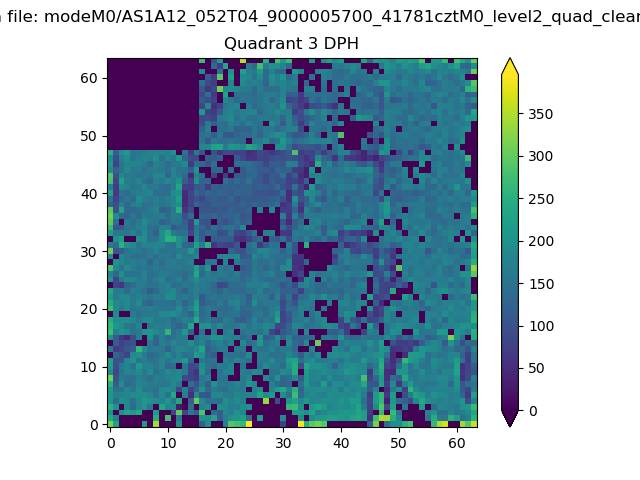 |
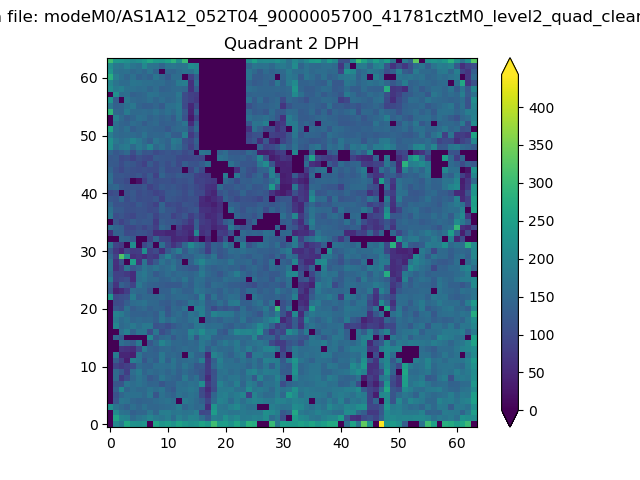 |
Quadrant C |
| Plot type | Count rate plots | Images |
|---|---|---|
| Comparison with Poisson distribution Blue bars denote a histogram of data divided into 1 sec bins. Red curve is a Poisson curve with rate = median count rate of data. |
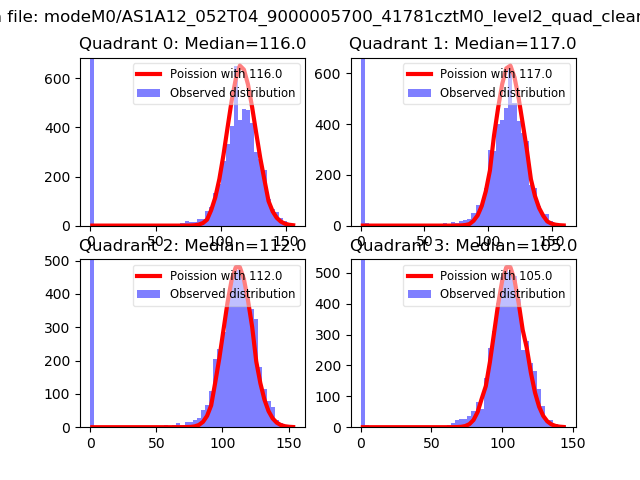 |
 |
| Quadrant-wise count rates Data is divided into 100 sec bins |
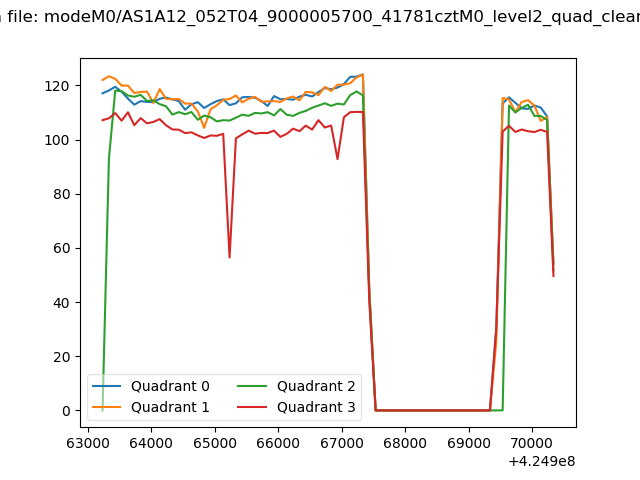 |
|
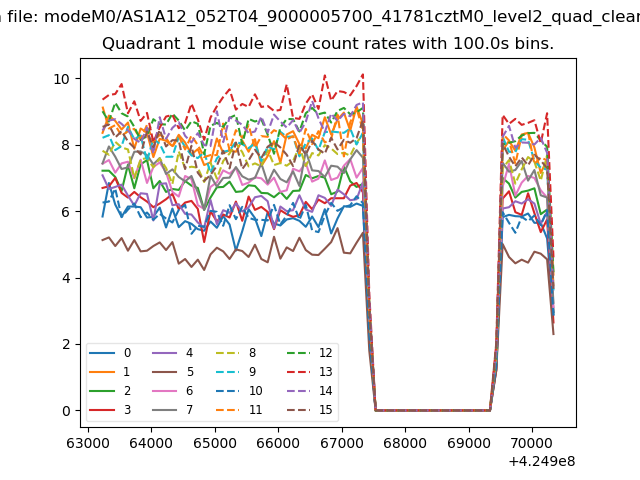
| Module-wise count rates for Quadrant A Data is divided into 100 sec bins |
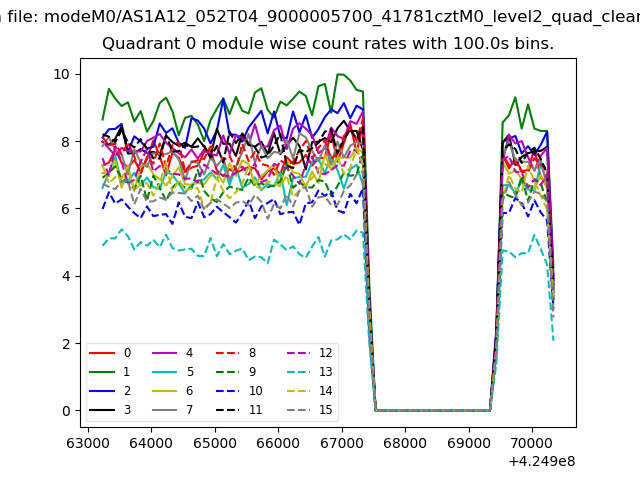 |
 |
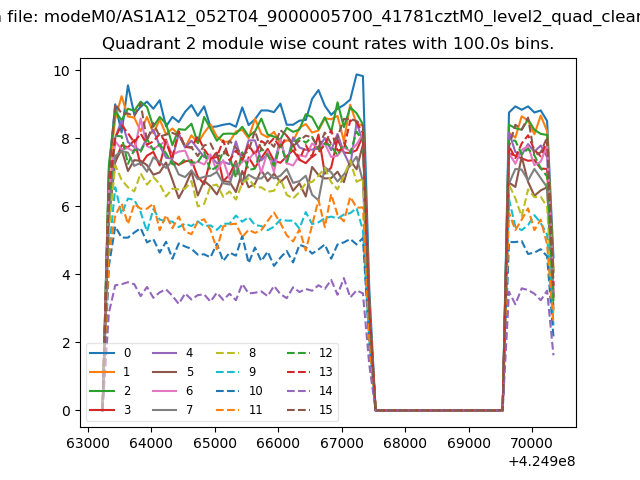
| Module-wise count rates for Quadrant B Data is divided into 100 sec bins |
 |
 |
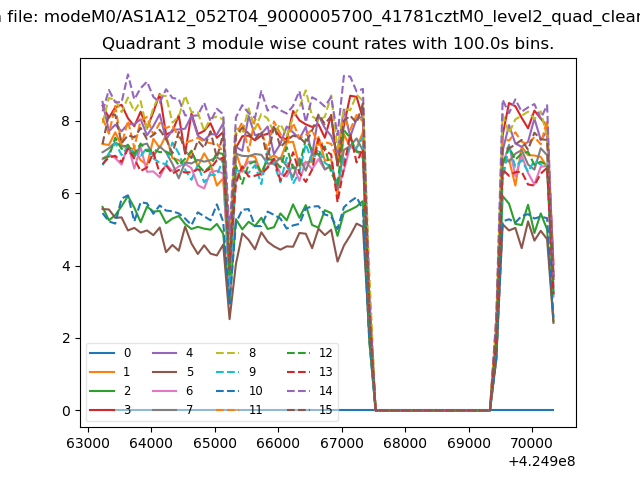
| Module-wise count rates for Quadrant C Data is divided into 100 sec bins |
 |
 |
| Module-wise count rates for Quadrant D Data is divided into 100 sec bins |
 |
 |
| Parameter | Plot |
|---|---|
| CZT HV Monitor | 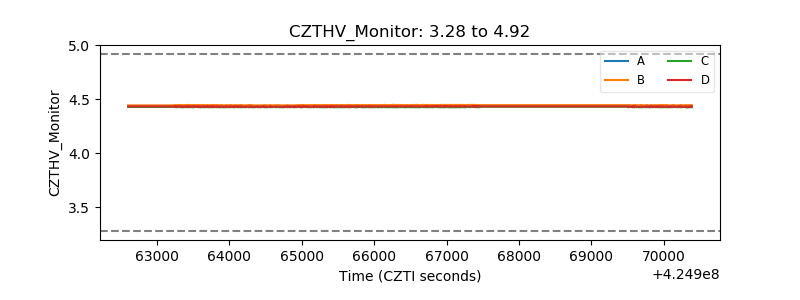 |
| D_VDD | 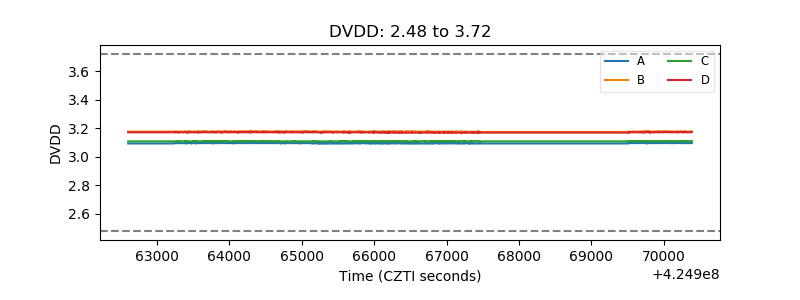 |
| Temperature 1 | 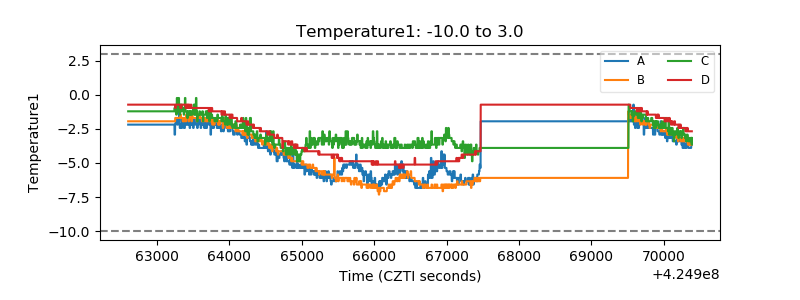 |
| Veto HV Monitor | 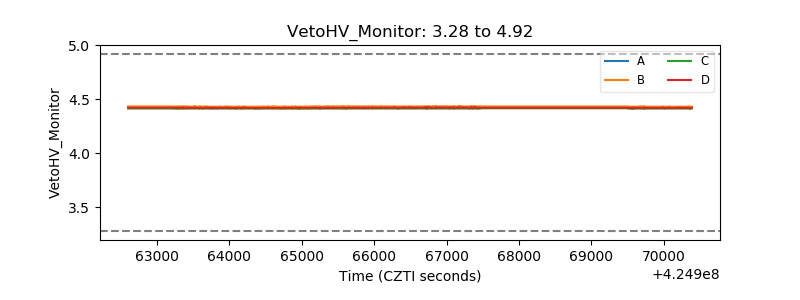 |
| Veto LLD | 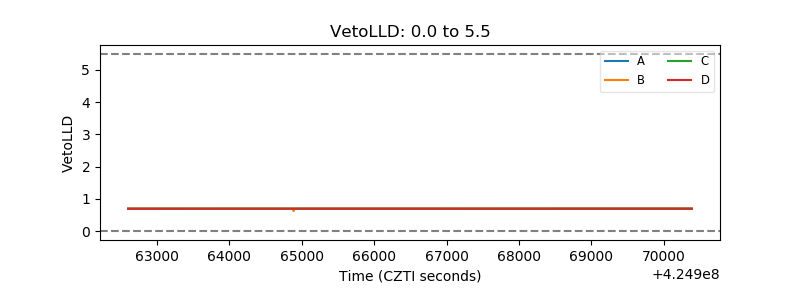 |
| Alpha Counter | 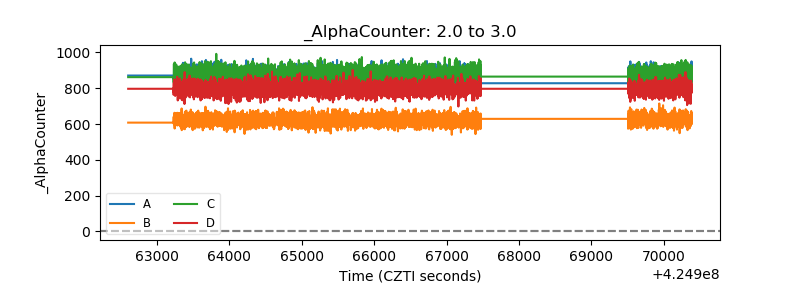 |
| _CPM_Rate | 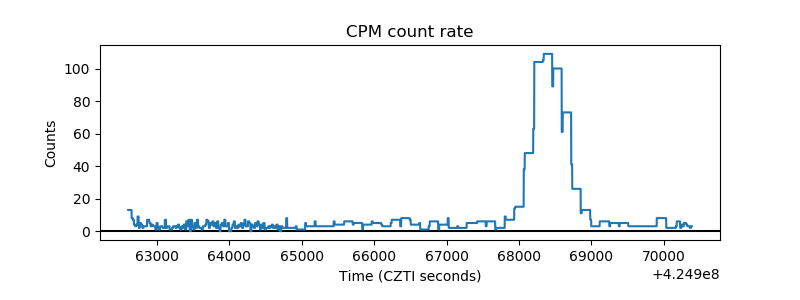 |
| CZT Counter | 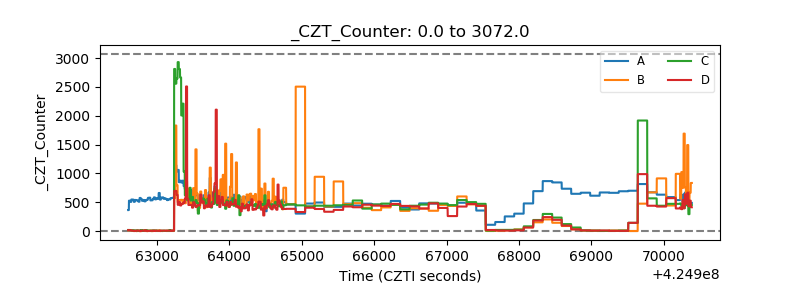 |
| +2.5 Volts monitor | 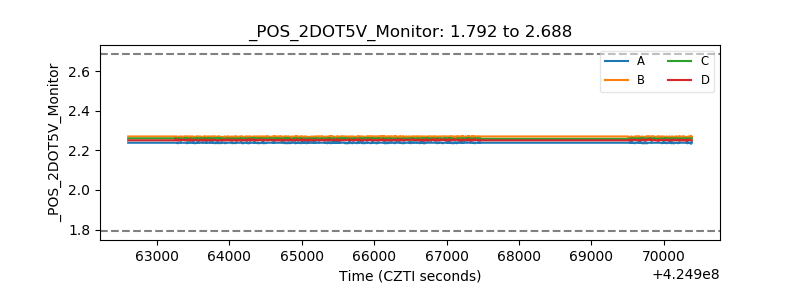 |
| +5 Volts monitor | 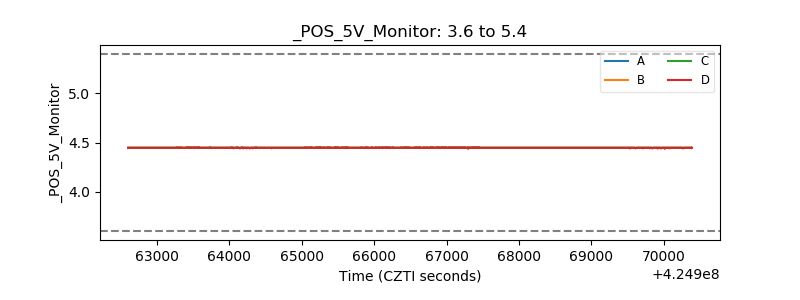 |
| _ROLL_ROT | 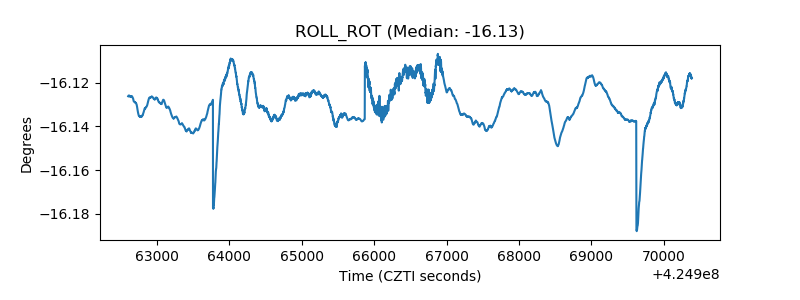 |
| _Roll_DEC | 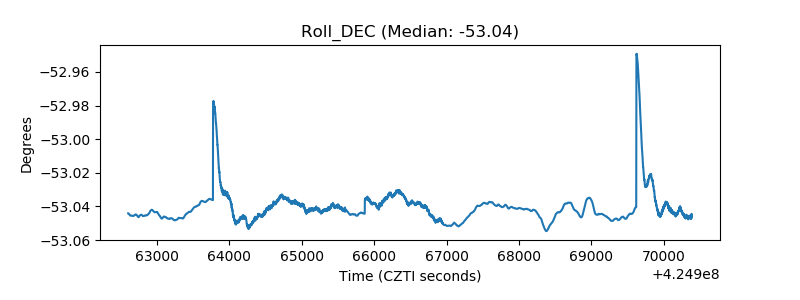 |
| _Roll_RA | 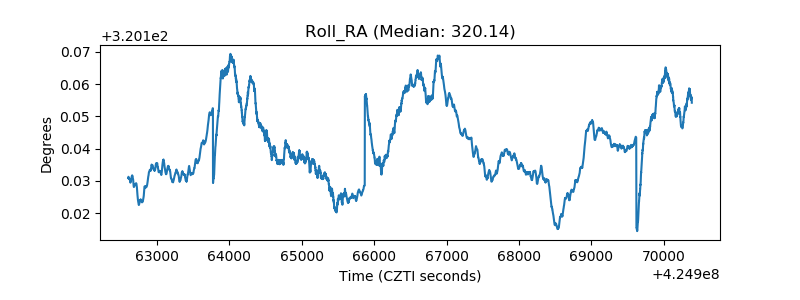 |
| Veto Counter | 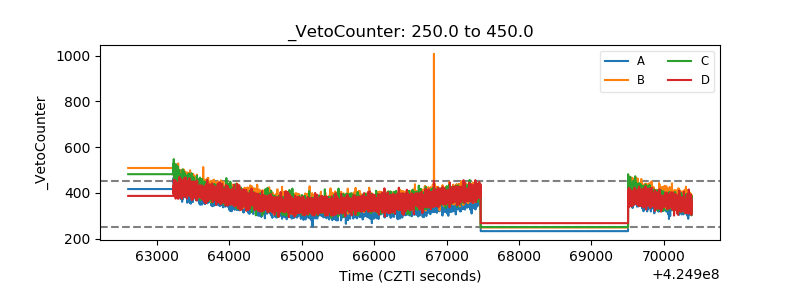 |