| Param | Original file | Final file |
|---|---|---|
| Filename | modeM0/AS1A12_052T04_9000005700_41783cztM0_level2.fits | modeM0/AS1A12_052T04_9000005700_41783cztM0_level2_quad_clean.evt |
| Size (bytes) | 343,526,400 | 92,952,000 |
| Size | 327.6 MB | 88.6 MB |
| Events in quadrant A | 3,141,061 | 632,422 |
| Events in quadrant B | 3,129,663 | 628,980 |
| Events in quadrant C | 3,167,319 | 587,231 |
| Events in quadrant D | 2,833,026 | 566,396 |
| Mode M9 | |||
|---|---|---|---|
| Quadrant | BADHDUFLAG | Total packets | Discarded packets |
| A | 0 | 20 | 0 |
| B | 0 | 20 | 0 |
| C | 0 | 20 | 0 |
| D | 0 | 21 | 0 |
| Mode SS | |||
|---|---|---|---|
| Quadrant | BADHDUFLAG | Total packets | Discarded packets |
| A | 0 | 116 | 0 |
| B | 0 | 116 | 0 |
| C | 0 | 116 | 0 |
| D | 0 | 116 | 0 |
| Mode M0 | |||
|---|---|---|---|
| Quadrant | BADHDUFLAG | Total packets | Discarded packets |
| A | 0 | 12830 | 3 |
| B | 0 | 13336 | 2 |
| C | 0 | 13122 | 2 |
| D | 0 | 12694 | 2 |
| Quadrant | Total seconds | Saturated seconds | Saturation percentage |
|---|---|---|---|
| A | 5715 | 23 | 0.402450% |
| B | 5715 | 121 | 2.117235% |
| C | 5715 | 232 | 4.059493% |
| D | 5715 | 74 | 1.294838% |
Noise dominated data is calculated using 1-second bins in cleaned event files. If a bin has >2000 counts, and if more than 50% of those come from <1% of pixels, then it is considered to be noise-dominated and hence unusable.
| Quadrant | # 1 sec bins | Bins with >0 counts | Bins with >2000 counts | High rate bins dominated by noise | Noise dominated (total time) | Noise dominated (detector-on time) | Marked lightcurve |
|---|---|---|---|---|---|---|---|
| A | 7178 | 5716 | 11 | 11 | 0.15% | 0.19% | 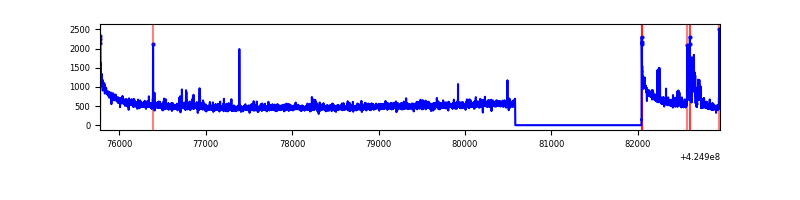 |
| B | 7178 | 5716 | 70 | 70 | 0.98% | 1.22% | 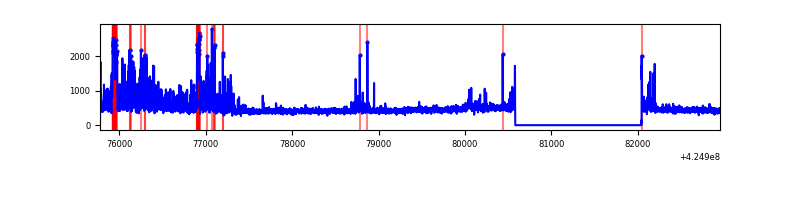 |
| C | 7178 | 5716 | 224 | 224 | 3.12% | 3.92% | 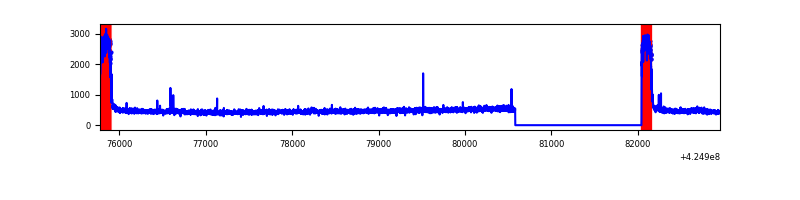 |
| D | 7178 | 5716 | 79 | 79 | 1.10% | 1.38% | 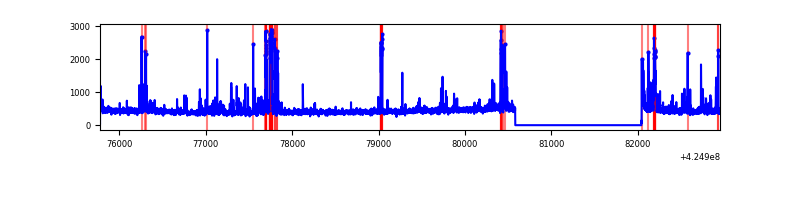 |
Top three noisy pixels from each quadrant. If the there are fewer than three noisy pixels in the level2.evt file, extra rows are filled as -1
| Pixel properties | Quadrant properties | ||||||
|---|---|---|---|---|---|---|---|
| Quadrant | DetID | PixID | Counts | Sigma | Mean | Median | Sigma |
| A | 10 | 83 | 575314 | 4505.15 | 618 | 605 | 127.6 |
| A | 15 | 223 | 148001 | 1155.44 | 618 | 605 | 127.6 |
| A | 2 | 79 | 19793 | 150.41 | 618 | 605 | 127.6 |
| B | 0 | 190 | 366207 | 3095.9 | 610 | 592 | 118.1 |
| B | 5 | 32 | 132193 | 1114.35 | 610 | 592 | 118.1 |
| B | 4 | 171 | 103061 | 867.67 | 610 | 592 | 118.1 |
| C | 0 | 10 | 643806 | 4722.24 | 584 | 587 | 136.2 |
| C | 15 | 214 | 226747 | 1660.37 | 584 | 587 | 136.2 |
| C | 15 | 111 | 10720 | 74.39 | 584 | 587 | 136.2 |
| D | 13 | 249 | 215915 | 1457.61 | 601 | 582 | 147.7 |
| D | 12 | 233 | 88214 | 593.19 | 601 | 582 | 147.7 |
| D | 9 | 19 | 70986 | 476.57 | 601 | 582 | 147.7 |
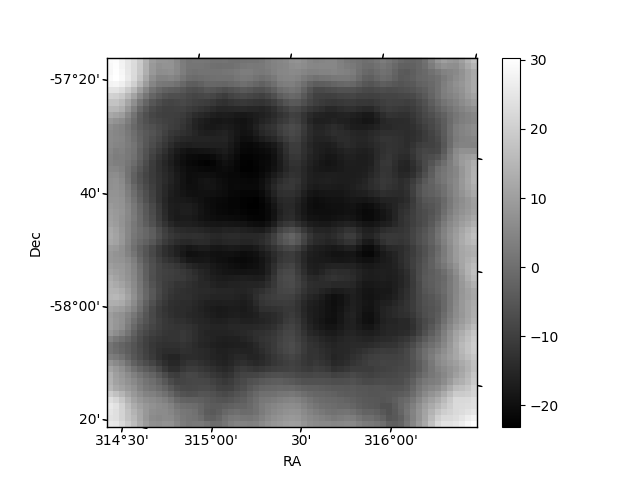
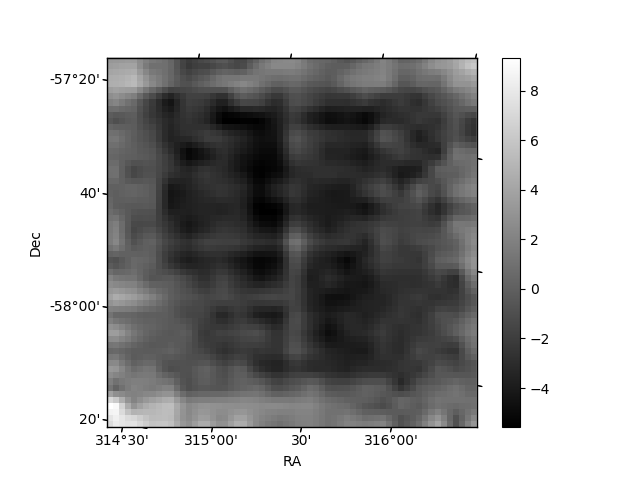
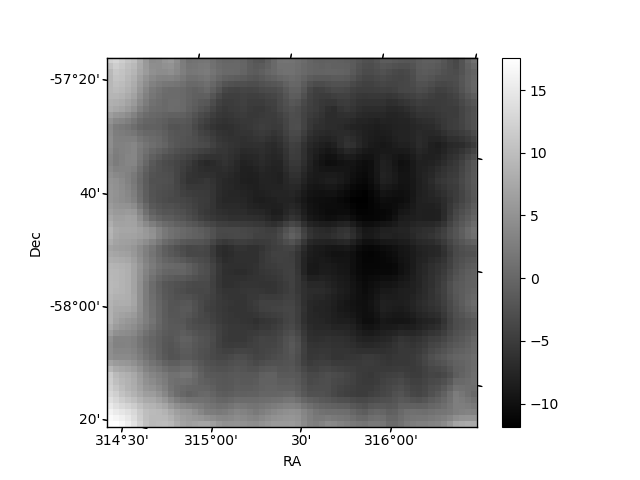
Histogram calculated using DETX and DETY for each event in the final _common_clean file
| Quadrant A | 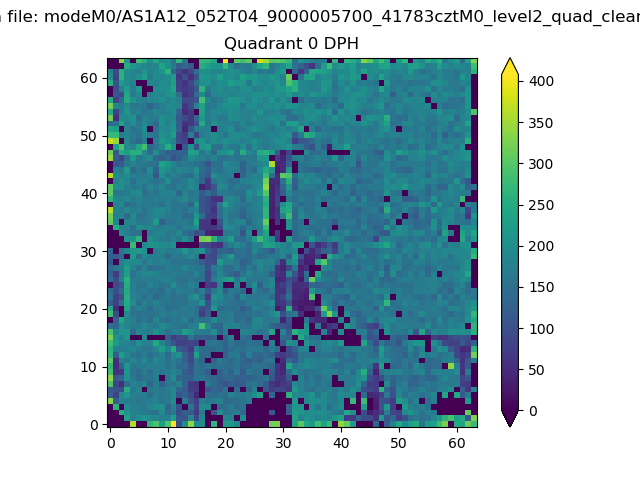 |
 |
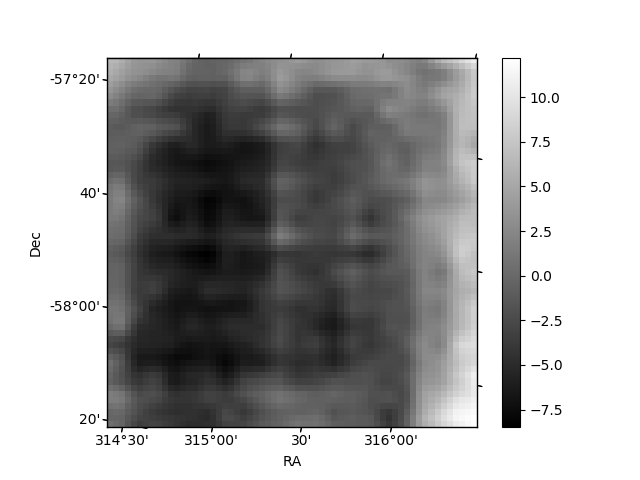
Quadrant B |
|---|---|---|---|
| Quadrant D | 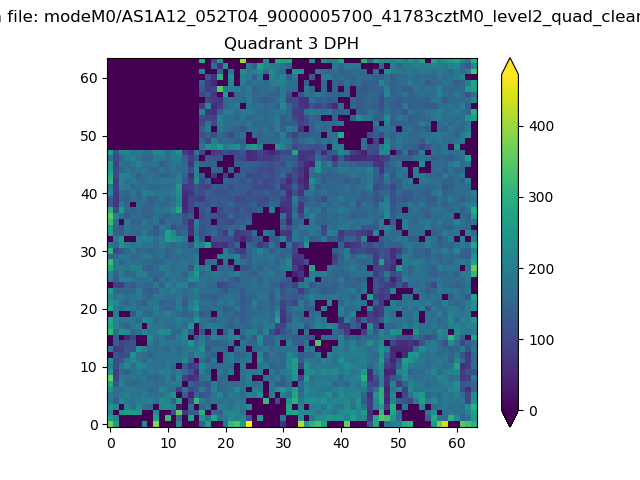 |
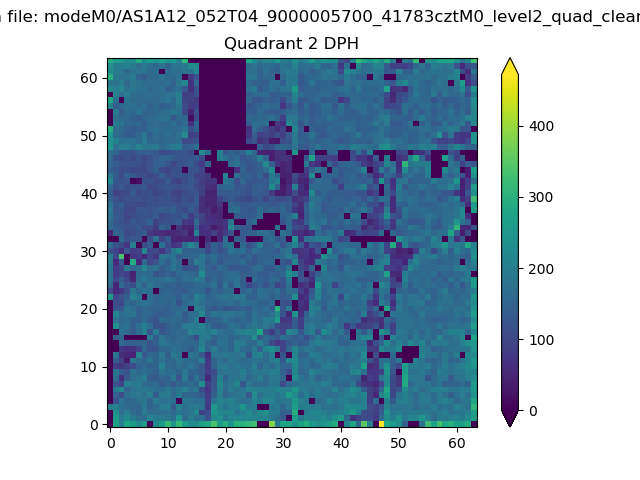 |
Quadrant C |
| Plot type | Count rate plots | Images |
|---|---|---|
| Comparison with Poisson distribution Blue bars denote a histogram of data divided into 1 sec bins. Red curve is a Poisson curve with rate = median count rate of data. |
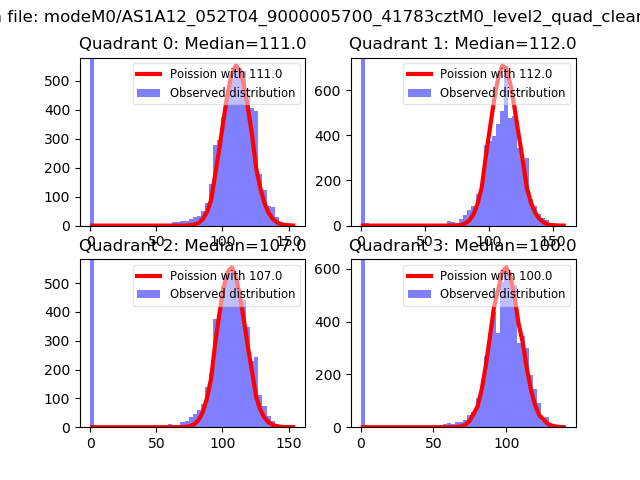 |
 |
| Quadrant-wise count rates Data is divided into 100 sec bins |
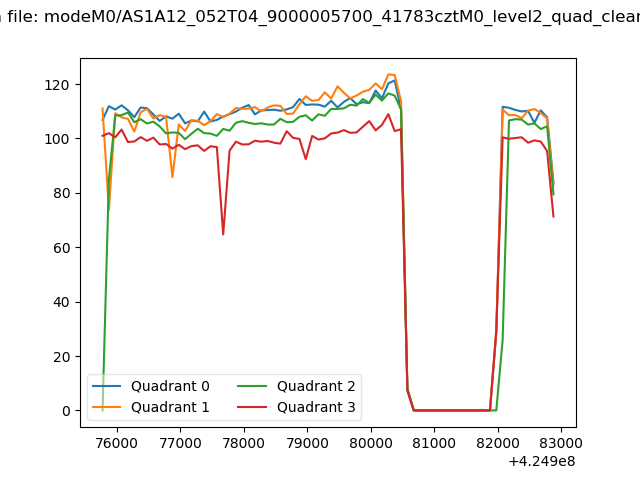 |
|
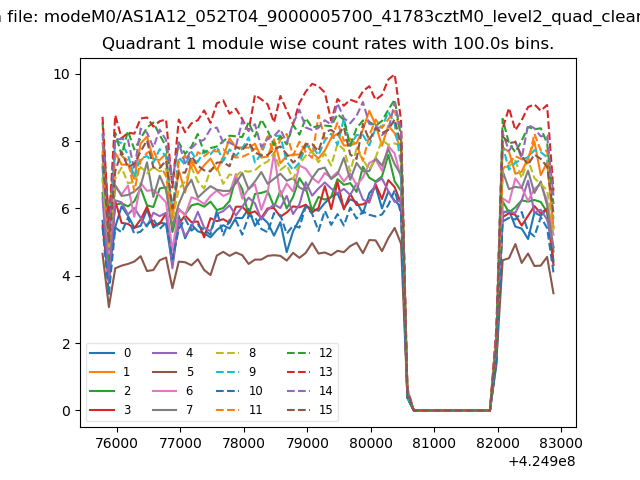
| Module-wise count rates for Quadrant A Data is divided into 100 sec bins |
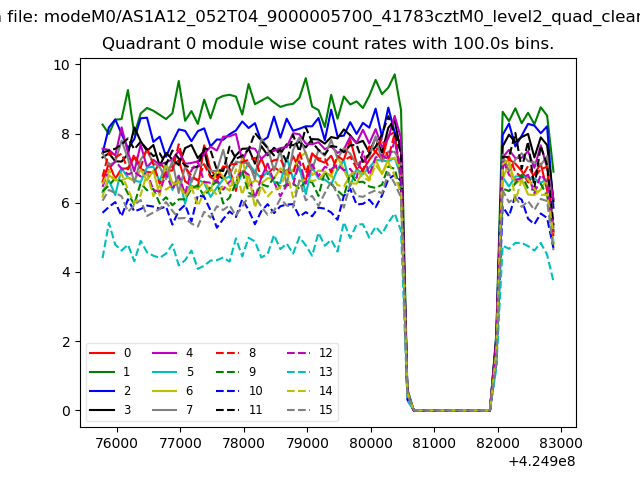 |
 |
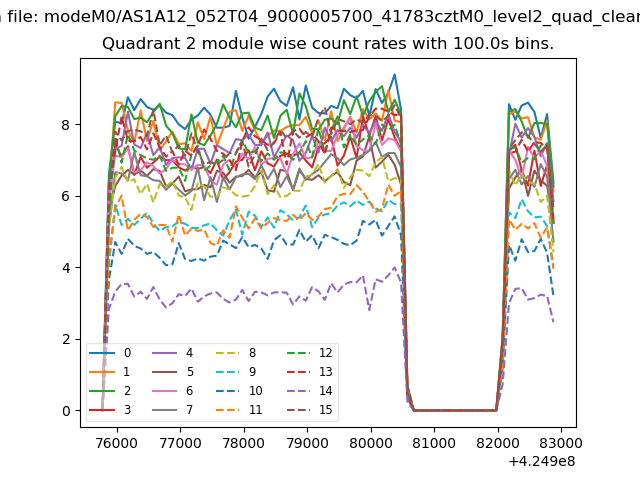
| Module-wise count rates for Quadrant B Data is divided into 100 sec bins |
 |
 |
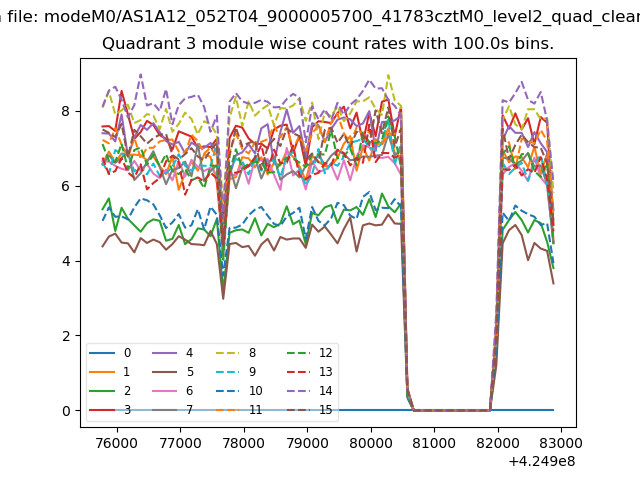
| Module-wise count rates for Quadrant C Data is divided into 100 sec bins |
 |
 |
| Module-wise count rates for Quadrant D Data is divided into 100 sec bins |
 |
 |
| Parameter | Plot |
|---|---|
| CZT HV Monitor | 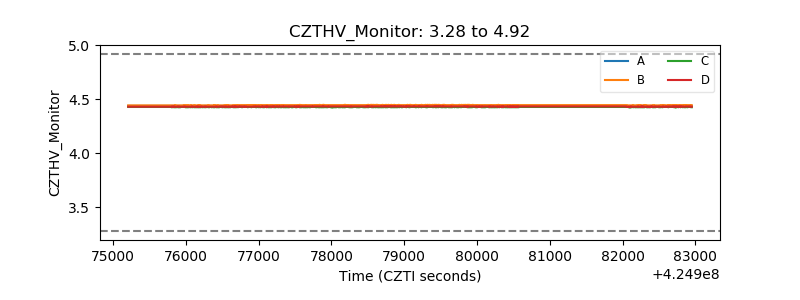 |
| D_VDD | 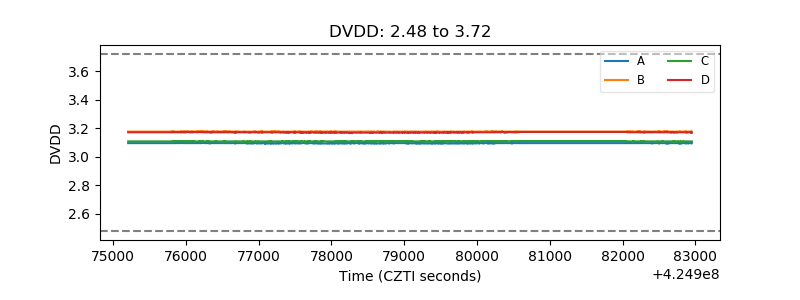 |
| Temperature 1 | 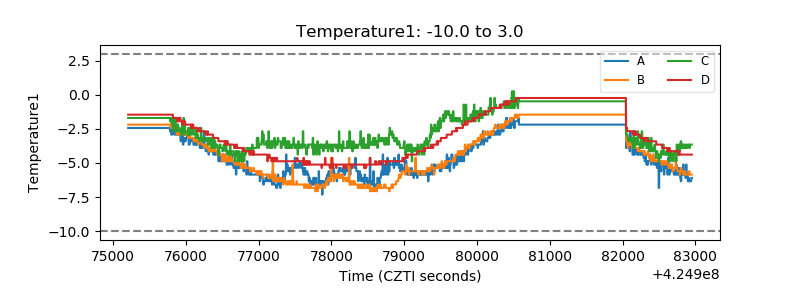 |
| Veto HV Monitor | 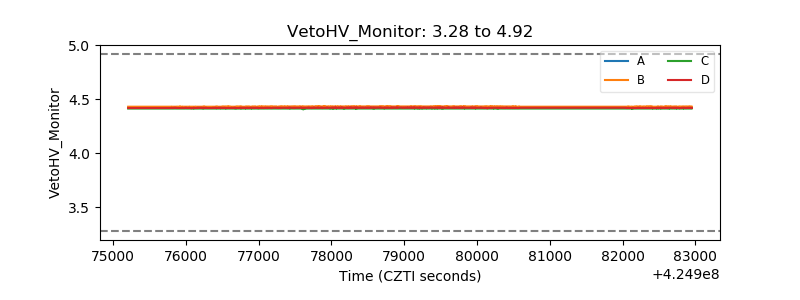 |
| Veto LLD | 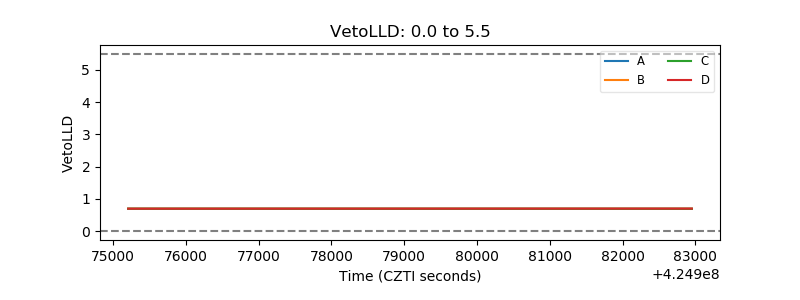 |
| Alpha Counter | 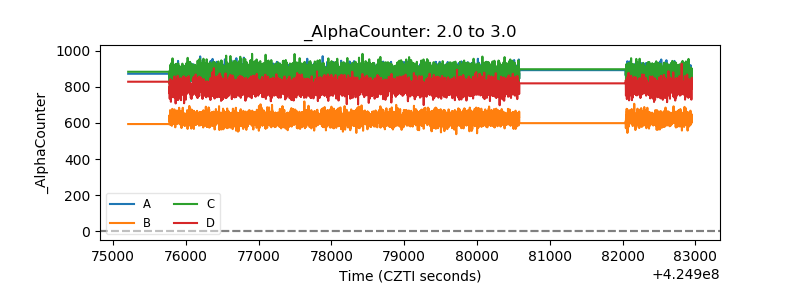 |
| _CPM_Rate | 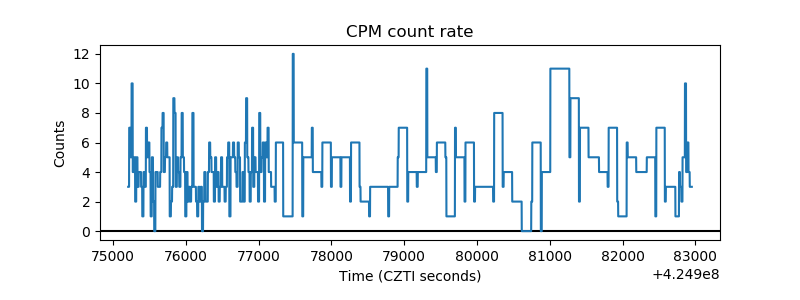 |
| CZT Counter | 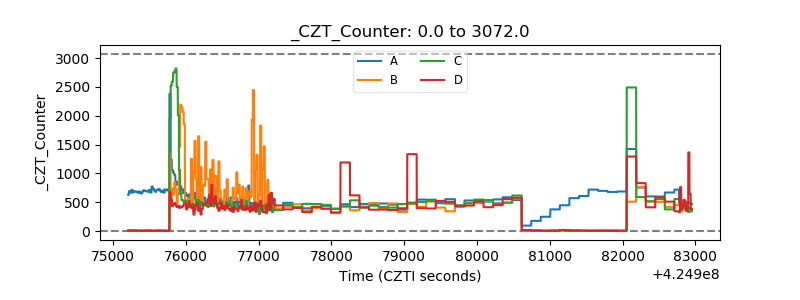 |
| +2.5 Volts monitor | 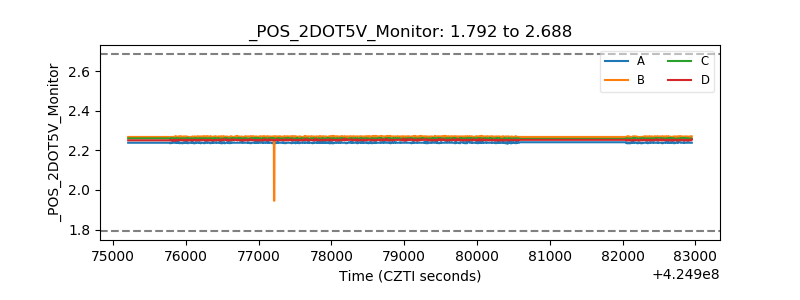 |
| +5 Volts monitor | 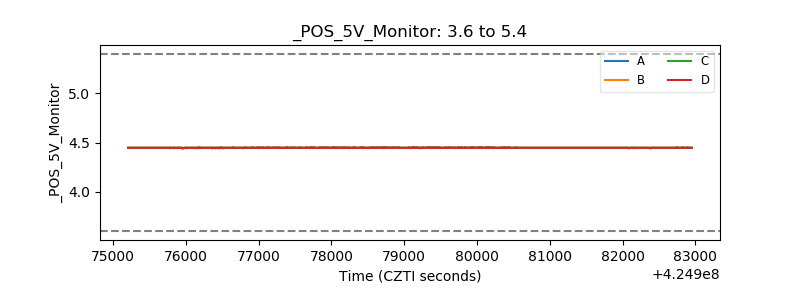 |
| _ROLL_ROT | 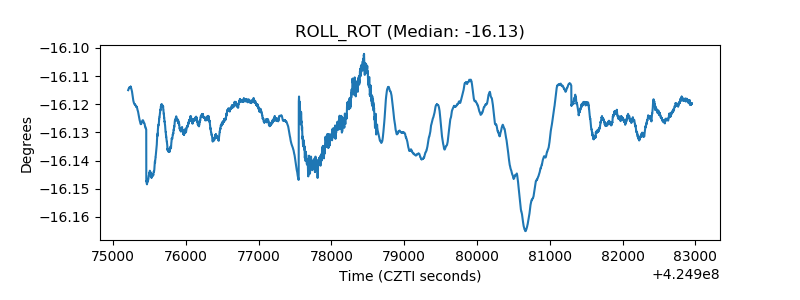 |
| _Roll_DEC | 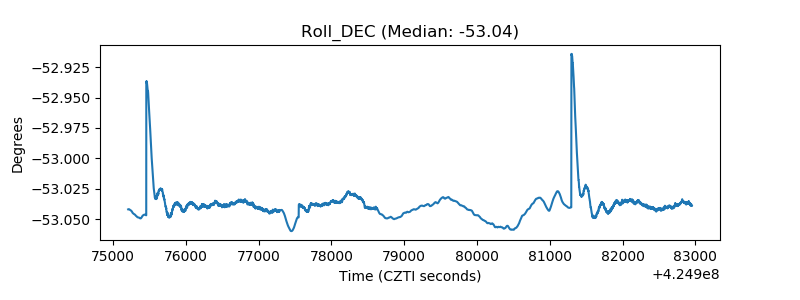 |
| _Roll_RA | 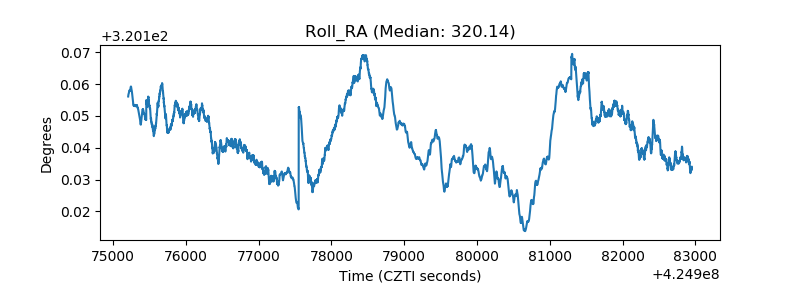 |
| Veto Counter | 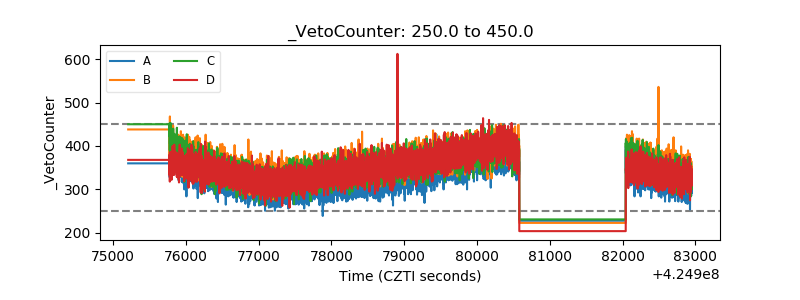 |