| Param | Original file | Final file |
|---|---|---|
| Filename | modeM0/AS1A12_052T04_9000005700_41784cztM0_level2.fits | modeM0/AS1A12_052T04_9000005700_41784cztM0_level2_quad_clean.evt |
| Size (bytes) | 414,244,800 | 105,217,920 |
| Size | 395.1 MB | 100.3 MB |
| Events in quadrant A | 3,948,451 | 710,957 |
| Events in quadrant B | 2,934,659 | 724,973 |
| Events in quadrant C | 3,635,740 | 670,220 |
| Events in quadrant D | 4,310,326 | 627,452 |
| Mode M9 | |||
|---|---|---|---|
| Quadrant | BADHDUFLAG | Total packets | Discarded packets |
| A | 0 | 28 | 0 |
| B | 0 | 28 | 0 |
| C | 0 | 28 | 0 |
| D | 0 | 28 | 0 |
| Mode SS | |||
|---|---|---|---|
| Quadrant | BADHDUFLAG | Total packets | Discarded packets |
| A | 0 | 132 | 0 |
| B | 0 | 132 | 0 |
| C | 0 | 132 | 0 |
| D | 0 | 132 | 0 |
| Mode M0 | |||
|---|---|---|---|
| Quadrant | BADHDUFLAG | Total packets | Discarded packets |
| A | 0 | 15918 | 3 |
| B | 0 | 13268 | 2 |
| C | 0 | 14815 | 2 |
| D | 0 | 17384 | 2 |
| Quadrant | Total seconds | Saturated seconds | Saturation percentage |
|---|---|---|---|
| A | 6490 | 68 | 1.047766% |
| B | 6490 | 17 | 0.261941% |
| C | 6490 | 232 | 3.574730% |
| D | 6490 | 269 | 4.144838% |
Noise dominated data is calculated using 1-second bins in cleaned event files. If a bin has >2000 counts, and if more than 50% of those come from <1% of pixels, then it is considered to be noise-dominated and hence unusable.
| Quadrant | # 1 sec bins | Bins with >0 counts | Bins with >2000 counts | High rate bins dominated by noise | Noise dominated (total time) | Noise dominated (detector-on time) | Marked lightcurve |
|---|---|---|---|---|---|---|---|
| A | 9266 | 6492 | 54 | 54 | 0.58% | 0.83% | 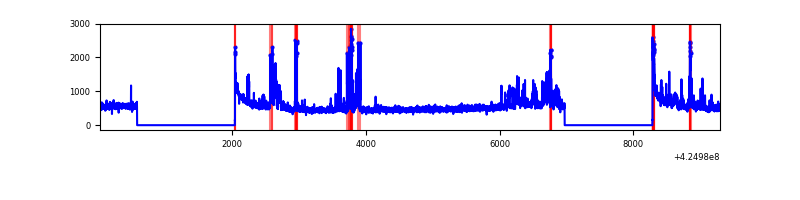 |
| B | 9266 | 6492 | 3 | 3 | 0.03% | 0.05% | 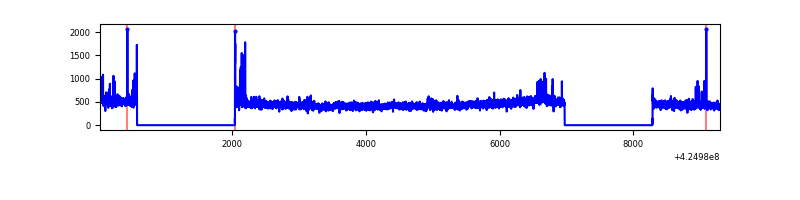 |
| C | 9266 | 6492 | 228 | 228 | 2.46% | 3.51% | 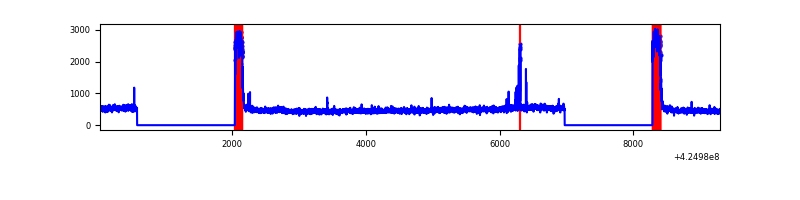 |
| D | 9266 | 6492 | 263 | 263 | 2.84% | 4.05% | 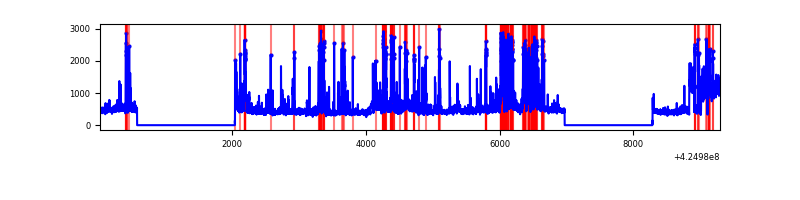 |
Top three noisy pixels from each quadrant. If the there are fewer than three noisy pixels in the level2.evt file, extra rows are filled as -1
| Pixel properties | Quadrant properties | ||||||
|---|---|---|---|---|---|---|---|
| Quadrant | DetID | PixID | Counts | Sigma | Mean | Median | Sigma |
| A | 10 | 83 | 607987 | 4134.13 | 710 | 692 | 146.9 |
| A | 15 | 223 | 579112 | 3937.56 | 710 | 692 | 146.9 |
| A | 2 | 79 | 14607 | 94.73 | 710 | 692 | 146.9 |
| B | 0 | 186 | 43479 | 310.98 | 706 | 685 | 137.6 |
| B | 0 | 183 | 30387 | 215.84 | 706 | 685 | 137.6 |
| B | 0 | 245 | 28853 | 204.69 | 706 | 685 | 137.6 |
| C | 0 | 10 | 694173 | 4372.56 | 679 | 682 | 158.6 |
| C | 15 | 214 | 258821 | 1627.6 | 679 | 682 | 158.6 |
| C | 0 | 207 | 25281 | 155.1 | 679 | 682 | 158.6 |
| D | 13 | 249 | 413891 | 2442.99 | 685 | 664 | 169.1 |
| D | 12 | 79 | 325850 | 1922.5 | 685 | 664 | 169.1 |
| D | 2 | 249 | 322421 | 1902.22 | 685 | 664 | 169.1 |
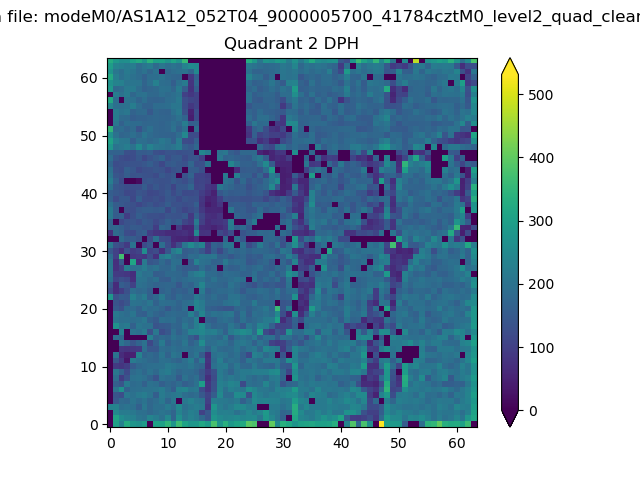
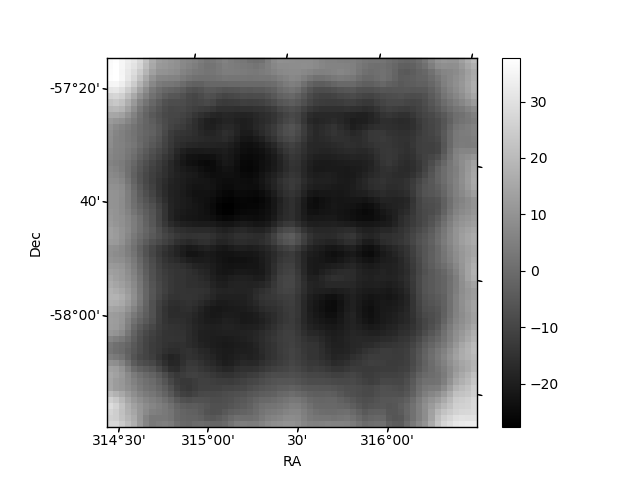
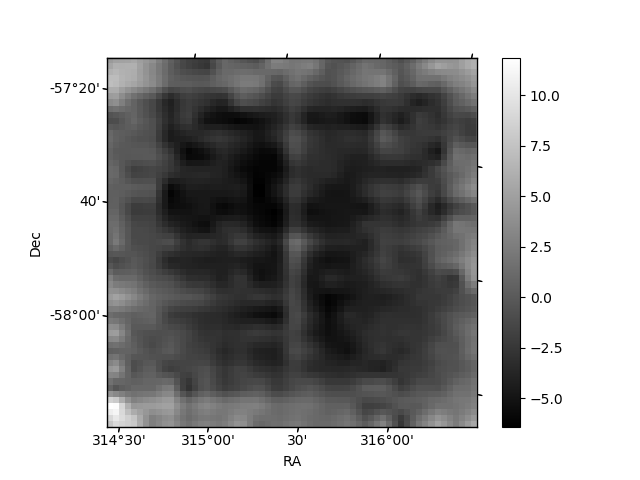
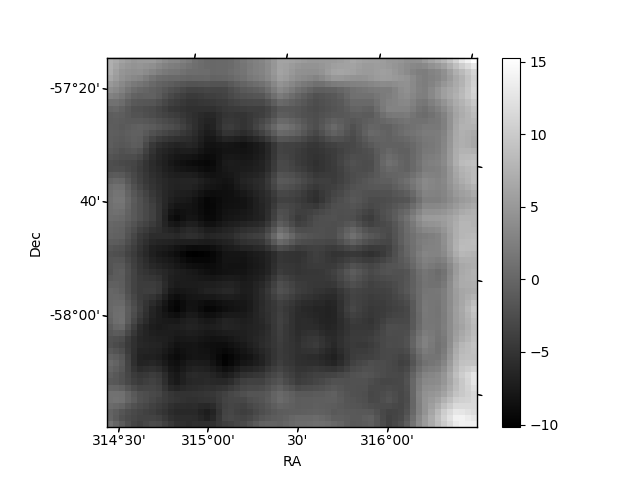
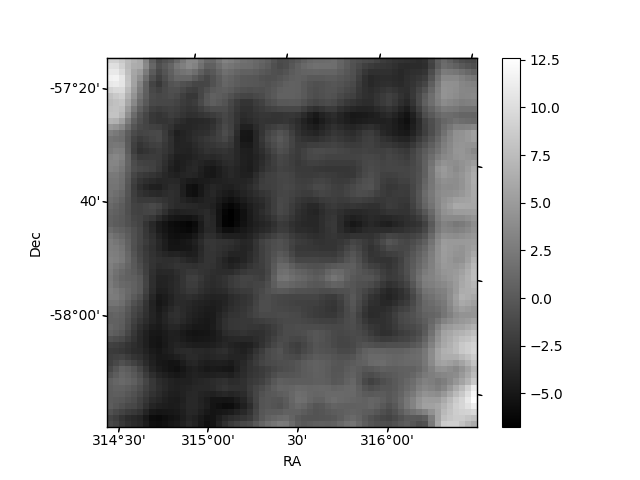
Histogram calculated using DETX and DETY for each event in the final _common_clean file
| Quadrant A | 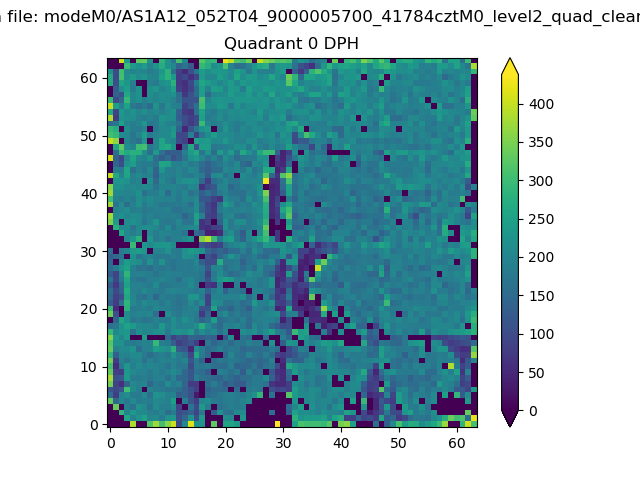 |
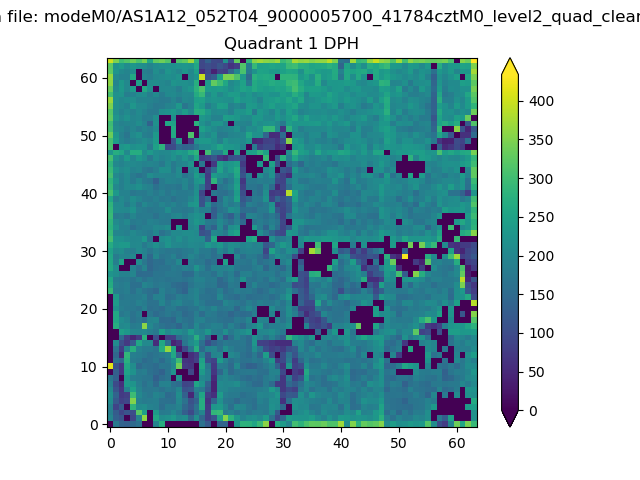 |
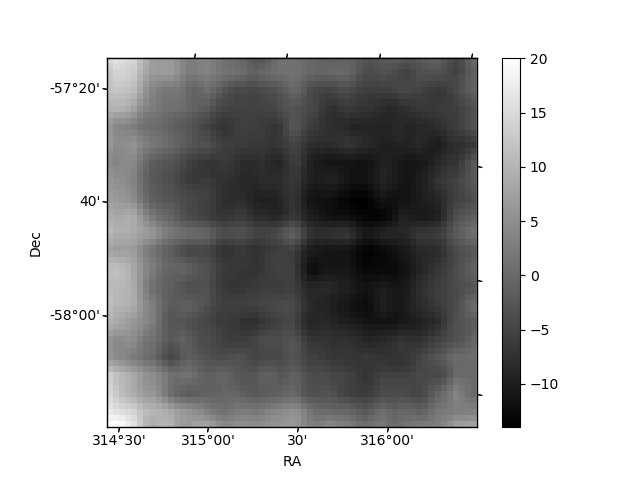
Quadrant B |
|---|---|---|---|
| Quadrant D | 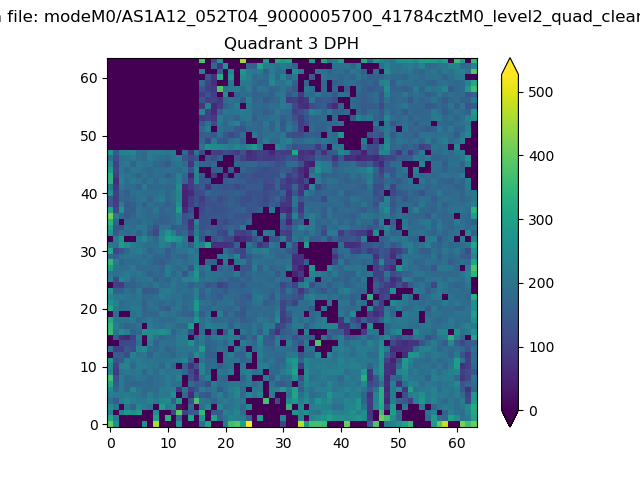 |
 |
Quadrant C |
| Plot type | Count rate plots | Images |
|---|---|---|
| Comparison with Poisson distribution Blue bars denote a histogram of data divided into 1 sec bins. Red curve is a Poisson curve with rate = median count rate of data. |
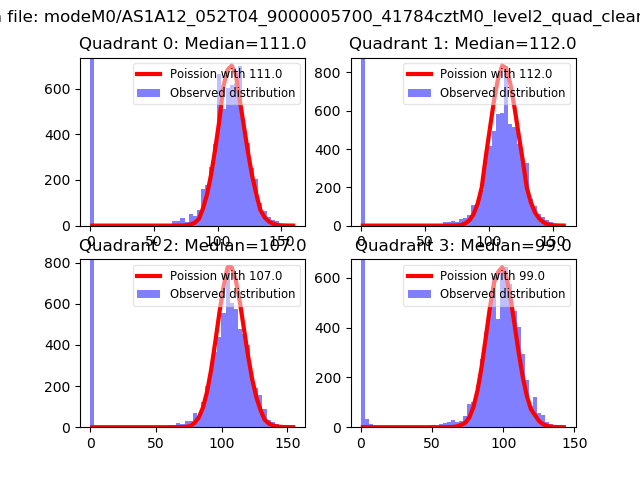 |
 |
| Quadrant-wise count rates Data is divided into 100 sec bins |
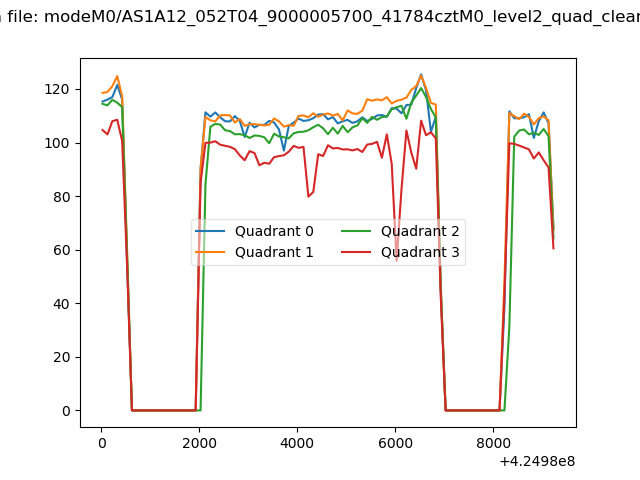 |
|
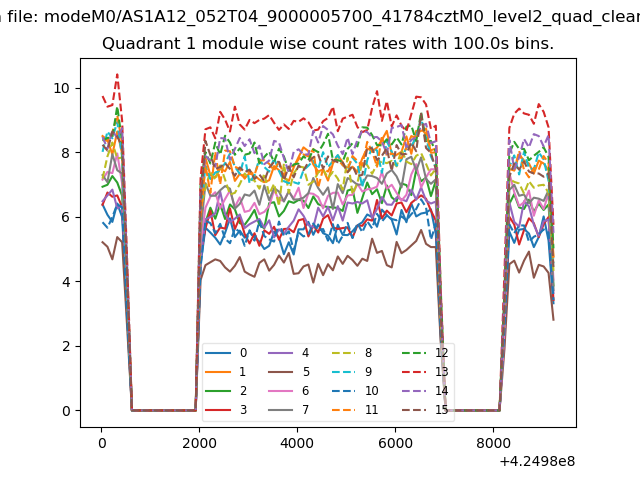
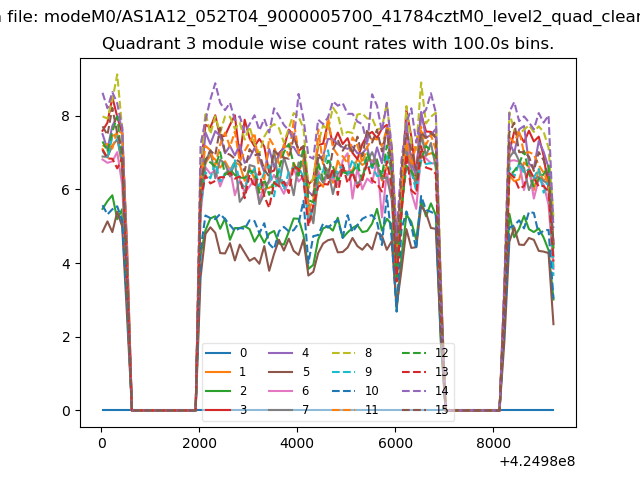
| Module-wise count rates for Quadrant A Data is divided into 100 sec bins |
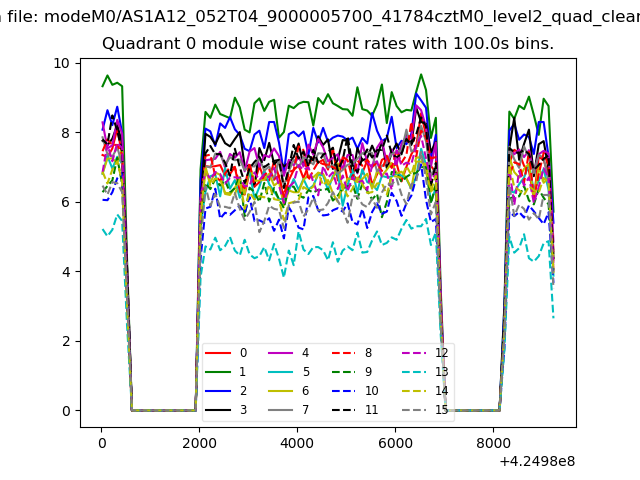 |
 |
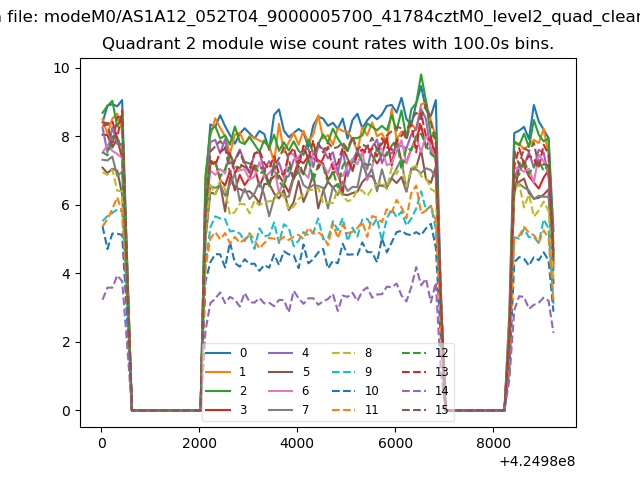
| Module-wise count rates for Quadrant B Data is divided into 100 sec bins |
 |
 |
| Module-wise count rates for Quadrant C Data is divided into 100 sec bins |
 |
 |
| Module-wise count rates for Quadrant D Data is divided into 100 sec bins |
 |
 |
| Parameter | Plot |
|---|---|
| CZT HV Monitor |  |
| D_VDD | 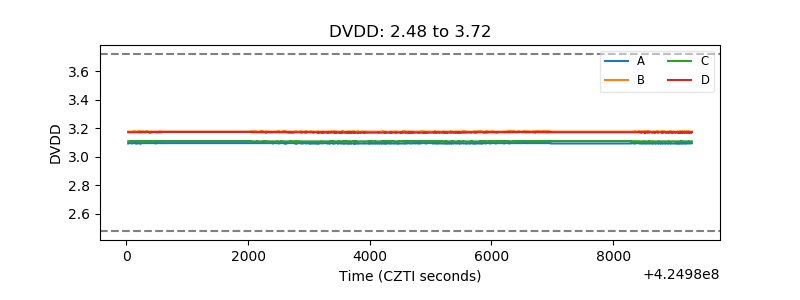 |
| Temperature 1 | 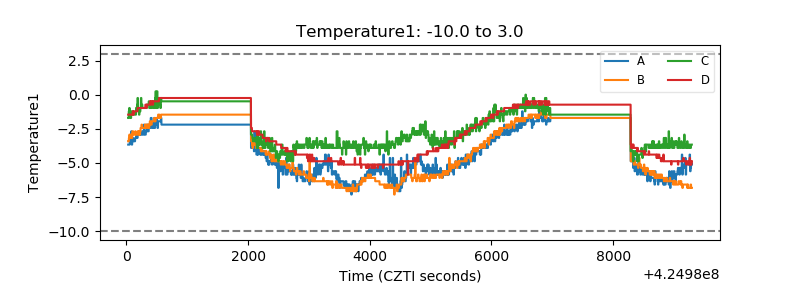 |
| Veto HV Monitor | 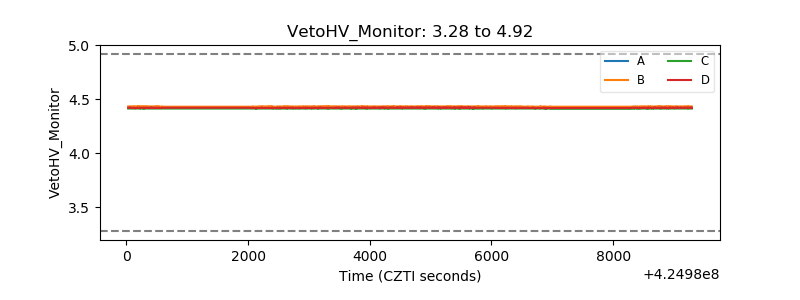 |
| Veto LLD | 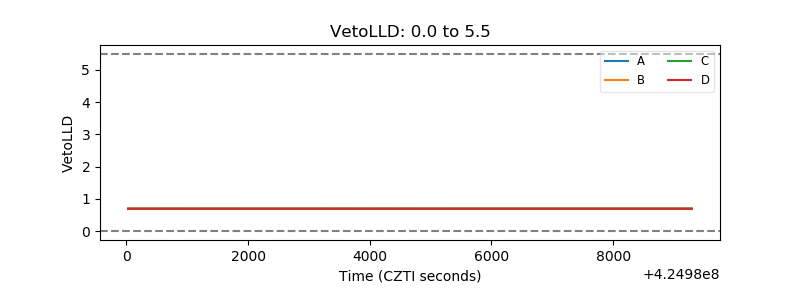 |
| Alpha Counter | 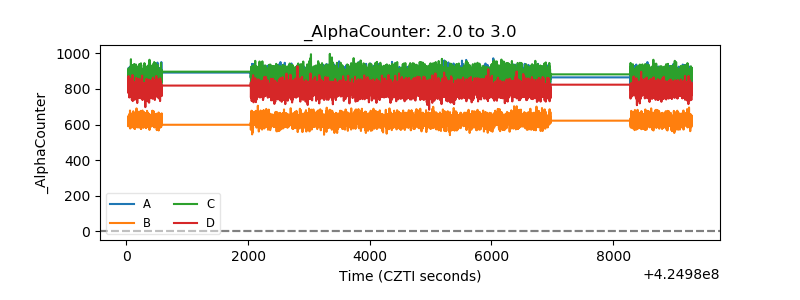 |
| _CPM_Rate | 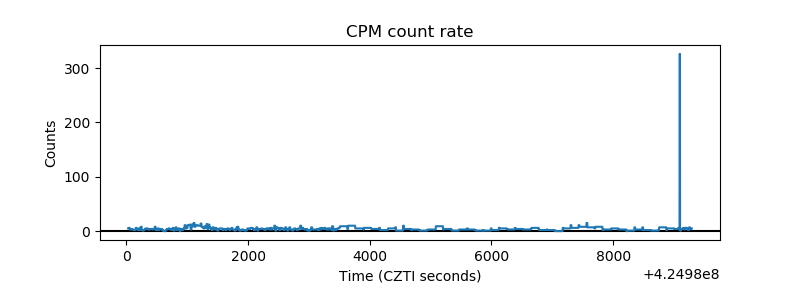 |
| CZT Counter |  |
| +2.5 Volts monitor | 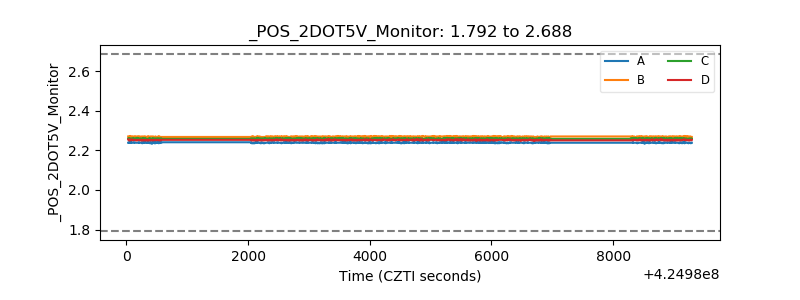 |
| +5 Volts monitor | 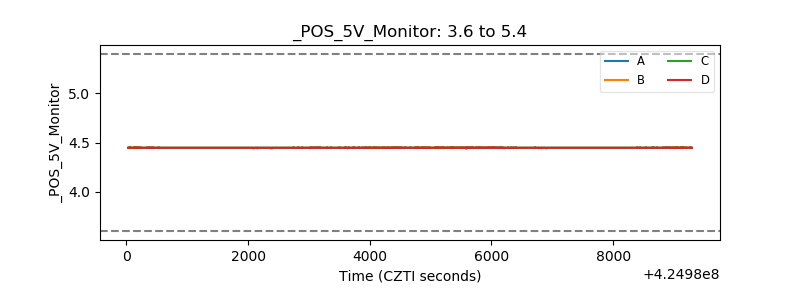 |
| _ROLL_ROT | 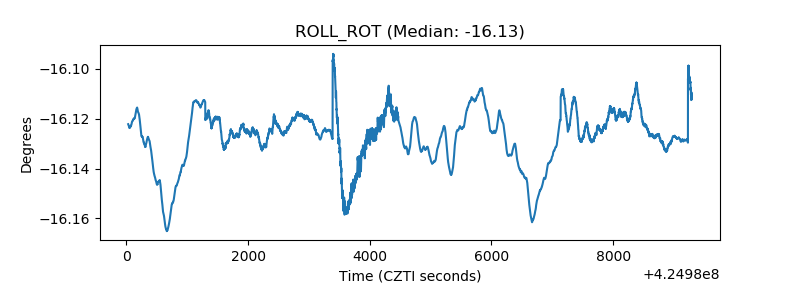 |
| _Roll_DEC | 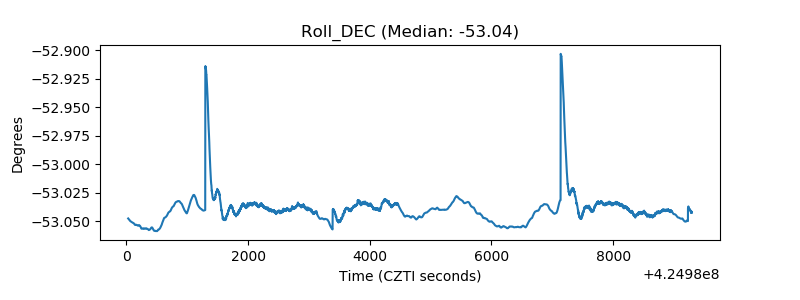 |
| _Roll_RA | 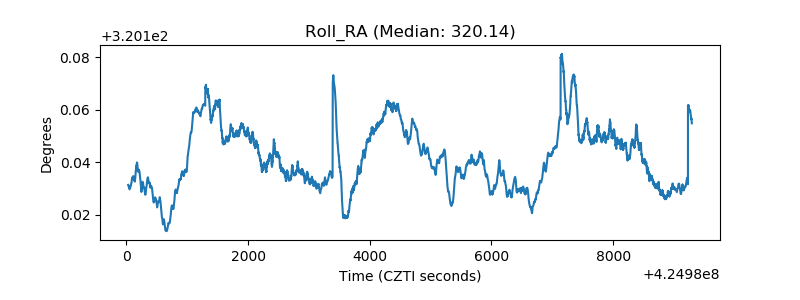 |
| Veto Counter | 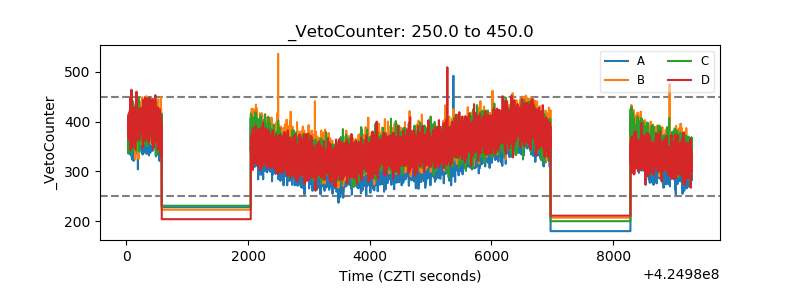 |